


Note this forecast page is not the most recent forecast available.
View the most current forecast report
Researcher Analyzes Arizona COVID-19 Spread Models for Decision-Makers
The following information regarding the spread of COVID-19 in Arizona was prepared by Joe Gerald, MD, PhD, a researcher at the Mel and Enid Zuckerman College of Public Health (MEZCOPH) at the University of Arizona. This information has also been reviewed by other MEZCOPH faculty.
This data were obtained from the Arizona Department of Health Services COVID-19 webpage and reflect conditions in Arizona as of January 8, 2021.
This information is intended to help guide our response to the outbreak. It is not intended to predict how this pandemic will evolve. Rather, this model extrapolates what might occur if current conditions remain unchanged. As regional authorities and healthcare providers respond, their actions are expected to mitigate the worst consequences of this pandemic.

COVID-19 Disease Outbreak Forecast
Arizona State and Pima County
Updated January 8, 2021
Disclaimer: This information represents my personal views and not those of The University of Arizona, the Zuckerman College of Public Health, or any other government entity. Any opinions, forecasts, or recommendations should be considered in conjunction with other corroborating and conflicting data. Updates can be accessed at https://publichealth.arizona.edu/news/2021/covid-19-forecast-model.
**NOTICE** Arizona is experiencing a public health crisis where access to critical care services is limited due to shortages of space, personnel, and critical supplies. At this point, only shelter-in-place restrictions are certain to quickly and sufficiently curtail viral transmission. Because such restrictions impose substantial economic hardships, these measures should be augmented by state expansion of programs to provide direct economic assistance, reduce food insecurity, prevent foreclosure and evictions, and protect access to health services.
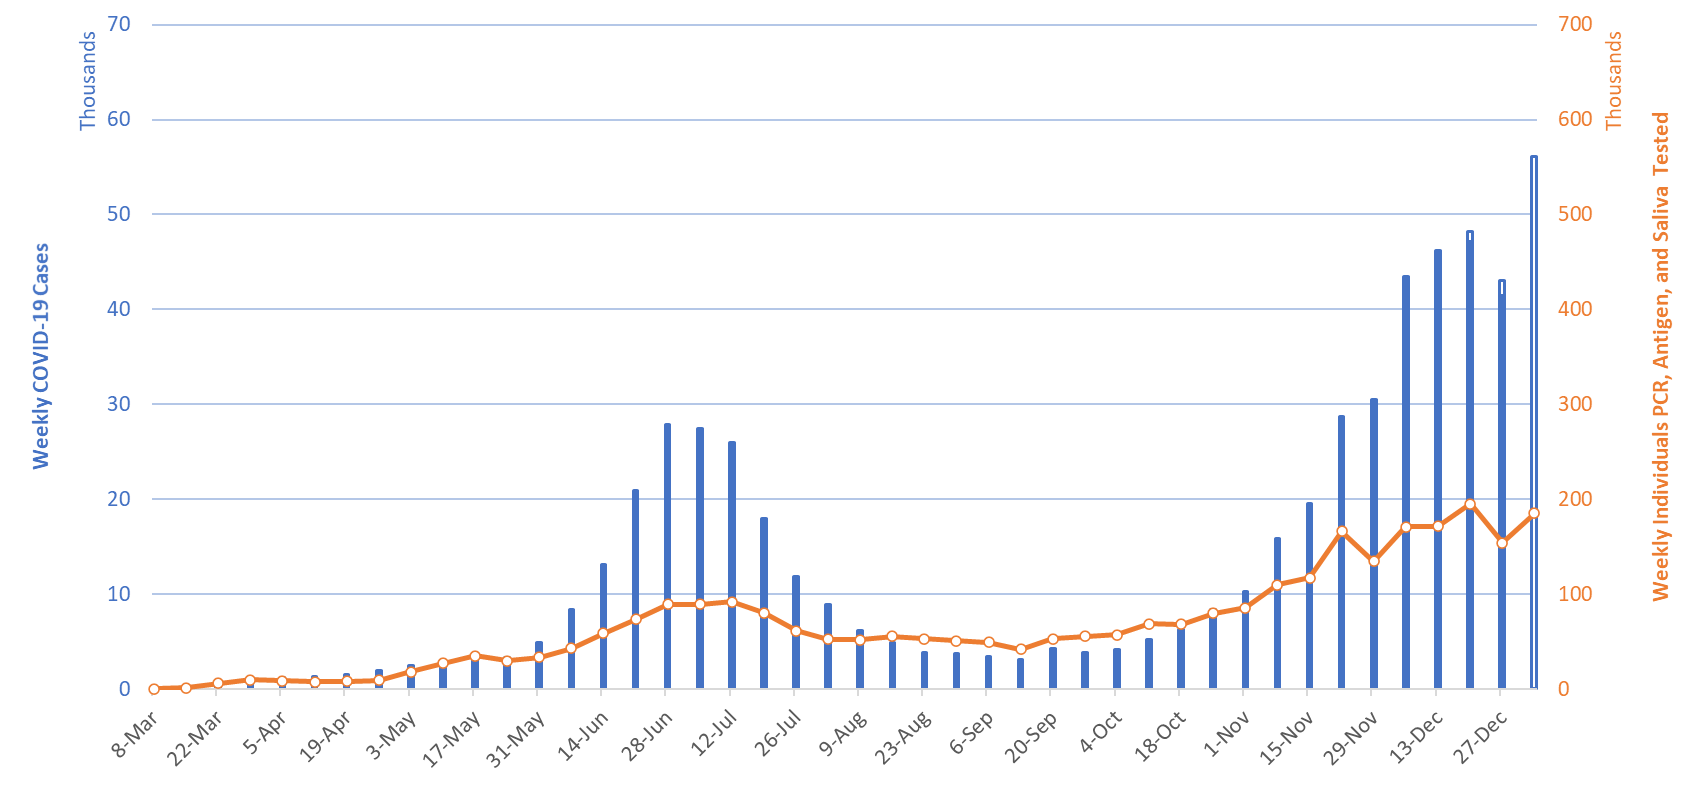
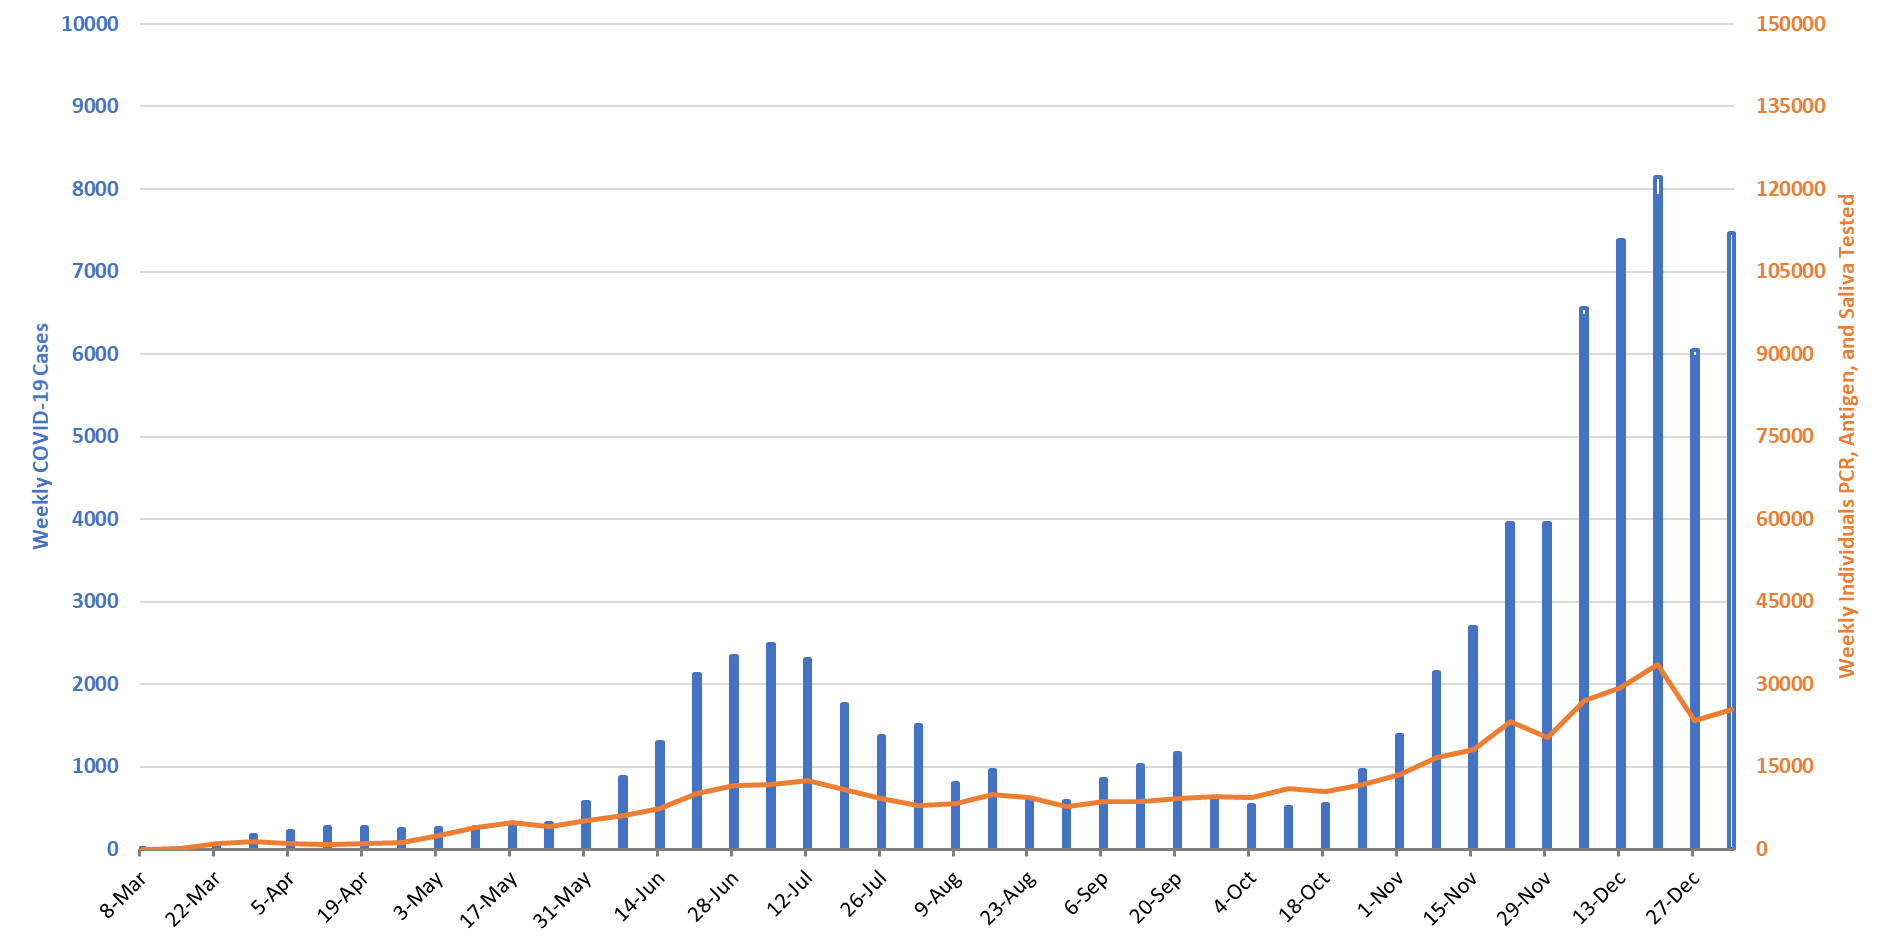
For the week ending January 3rd, at least 56108 new Covid-19 cases were diagnosed in Arizona (Figure 1). This is a 35% increase from last week’s initial tally of 41442 cases which has been upwardly revised by 4% (1603 cases) this week to 43045 cases. Test capacity and/or uptake has rebounded somewhat last week but remains below the levels observed the week ending December 20th.
|
Figure 1. Newly Diagnosed Covid-19 Cases in Arizona and Number of Individuals Undergoing Covid-19 Diagnostic Testing March 1 through January 3, 2021. |
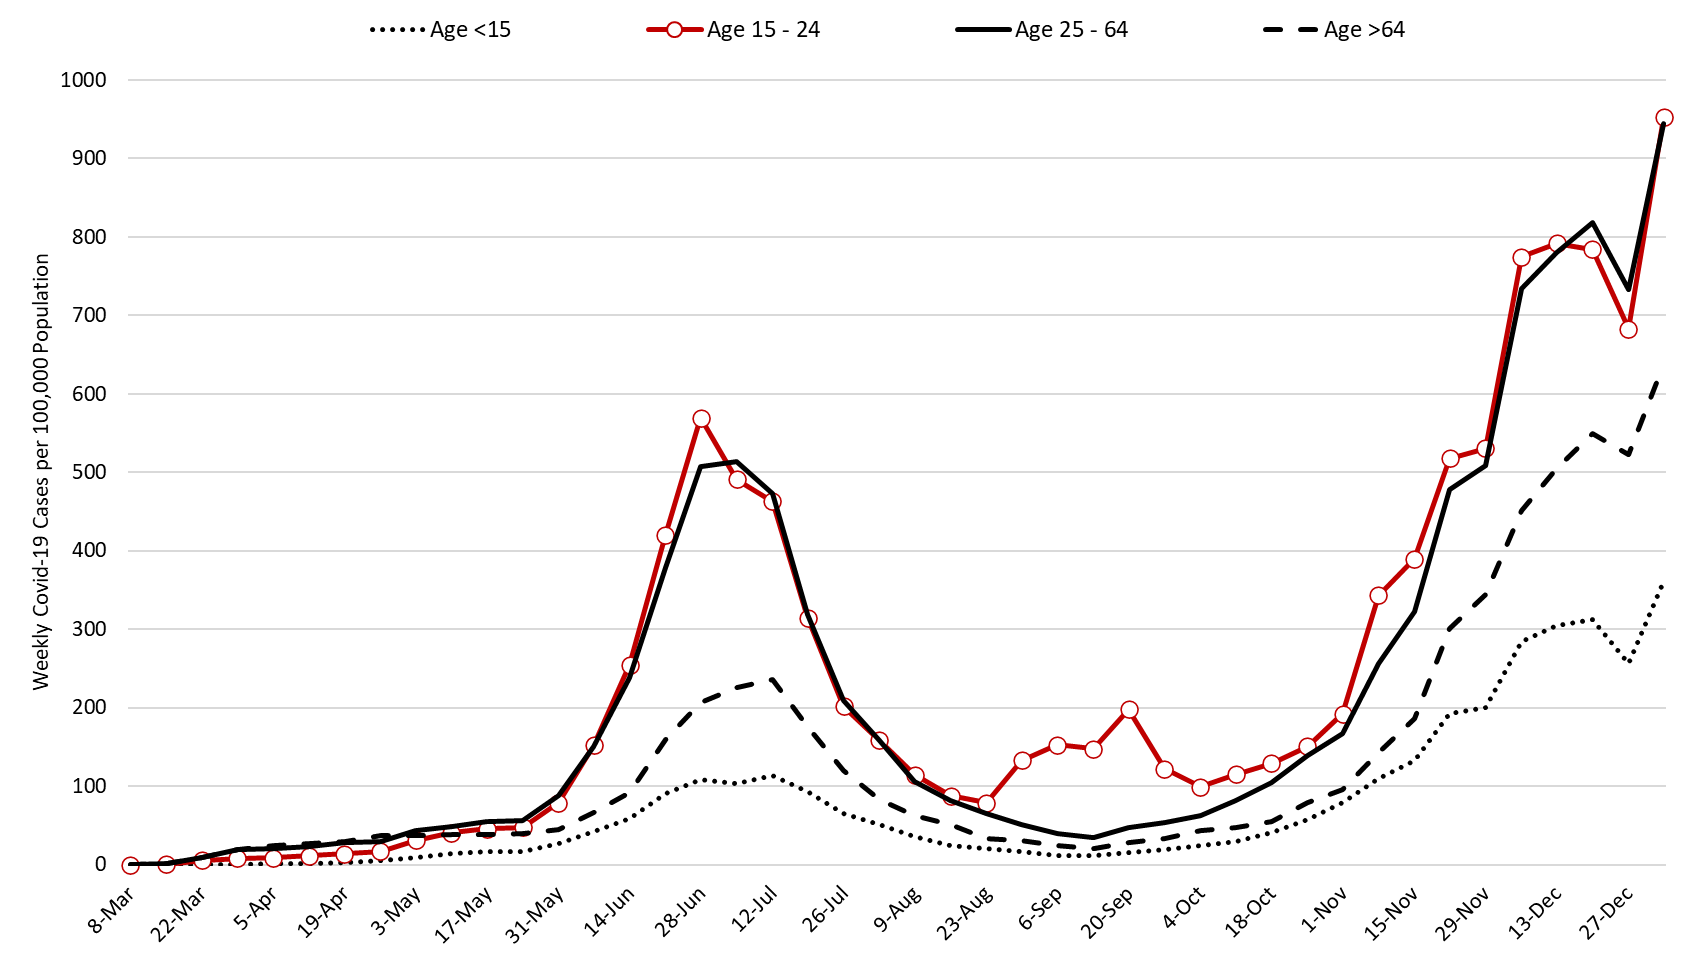
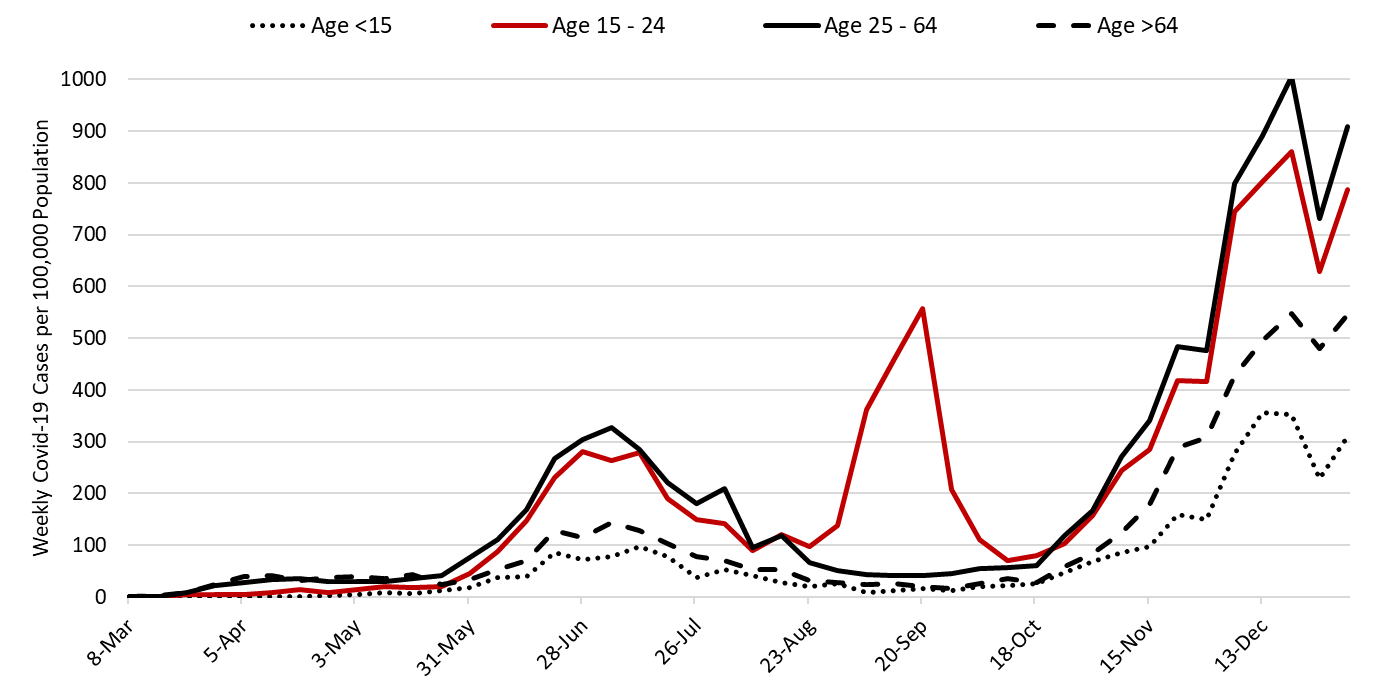
Test positivity continues to increase, setting a record at 35% last week. Viral transmission is likely spreading faster than indicated in this report. The outbreak remains broadly entrenched across all age groups (Figure 2).
Note: Data for this report was updated Friday, January 8 allowing 4 full days to adjudicate cases and keep week-over-week backfill <10%. This allows more interpretable comparisons and graphics. All comparisons are week-over-week changes. Future updates will be released on Saturdays.
|
Figure 2. Newly Diagnosed Covid-19 Cases in Arizona by Age Group March 1 through January 3, 2021. |
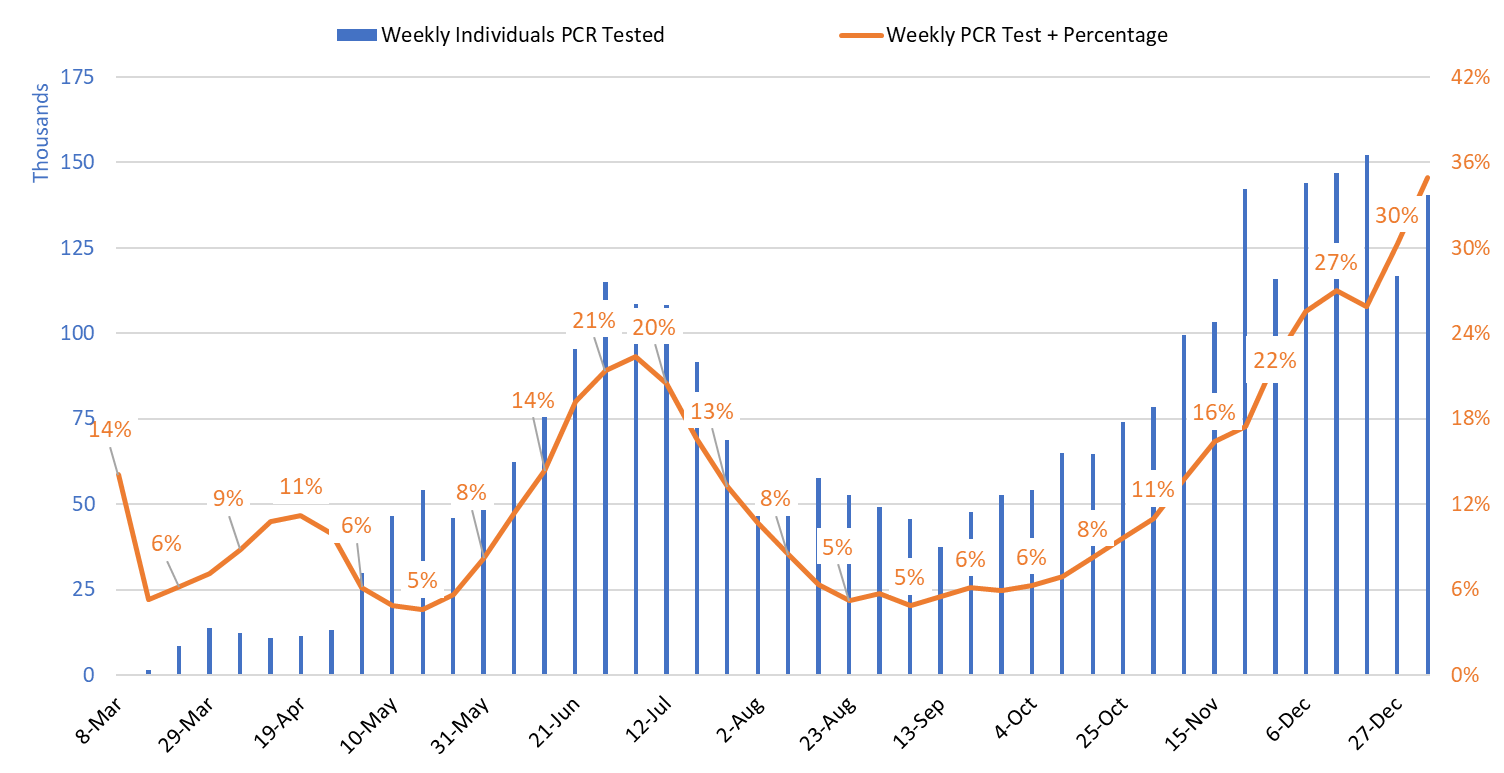
Test positivity among those undergoing traditional PCR testing increased from 30% the week ending December 27th to 35% the week ending January 3rd (Figure 3). Again, the positivity record suggests that viral transmission is higher than indicated by case counts alone.
|
Figure 3. Weekly Number Patients Undergoing Traditional Nasopharyngeal PCR Testing and Associated Percent Positivity March 1 – January 3, 2021. |
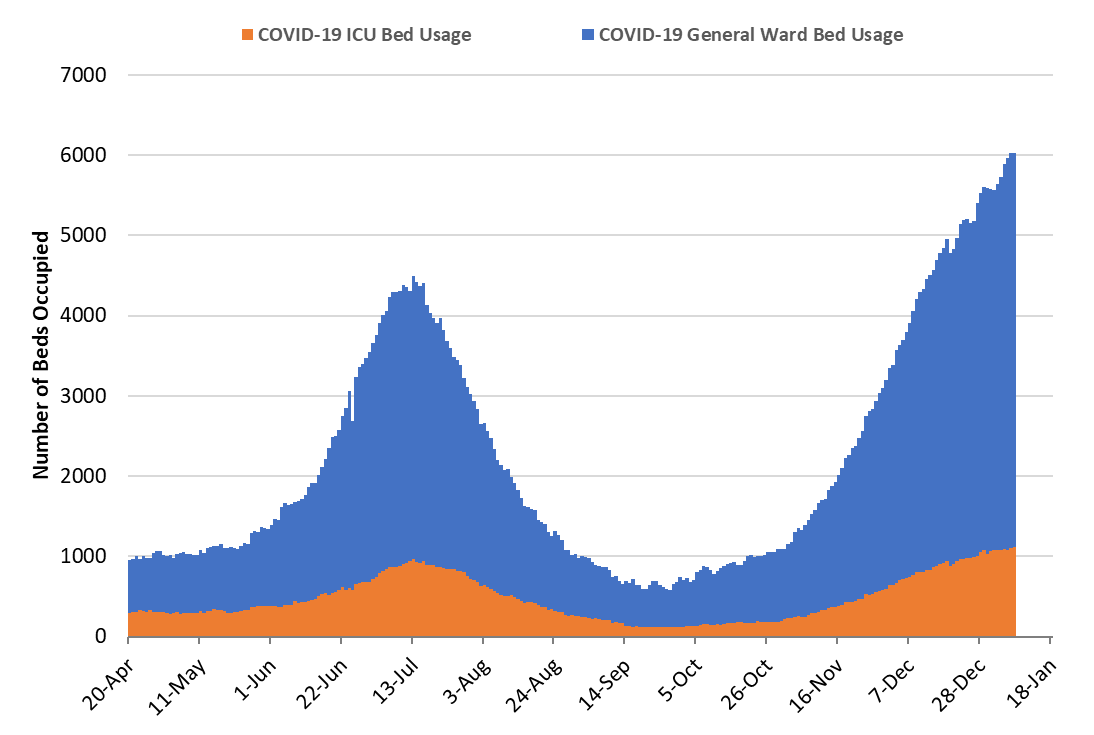
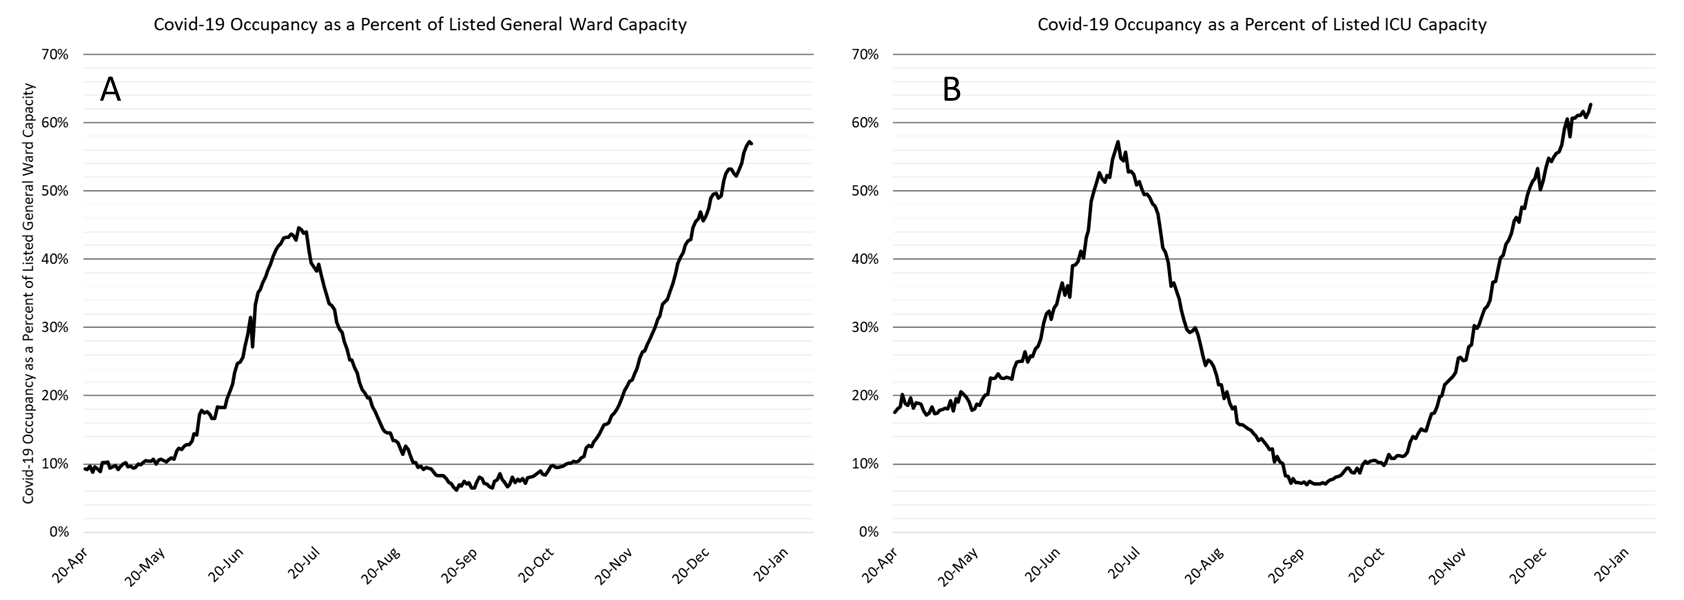
As of Jan 7th, 4907 (57%) of Arizona’s 8618 general ward beds were occupied by Covid-19 patients, a 9% increase from the previous week’s 4501 occupied beds (Figure 4 and Figure 5 Panel A). Another 618 (7%) beds remained available for use. The number of available beds is lower than the previous week’s 666 beds.
At 4907 beds and 57% occupancy, Arizona has once again established new records for ward Covid-19 patients and percent occupancy.
|
Figure 4. Arizona Daily Covid-19 General Ward and ICU Census April 20 – January 7, 2021. |
As of January 7th, 1122 (63%) of Arizona’s 1790 ICU beds were occupied with Covid-19 patients, a 5% increase from the prior week’s count of 1072 patients (Figure 4 and Figure 5 Panel B). An additional 131 (8%) ICU beds remain available. This is lower than the prior week’s 136 beds. Covid-19 occupied ICU beds and percent occupancy have never been higher.
|
Figure 5. Covid-19 Occupancy as a Percent of Listed General Ward (A, left) and ICU (B, right) Capacity in Arizona April 20 – January 7, 2021. |
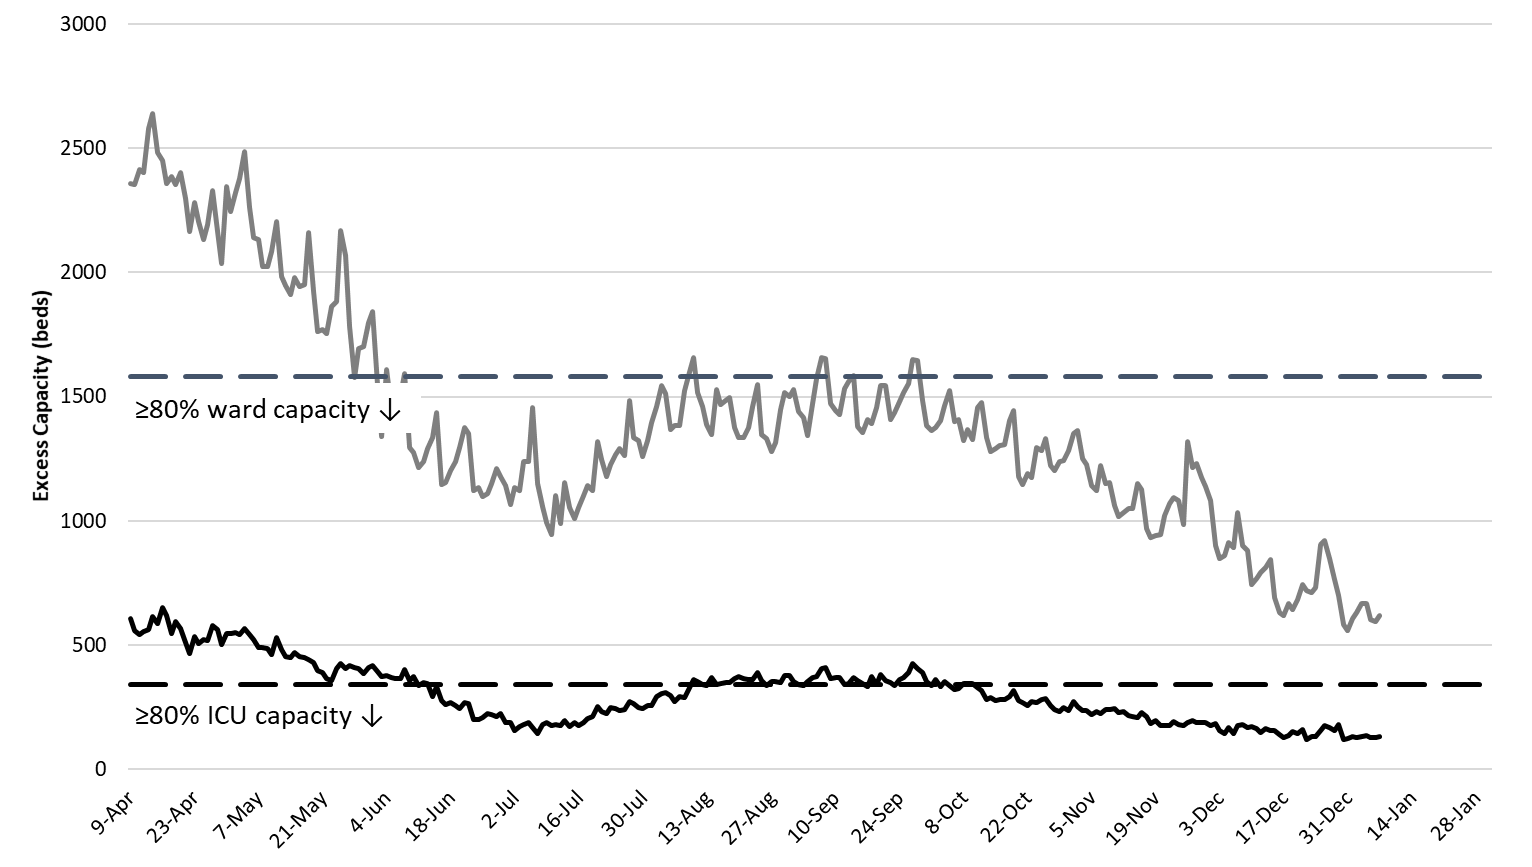
Arizona hospitals’ safety margin continues to erode in the ward and ICU (Figure 6). Most hospitals have canceled scheduled procedures to ensure adequate capacity for patients with Covid-19 care. Arizona hospitals are now relying less on “displacement” and more on triaging by acuity of illness to maintain manageable case loads. Some patients who would have hospitalized 4 – 8 weeks ago are now being managed in the outpatient setting. Make no mistake, the Covid-19 crisis is now placing a greater share of Arizonans’ at-risk, not just those unfortunate enough to contract Covid-19. Nevertheless, the fact that our hospitals have demonstrated such resilience is a testament to the planning, skill, and sacrifice of many health professionals and administrators who will likely never be recognized. Thanks for helping save our bacon!!!
|
Figure 6. Observed Excess Non-Surge General Ward and ICU Capacity April 20 – January 4, 2021. |
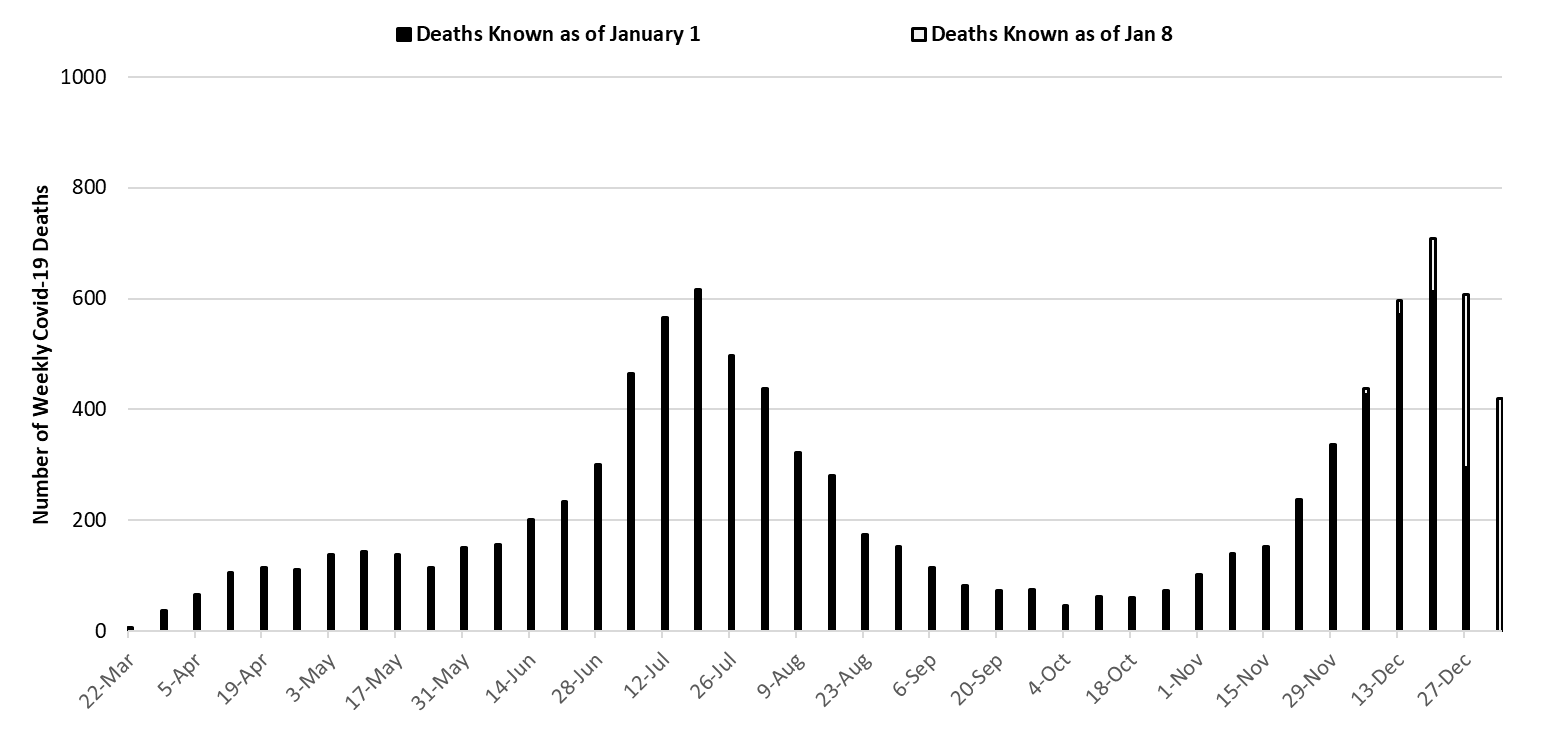
The week ending July 19th is no longer Arizona’s deadliest week (617 deaths). Instead, the week ending December 20th has now recorded 709 deaths. This number increase as more deaths are made known in the coming weeks (Figure 7). Covid-19 deaths will also exceed 700 per week for the foreseeable future. The uniformly increasing mortality curve in Figure 7 should give us pause.
|
Figure 7. Weekly Arizona Covid-19 Deaths March 1 – January 3, 2021. |
The Toll of Covid-19 in Arizona
In the past 10 months, at least 10000 Arizonans have died from Covid-19. In the modern era, this is an unprecedented number of deaths attributable to a single infectious cause.
Table 1. Leading Causes of Death in Arizona (2018)
|
Cause of Death |
2018 Deaths |
|
1. Diseases of the Heart |
12410 |
|
2. Malignant Neoplasms |
12097 |
|
COVID-19 |
10036* |
|
3. Unintentional Injuries |
4211 |
|
8. Influenza and pneumonia |
1113 |
|
*Number of reported deaths in 2020 |
|
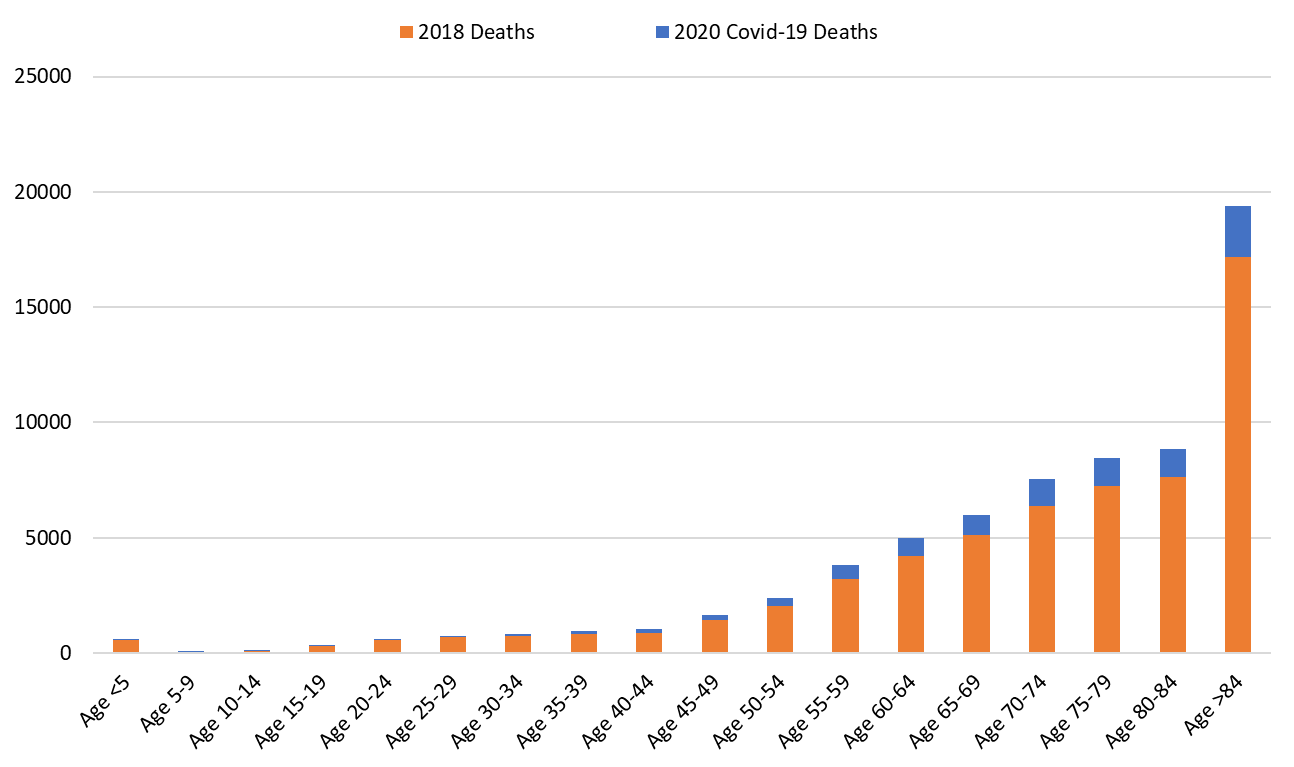
With 10036 deaths so far, Covid-19 will likely become 2020’s 3rd leading cause of death. Covid-19 fatalities will fall behind Diseases of the Heart and Malignant Neoplams (Table 1). The official statistics will undoubtedly underestimate Covid-19’s true toll. For example, the first known Covid-19 fatality occurred on March 17, 2020. Nevertheless, the official count will end in December causing 2.5 months of deaths out of 12 to be pushed forward into the 2021 calendar year. Secondly, one study of excess mortality through May and another through July indicate that the state’s official Covid-19 death toll only accounts for one-half of the excess deaths during the observed period. Taking these factors into account, the “true” tally between March 1, 2020 and February 28, 2021 could plausibly exceed 20,000 deaths.
|
Figure 8. Number of 2020 Covid-19 Deaths above and beyond 2018 All Cause Deaths by Age Group. |
Pima County Outlook
For the week ending January 3rd, 7470 Pima County residents were diagnosed with Covid-19 (Figure 9). This represents a 25% increase from the 5964 cases initially reported last week. Test capacity and/or update remains suppressed from mid-December levels.
|
Figure 9. Covid-19 Cases and Individuals Undergoing Diagnostic Testing in Pima County Mar 1 – Jan 3. |
Last week’s initial tally of 5964 cases was upwardly revised by only 1% (80 cases) this week. Trends are similar across all age groups (Figure 10).
|
Figure 10. Covid-19 Cases by Age Group in Pima County from March 1 – January 3, 2021. |
Summary
- The SARS-CoV-2 virus is mowing through Arizona like a sharpened scythe. Fatalities are stacking up like cordwood in advance of a long winter. Barring intervention, daily cases and fatalities will double or perhaps quadruple before the outbreak collapses under the weight of natural, not vaccine-induced, immunity later this spring. The arrival of the more transmissible UK variant could both hasten and worsen these grim predictions. While Arizonans’ poor individual decisions are undoubtedly contributing to viral spread, the Governor’s inaction in the face of a clear and present danger is of greater concern. Most recently, he has performed more poorly than other governors, but more importantly, he has performed more poorly compared to his prior success this summer. This latter point highlights the calculated indifference of his current response.
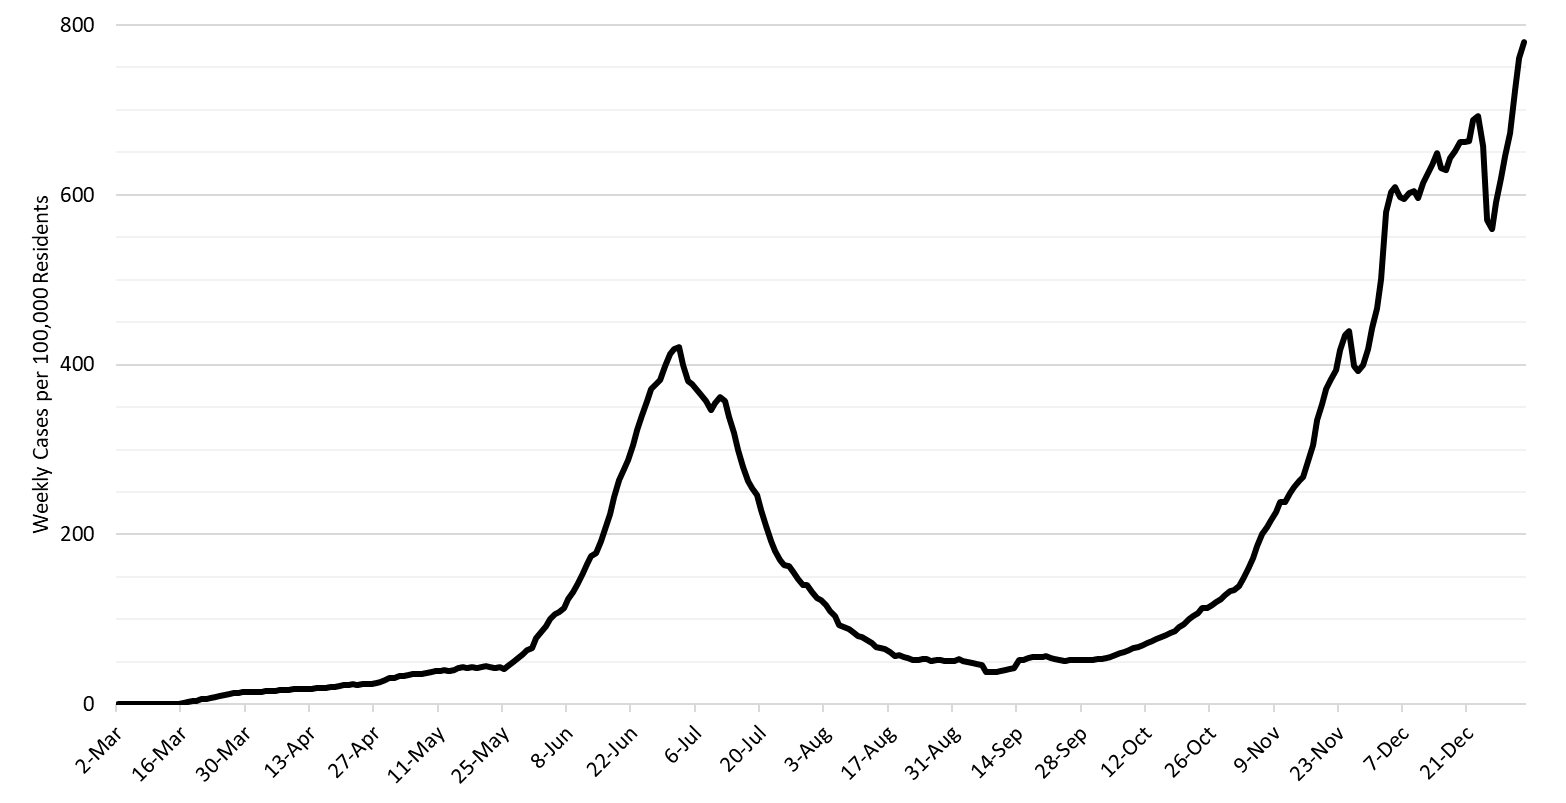
- As of January 3rd, new cases were being diagnosed at a rate of 780 cases per 100,000 residents per week (Figure 11 below). This rate is increasing by approximately 220 cases per 100,000 residents per week although this brisk pace is partly an artifact of last week’s under-counting. According to the CDC, no other state is experiencing faster spread transmission.
- Arizona is now reporting >700 Covid-19 deaths per week (>100 per day) and this count may underestimate true fatalities by half (see Woolf, Woolf, or Weinberger). Many of these deaths were preventable if the state had more aggressively adopted evidenced-based public health practices. Arizona weekly tally of deaths ranks second behind that of Rhode Island.
- Emerging evidence from New Zealand suggests that strict Covid-19 control measures are not associated with excess mortality from other causes. In fact, New Zealand experienced an 11% reduction in all-cause mortality while only experiencing 25 Covid deaths. This should begin to debunk the false narrative about our response being worse than the virus itself. New Zealand’s economic performance also belies the false narrative surrounding the choice between saving ourselves and saving our economy.
- With >10,000 Covid-19 deaths reported to date, Covid-19 will almost certainly be recognized as Arizona’s third leading cause of death in 2020. This will be 10 times the number of influenza and pneumonia deaths typically reported. If Covid-19’s true toll was accurately captured, it would likely rank as Arizona’s leading cause of death. Given the outbreak’s current severity, these numbers could be repeated in 2021.
- A state-wide shelter-in-place order, or at minimum, a resumption of the summer’s targeted business closures is warranted to slow transmission and to mitigate overcrowding in our hospital system. A state-wide mask mandate is also warranted. Individuals and business who do not comply with restrictions should face sanctions.
- If such actions are taken, they must be accompanied by additional state funds to alleviate food insecurity, to prevent evictions and foreclosures, and to protect access to health services through the end of spring.
- Acknowledging that a shelter-in-place order is unlikely, counties should be granted additional authority to establish and enforce alternative Covid-19 mitigation policies.
- All Arizona residents should wear a mask in public, avoid social gatherings, maintain physical distance from non-household contacts, avoid >15 minutes contact in indoor spaces, especially if physical distancing is inadequate and adherence to face masks is low.
- Hospital Covid-19 occupancy continues to increase with each week setting new records for ward and ICU occupancy. If viral transmission continues to increase, hospitals’ coping mechanisms could be exhausted before the end of January. Because many of these coping mechanisms are hidden from view, it is likely that hospitals will appear to fail abruptly and with little “seeming” warning.
- Hospitals continue to postpone scheduled procedures to create additional capacity for Covid-19 patients at the expense of others with serious medical conditions. However, patients who would have been previously hospitalized are undoubtedly being treated in an outpatient setting.
- Health professionals are being asked to work additional hours and assume duties outside their traditional scope of practice. Shortages and burn-out will degrade our capacity to provide critical care services over the coming weeks.
- The test positivity rate for traditional nasopharyngeal PCR testing set another record this week at 35% positivity. This indicates a substantial mismatch between testing capacity and demand and supports the notion that viral transmission is growing faster than case counts alone would suggest, that our viral control measures are wholly inadequate, and our testing capacity compared to other regions is poor.
|
Figure 11. 7-Day Moving Average of Covid-19 Cases in Arizona by Data of Test Collection Mar 1 – Jan 3, 2021. |
Forecast reports to date, available as PDFs
Download PDF to view additional charts of Arizona counties, available in appendix of report.
2020 Reports
Based on what we know now about this pandemic, we support guidelines for social distancing to slow the spread of the virus and urge everyone to follow the recommendations provided by the Centers for Disease Control and Prevention (CDC) to protect yourself, your family, your neighbors, and your employees. Please heed the recommendations as provided by the CDC, found at the following website: https://www.cdc.gov/coronavirus/2019-ncov/prepare/prevention.html
COVID covid coronavirus virus covid19 corona forecast model