
Weekly Arizona COVID-19 Data Report – Dr. Joe Gerald, July 23
Note this forecast page is not the most recent forecast available.
View the most current forecast report
Researcher Analyzes Arizona COVID-19 Spread Models for Decision-Makers
The following information regarding the spread of COVID-19 in Arizona was prepared by Joe Gerald, MD, PhD, a researcher at the Mel and Enid Zuckerman College of Public Health (MEZCOPH) at the University of Arizona. This information has also been reviewed by other MEZCOPH faculty.
This data were obtained from the Arizona Department of Health Services COVID-19 webpage and reflect conditions in Arizona as of July 23, 2021.
This information is intended to help guide our response to the outbreak. It is not intended to predict how this pandemic will evolve. Rather, this model extrapolates what might occur if current conditions remain unchanged. As regional authorities and healthcare providers respond, their actions are expected to mitigate the worst consequences of this pandemic.

COVID-19 Disease Outbreak Forecast
Arizona State and Pima County
Updated July 23, 2021
Disclaimer: This information represents my personal views and not those of The University of Arizona, the Zuckerman College of Public Health, or any other government entity. Any opinions, forecasts, or recommendations should be considered in conjunction with other corroborating and conflicting data. Updates can be accessed at https://publichealth.arizona.edu/news/2021/covid-19-forecast-model.
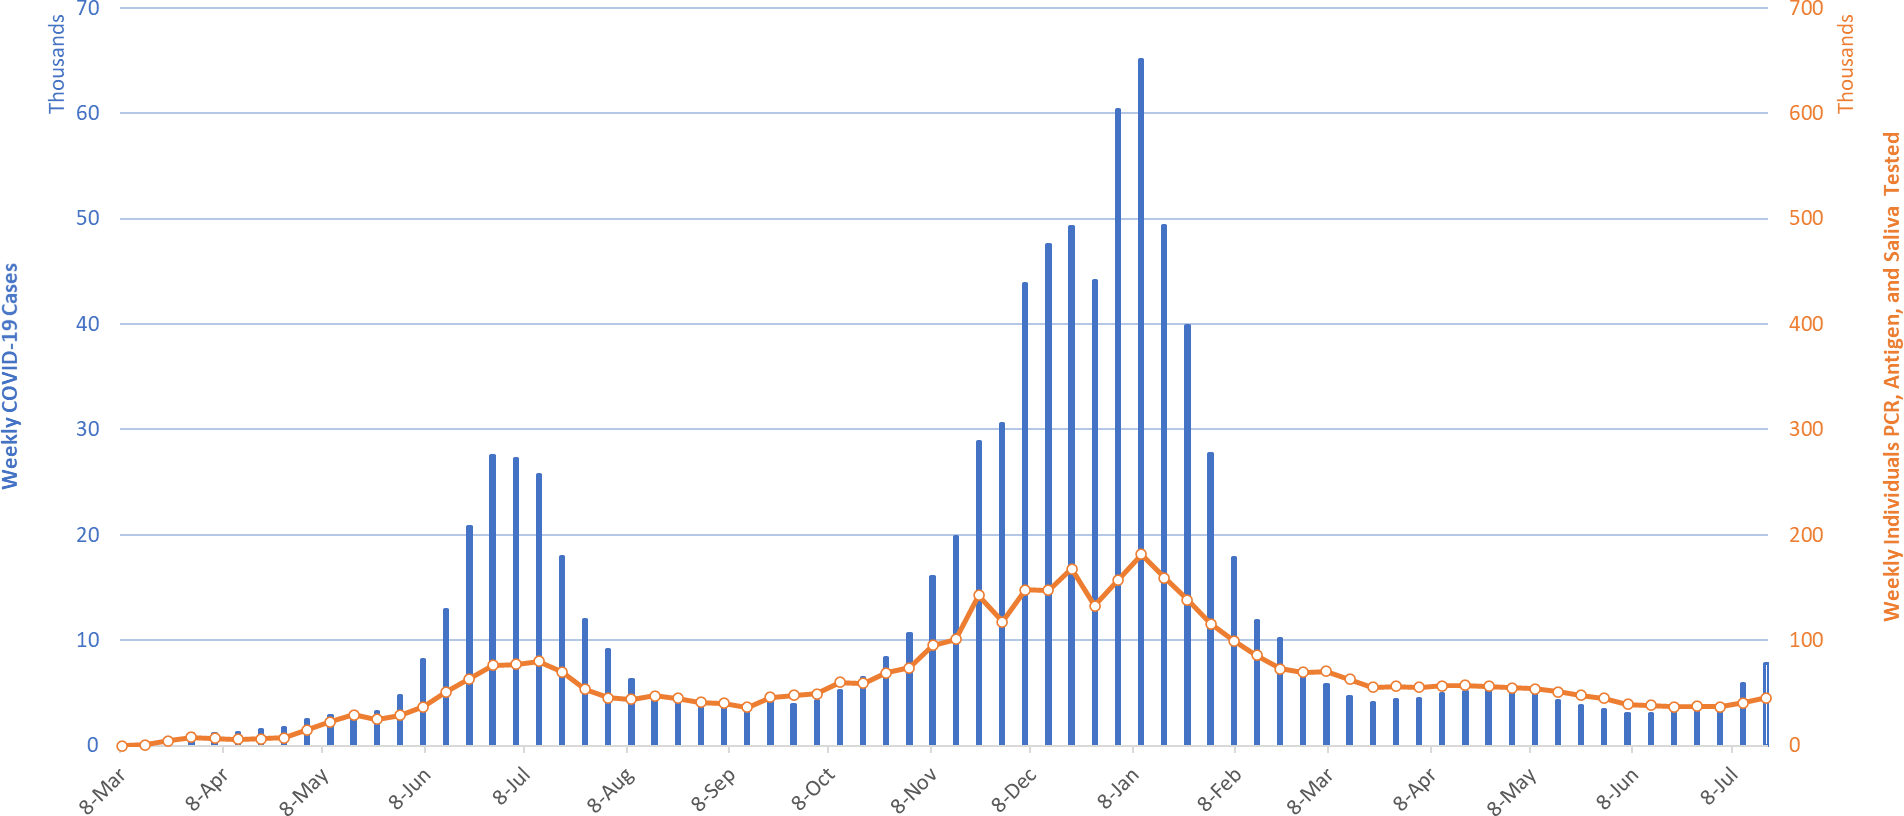
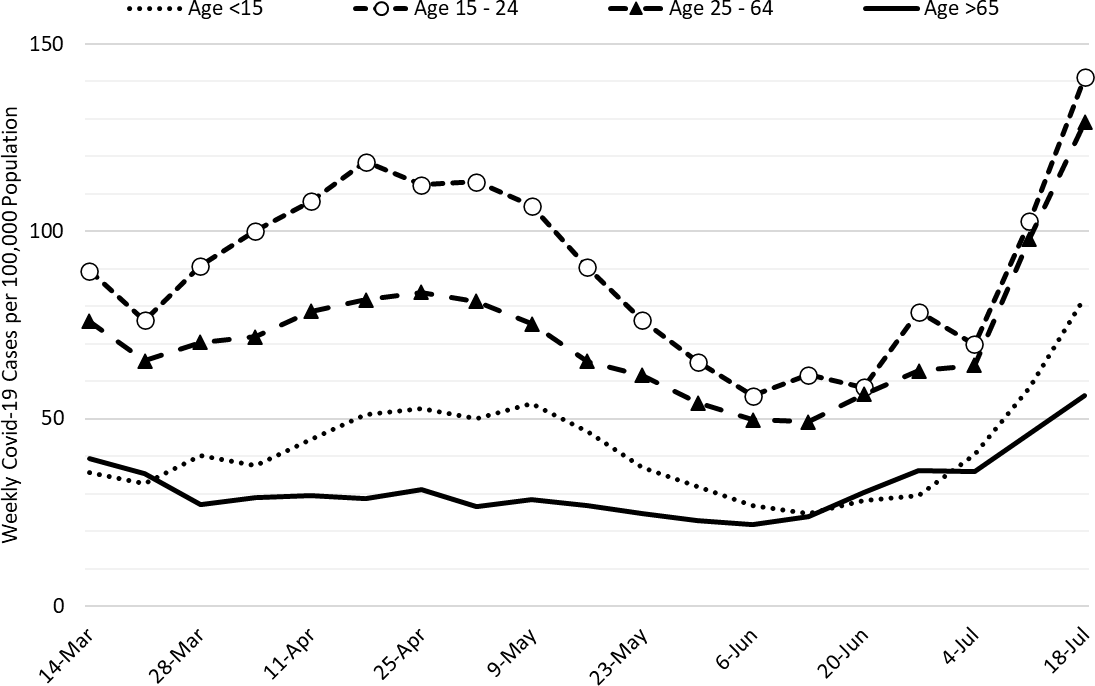
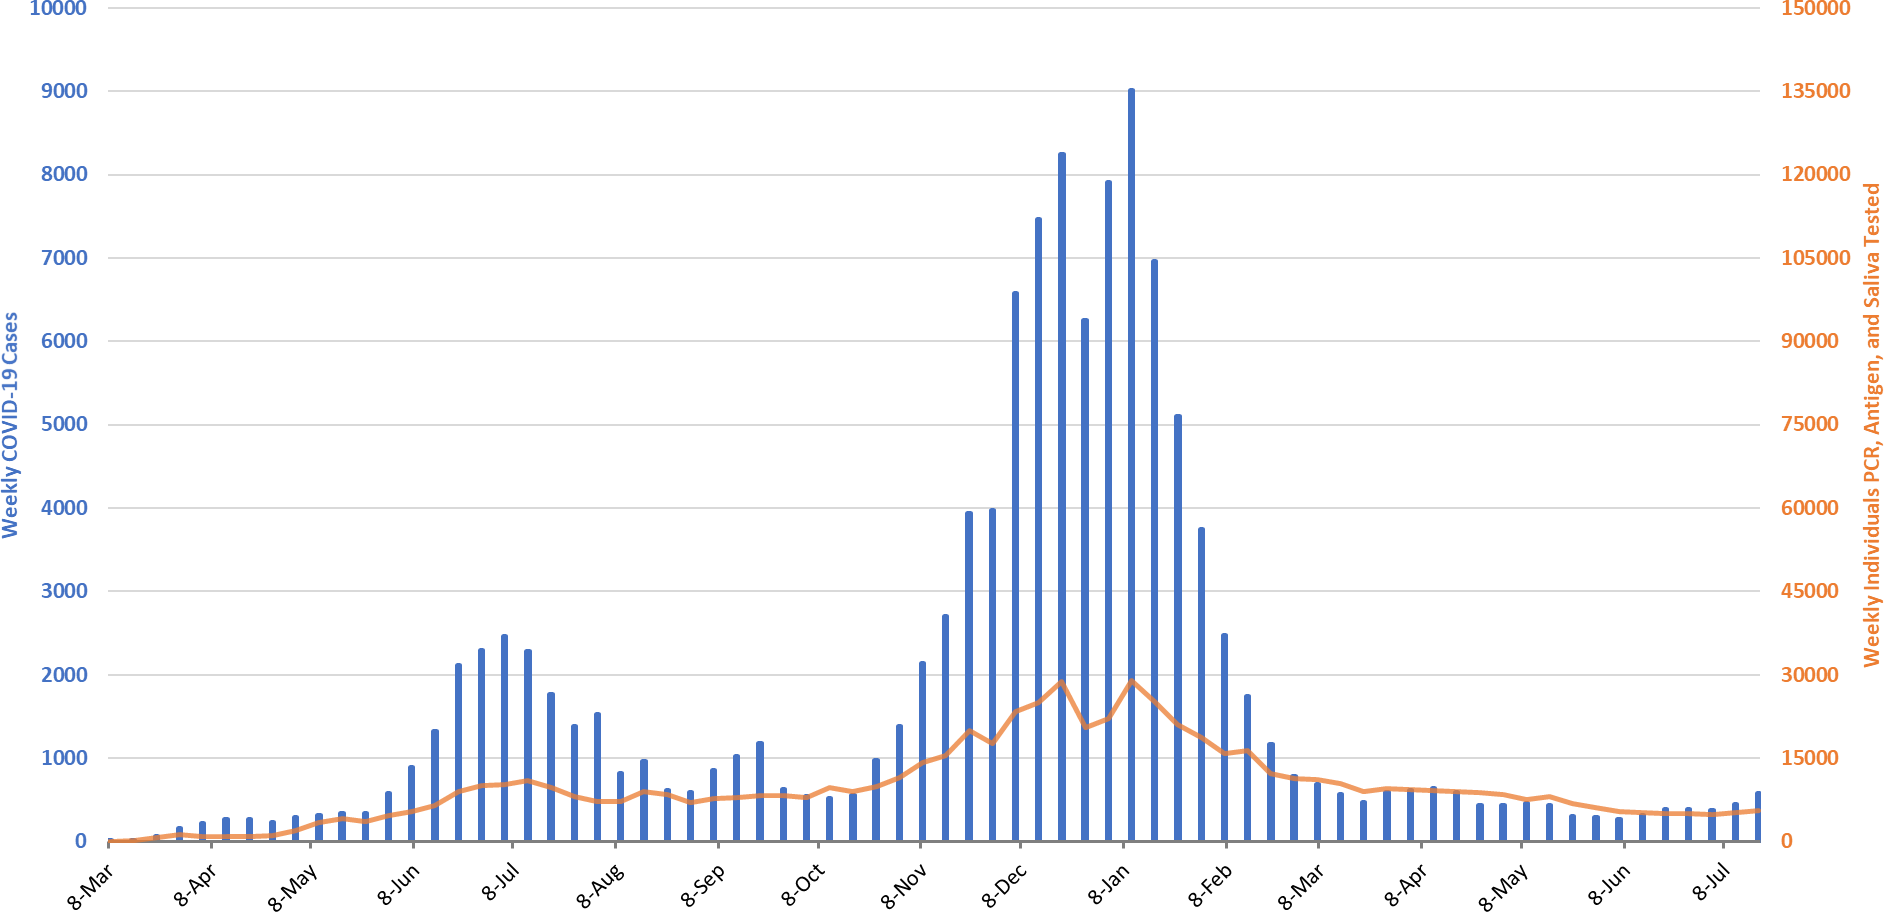
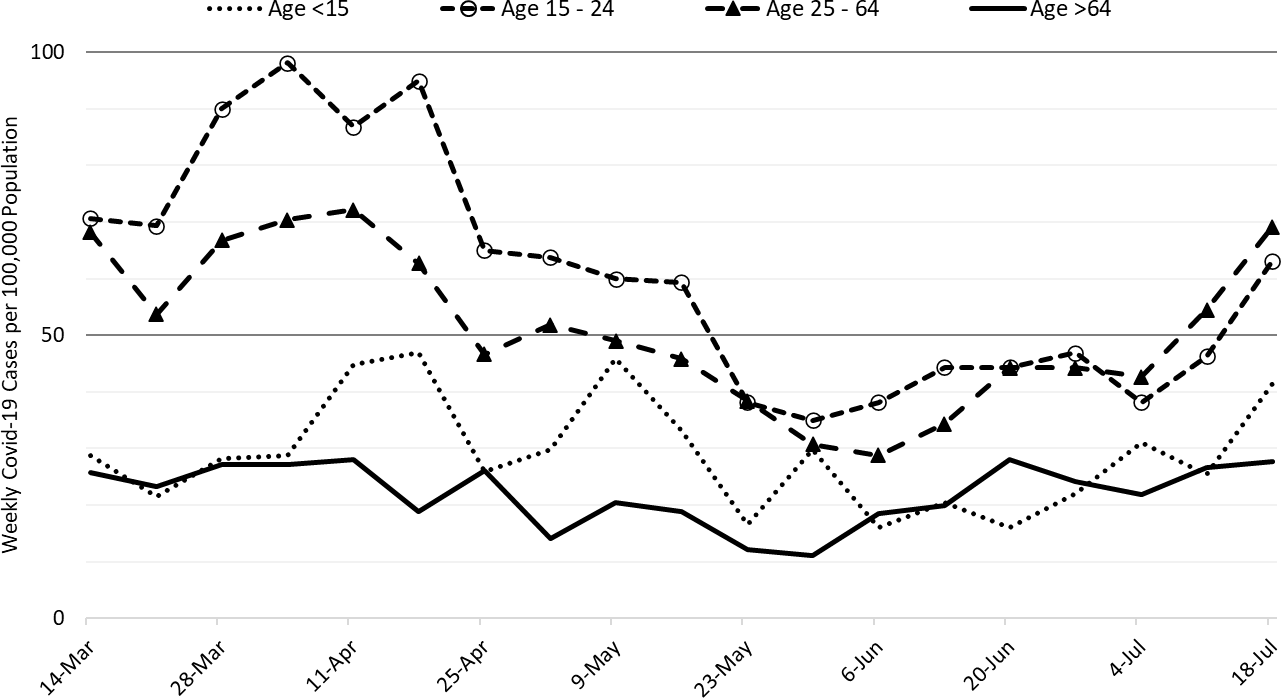
For the week ending July 18th, 7836 Arizonans were diagnosed with COVID-19, a 35% increase from last week’s initial tally of 5813 cases (Figure 1). This marks a 6th week of increasing rates with the last two being particularly brisk. The current rate, 108 cases per 100K residents per week, is increasing by 27 cases per 100K residents per week. While rates are three times higher among those 15 – 24 years of age as compared to those ≥65 years of age, 141 versus 56 cases per 100K residents per week, respectively, transmission is increasing among all age groups (Figure 2a).
|
Figure 1. Newly Diagnosed Covid-19 Cases in Arizona and Number of Individuals Undergoing Covid-19 Diagnostic Testing March 1, 2020 through July 18, 2021. |
Arizona has now surpassed the threshold marking high levels of transmission. Unfortunately, the potential size and/or duration of this outbreak remains uncertain. At 108 cases per 100K residents, Arizona ranks 12th among the 50 states. Louisiana, Florida, Arkansas, and Missouri are currently leading the pack with rates more than double ours: 302, 291, 272, and 252 cases per 100K residents per week, respectively. Fortunately, these rates remain well below the peaks seen during January 2021 outbreak.
According to the CDC, 55% of Arizona adults have received 2-doses of vaccine while another 9% have received 1-dose. For a bit of perspective, only 43% of adults were vaccinated against influenza in the 2019-2020 season so we are doing better than usual, but still not good enough. While Arizona passed peak vaccination rates in early April, about 60 thousand doses were administered last week. Even though we are months away from achieving >70% fully vaccinated, our efforts are still making progress. As slow and frustrating as it may seem, it is important to continue vaccine outreach.
Note: Data for this report was updated Thursday, July 22.
|
Figure 2a. Newly Diagnosed Covid-19 Cases in Arizona by Age Group March 7 – July 18, 2021. |
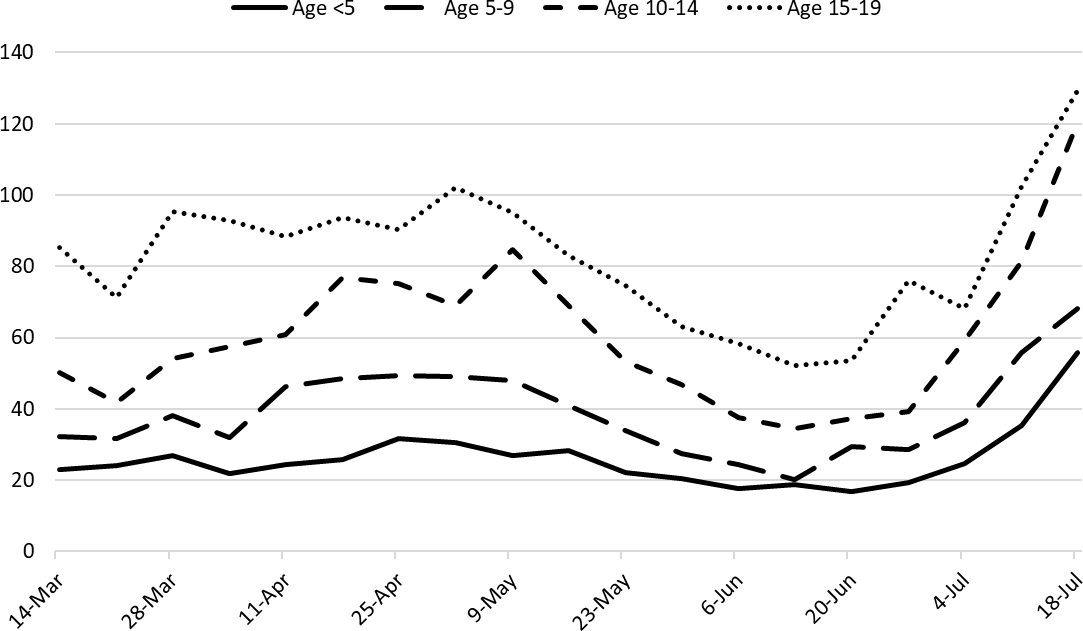
Many K – 12 schools are resuming in-person instruction. Trends in childhood case rates are shown in Figure 2b. As discussed in prior reports, children 15 – 19 years of age have case rates that approximate those of adults while prepubertal children have lower rates likely owing to physiologic and behavior differences. Even though mask wearing in classrooms is recommended by the CDC (unvaccinated) and the American Academy of Pediatrics (everyone), out state isn’t going to follow suit. Yet another reason to keep supporting vaccination efforts.
|
Figure 2b. Newly Diagnosed Covid-19 Cases in Arizona by Age Group March 7 – July 18, 2021. |
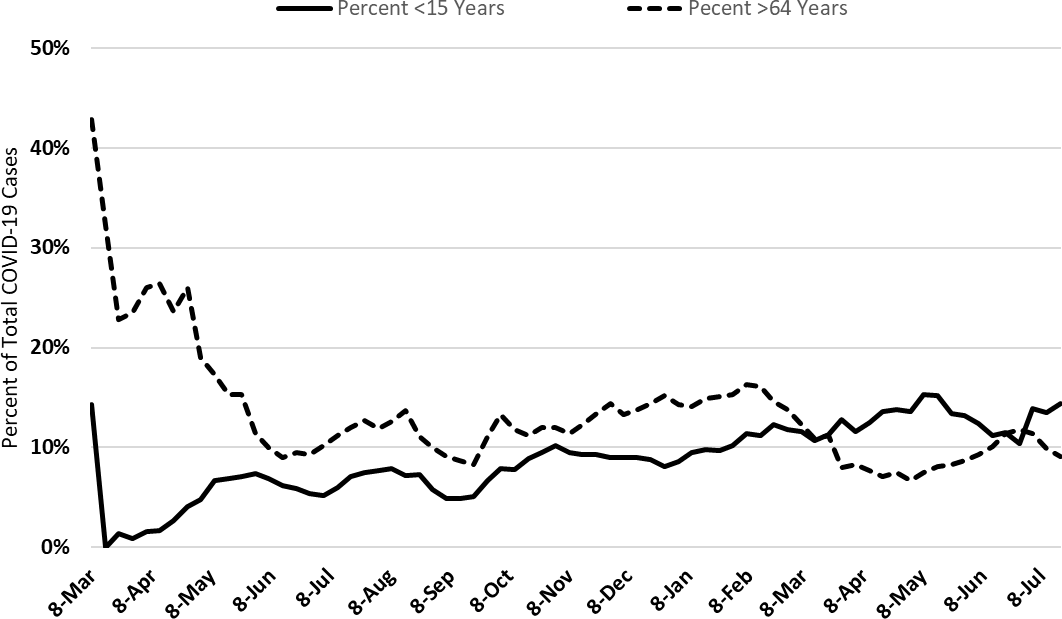
Figure 2c left shows that the proportion of cases attributable to children and older adults has been relatively stable over time, 15% of all cases for both age groups, despite the availability of vaccines. These data help dispel undue angst that children are responsible for COVID-19 outbreaks in the post-vaccine era. Like in the past, particularly in Arizona, adults are letting children down, not the other way around.
The state is also attempting to prohibit schools from instituting differential quarantine strategies where the unvaccinated would be required to quarantine following an exposure while the vaccinated and asymptomatic could carry on as normal (CDC recs).
A report of a summer camp outbreak indicates that the secondary attack rate within households of infected campers was 45%, meaning about one-half of all contacts within the household became infected. It difficult to think that schools and summer camps are all that different with regard to transmission risk. The good news is that wearing a facemask and maintaining physical distancing both reduced transmission by half.
|
Figure 2c. Percent of COVID-19 Cases Attributable to Children and Older Adults March 7,2020 – July 18, 2021. |
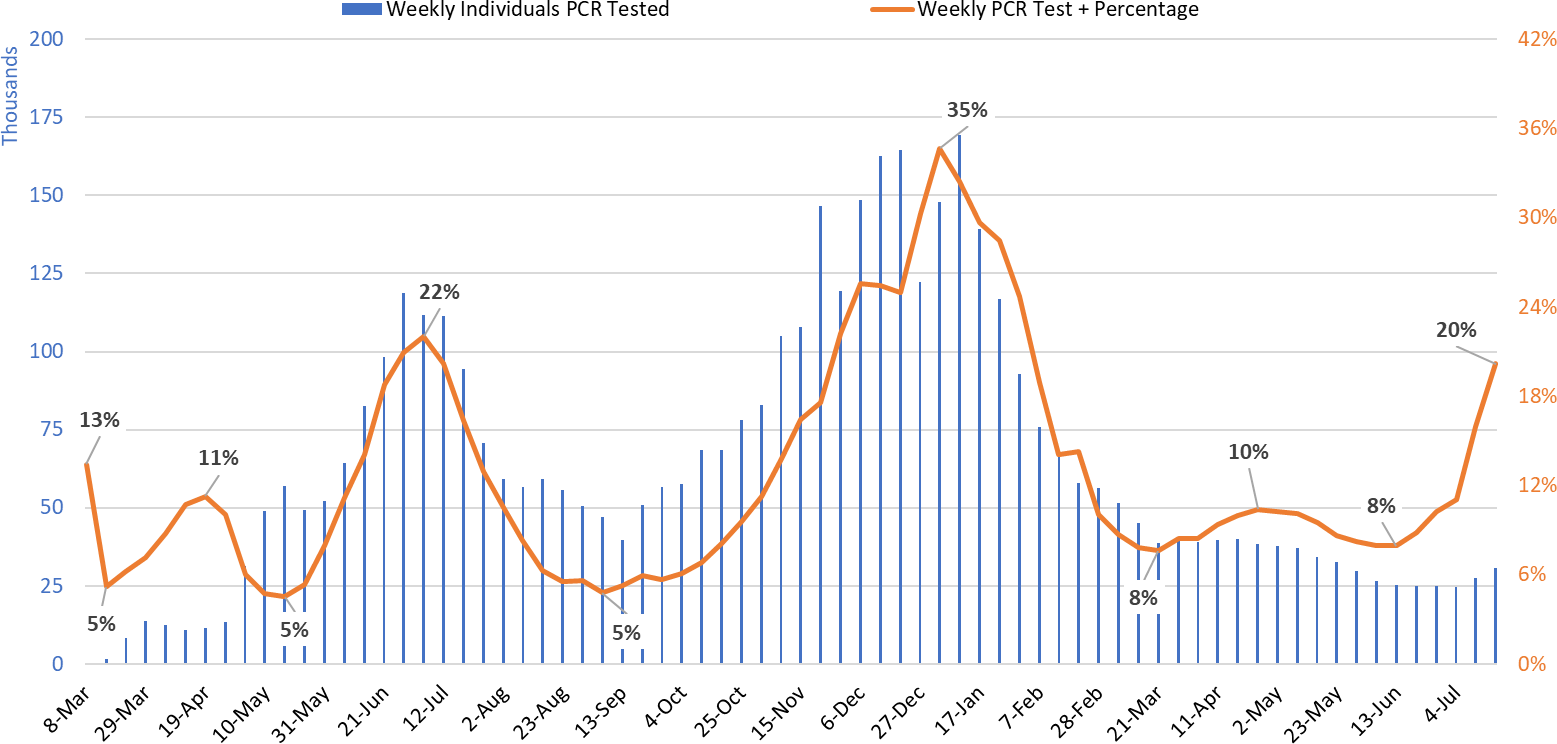
Test positivity among those undergoing traditional nasopharyngeal PCR testing rose to 20% this week, another meaningful week-to-week increase (Figure 3). This level indicates testing is inadequate for optimal public health practice and means many cases are likely going undiagnosed.
|
Figure 3. Weekly Number Patients Undergoing Traditional Nasopharyngeal PCR Testing and Associated Percent Positivity March 1, 2020 – July 18, 2021. |
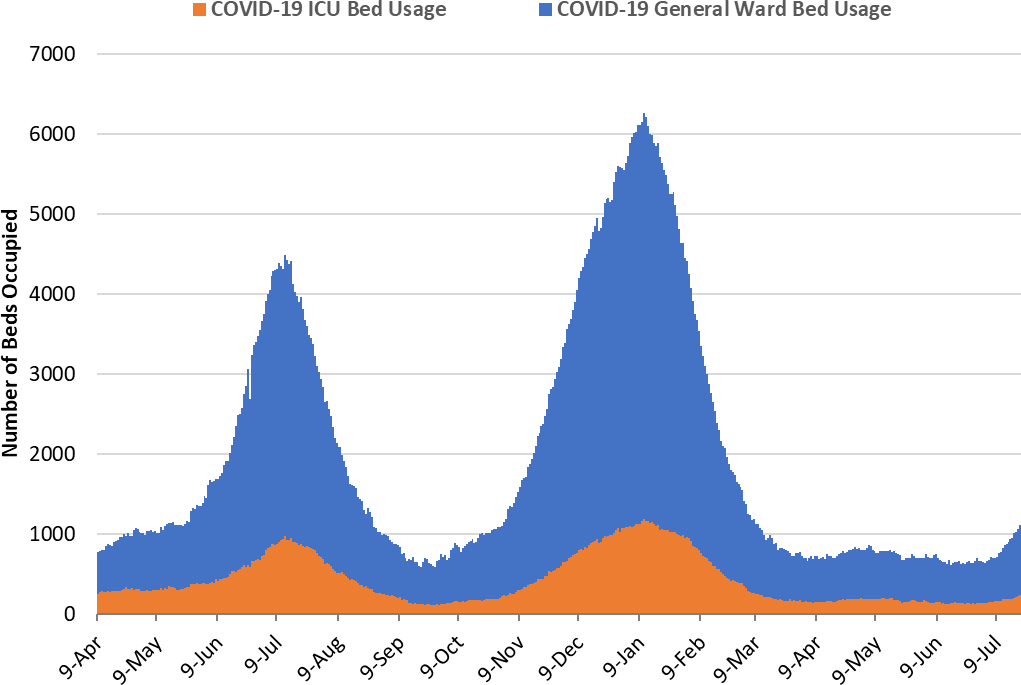
As of July 21st, 868 (11%) of Arizona’s 8675 general ward beds were occupied by Covid-19 patients, a 26% increase from the previous week’s 689 occupied beds (Figure 4 and Figure 5 Panel A). Another 861 (10%) beds remained available for use. The number of available beds is lower than the previous week’s 926 beds. The last time this many ward beds were occupied by COVID- 19 was March 10, 2021 (n=879).
|
Figure 4. Arizona Daily Covid-19 General Ward and ICU Census April 9, 2020 – July 21, 2021. |
As of July 21st, 217 (16%) of Arizona’s 1731 ICU beds were occupied with Covid-19 patients, an 18% increase from the prior week’s count of 184 patients (Figure 4 and Figure 5 Panel B). An additional 217 (13%) ICU beds remained available for use, about the same as last week’s 218 beds. The last time this many ICU beds was occupied by COVID-19 was March 13, 2021 (n=215).

|
Figure 5. Covid-19 Occupancy as a Percent of Listed General Ward (A, left) and ICU (B, right) Capacity in Arizona April 20, 2020 – July 21, 2021. |
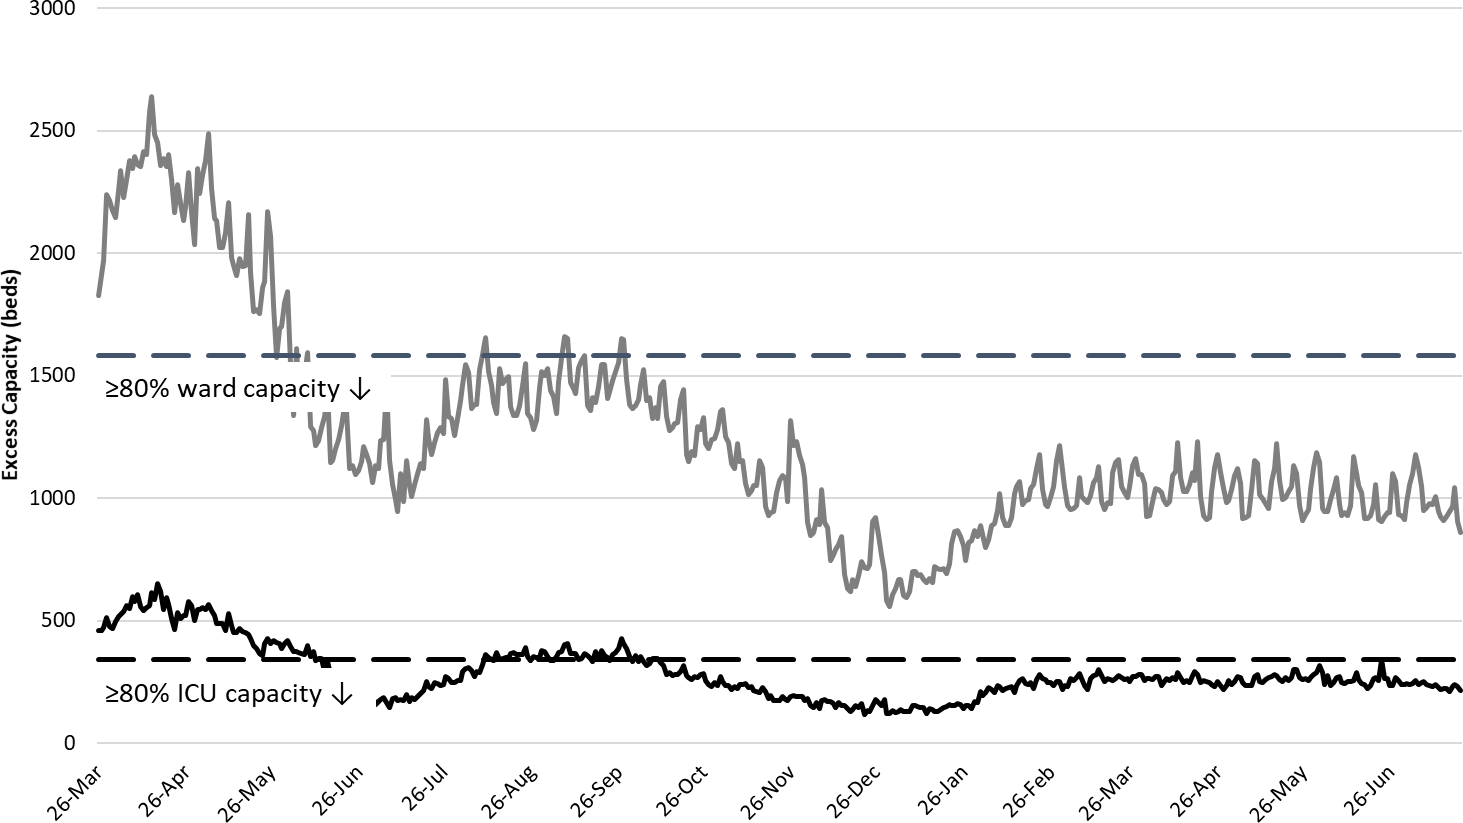
Arizona hospital occupancy remains above seasonal levels. Improvements in ward and ICU occupancy remain stalled at ≥85% occupancy (Figure 6). Undoubtedly, some medically necessary procedures that were previously postponed are still being rescheduled to address the backlog of care. Occupancy will need to fall 70-75% before conditions will be back to “normal.” However, hospitals should be prepared for >10% COVID-19 occupancy for the foreseeable future as viral transmission transitions from substantial to high levels.
|
Figure 6. Observed Excess Non-Surge General Ward and ICU Capacity March 26, 2020 – July 21, 2021. |
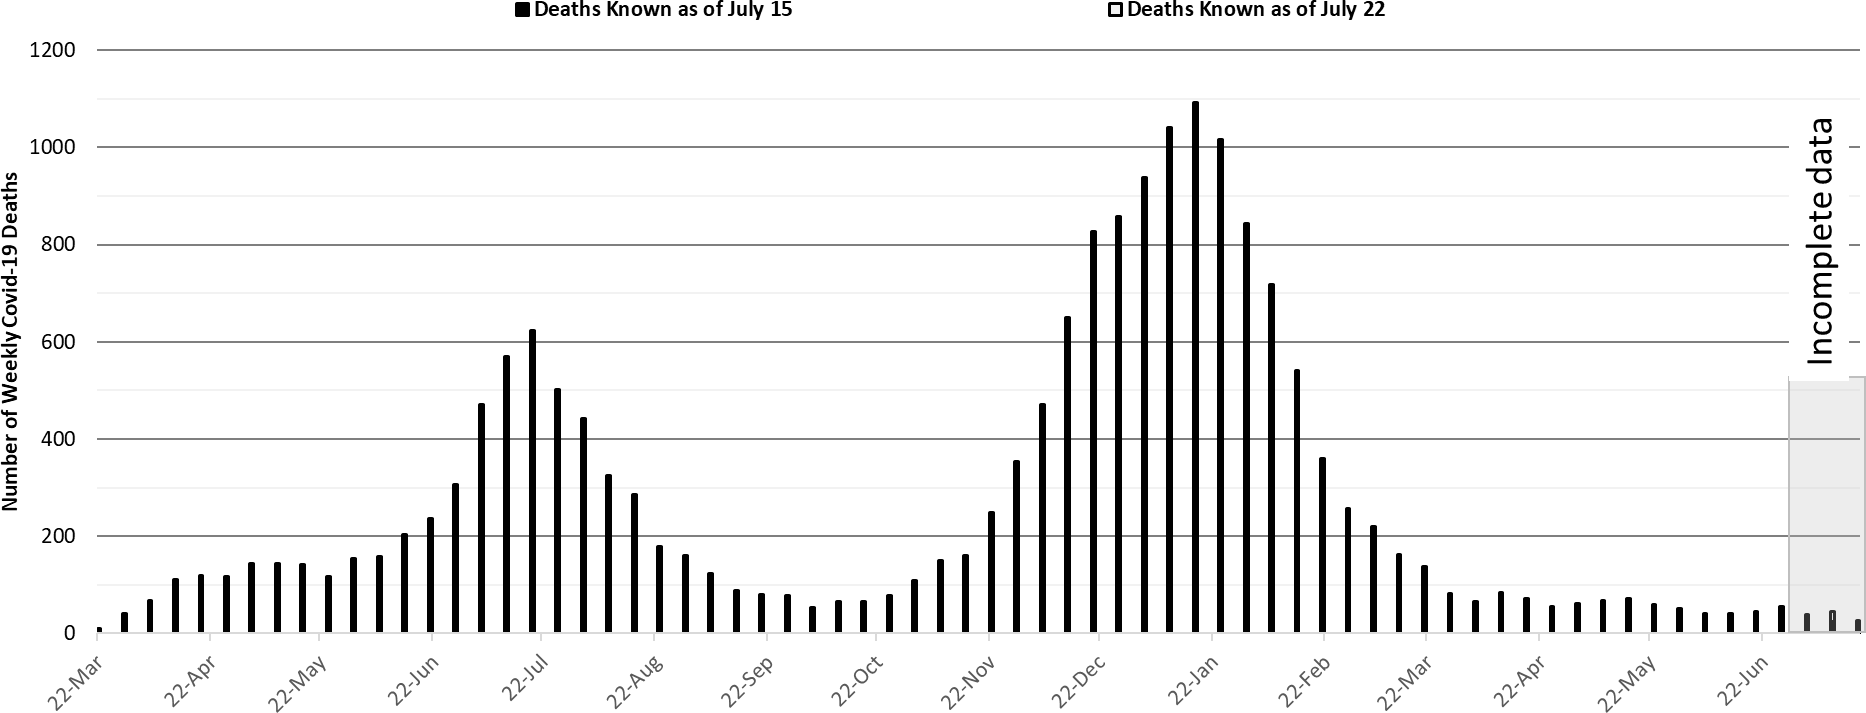
The week ending January 17, 2021 remains Arizona’s deadliest with 1093 deaths (Figure 7). The number of deaths will begin to rise in the coming weeks as increased case rates will ultimately translate into more deaths. The case fatality rate remains about 1.5% meaning that in 3 – 4 weeks Arizona could be seeing >100 deaths per week (e.g., 1.5% x 7836 = 118).
|
Figure 7. Weekly Arizona Covid-19 Deaths March 16, 2020 – July 18, 2021. |
Pima County Outlook
For the week ending July 4th, 577 Pima County residents were diagnosed with Covid-19 (Figure 8). This is a 36% increase from the 423 cases initially reported last week.
|
Figure 8. Covid-19 Cases and Individuals Undergoing Testing in Pima County Mar 1, 2020 – July 18, 2021 |
New cases are being diagnosed at a rate of 55 cases per 100K residents per week. This rate is increasing by 13 cases per 100K residents per week. Pima County’s rates remain lower than the state average. Trends across the various age groups appear in Figure 9.
|
Figure 9. Covid-19 Cases by Age Group in Pima County from March 14 – July 18, 2021. |
Summary
- This past week saw another marked increase in viral transmission. Arizona is now experiencing high levels of transmission that could be sustained for weeks to come. Unlike my previous assumption – roughly counterbalanced forces – it appears that total immunity is still insufficient to avert another surge in the presence of the more transmissible Delta variant.
- As of July 21st, new cases were being diagnosed at a rate of 108 cases per 100,000 residents per week. The rate is increasing at 27 cases per 100,000 residents per week.
- Another wave of cases and hospitalizations, most likely caused by the increasing prevalence of the Delta variant, seems almost certain. The Delta variant now accounts for about 75% of all cases.
- Vaccination remains the most important public health priority to reduce viral transmission and severe illness.
- With this marked acceleration in transmission, mandating masks in indoor spaces and limiting large gatherings is warranted to reduce transmission in public settings.
- Unfortunately, it seems unlikely that state policymakers will take action to protect public safety, either by allowing vaccination mandates (e.g., school attendance), indoor mask mandates (e.g., schools), or targeted business restrictions. Individual action alone is unlikely to stem the tide unless those most resistant to vaccination and mask-wearing voluntarily change their behaviors.
- Hospital COVID-19 occupancy is increasing in the ward and ICU. COVID-19 occupancy is likely to exceed 10% of all beds for at least several weeks, if not considerably longer. Access to care remains somewhat restricted as overall occupancy remains unseasonably high at 85%.
- Arizona Covid-19 fatality counts are now about 50 deaths per week but the number of deaths should increase over the coming weeks as case counts increase. The number of deaths could exceed 100 per week by the middle-to-end of August.
- According to the CDC, 55% of Arizona adults have received at least 2-doses of vaccine while another 9% have received 1-dose. Arizona passed peak vaccination rates in early April and these rates continue to erode.
- Despite evidence of limited immune escape to the Delta variant, especially before completion of the full vaccination sequence, vaccination continues to provide extraordinarily high levels of protection from infection and severe illness.
- With inadequate vaccination uptake, eliminating COVID-19 is no longer a plausible public health policy goal. COVID-19 is almost certain to become an endemic disease with varying temporal and geographic implications. Fortunately, vaccination will remain a viable disease control strategy offering a high degree of protection to those willing to accept them.
Forecast reports to date, available as PDFs
Download PDF to view additional charts of Arizona counties, available in appendix of report.
2020 Reports
Based on what we know now about this pandemic, we support guidelines for social distancing to slow the spread of the virus and urge everyone to follow the recommendations provided by the Centers for Disease Control and Prevention (CDC) to protect yourself, your family, your neighbors, and your employees. Please heed the recommendations as provided by the CDC.
COVID covid coronavirus virus covid19 corona forecast model