
COVID-19 Forecast Models Report for Arizona, November 27
Note this forecast page is not the most recent forecast available.
View the most current forecast report
Researcher Analyzes Arizona COVID-19 Spread Models for Decision-Makers
The following information regarding the spread of COVID-19 in Arizona was prepared by Joe Gerald, MD, PhD, a researcher at the Mel and Enid Zuckerman College of Public Health (MEZCOPH) at the University of Arizona. This information has also been reviewed by other MEZCOPH faculty.
This data were obtained from the Arizona Department of Health Services COVID-19 webpage and reflect conditions in Arizona as of November 27, 2020.
This information is intended to help guide our response to the outbreak. It is not intended to predict how this pandemic will evolve. Rather, this model extrapolates what might occur if current conditions remain unchanged. As regional authorities and healthcare providers respond, their actions are expected to mitigate the worst consequences of this pandemic.
COVID-19 Disease Outbreak Forecast
Arizona State and Pima County
Updated November 27, 2020
Disclaimer: This information represents my personal views and not those of The University of Arizona, the Zuckerman College of Public Health, or any other government entity. Any opinions, forecasts, or recommendations should be considered in conjunction with other corroborating and conflicting data. Updates can be accessed at https://publichealth.arizona.edu/news/2020/covid-19-forecast-model.
**NOTICE** Arizona is experiencing a public health crisis where access to critical care services is limited due to shortages of space, personnel, and critical supplies. If not addressed within the next 2 - 3 weeks, this crisis will evolve into a humanitarian crisis leading to hundreds of preventable deaths. At this point, only shelter-in-place restrictions are certain to quickly and sufficiently curtail viral transmission. Because such restrictions impose substantial economic hardships, these measures should be augmented by state expansion of programs to provide direct economic assistance, reduce food insecurity, prevent foreclosure and evictions, and protect access to health services.
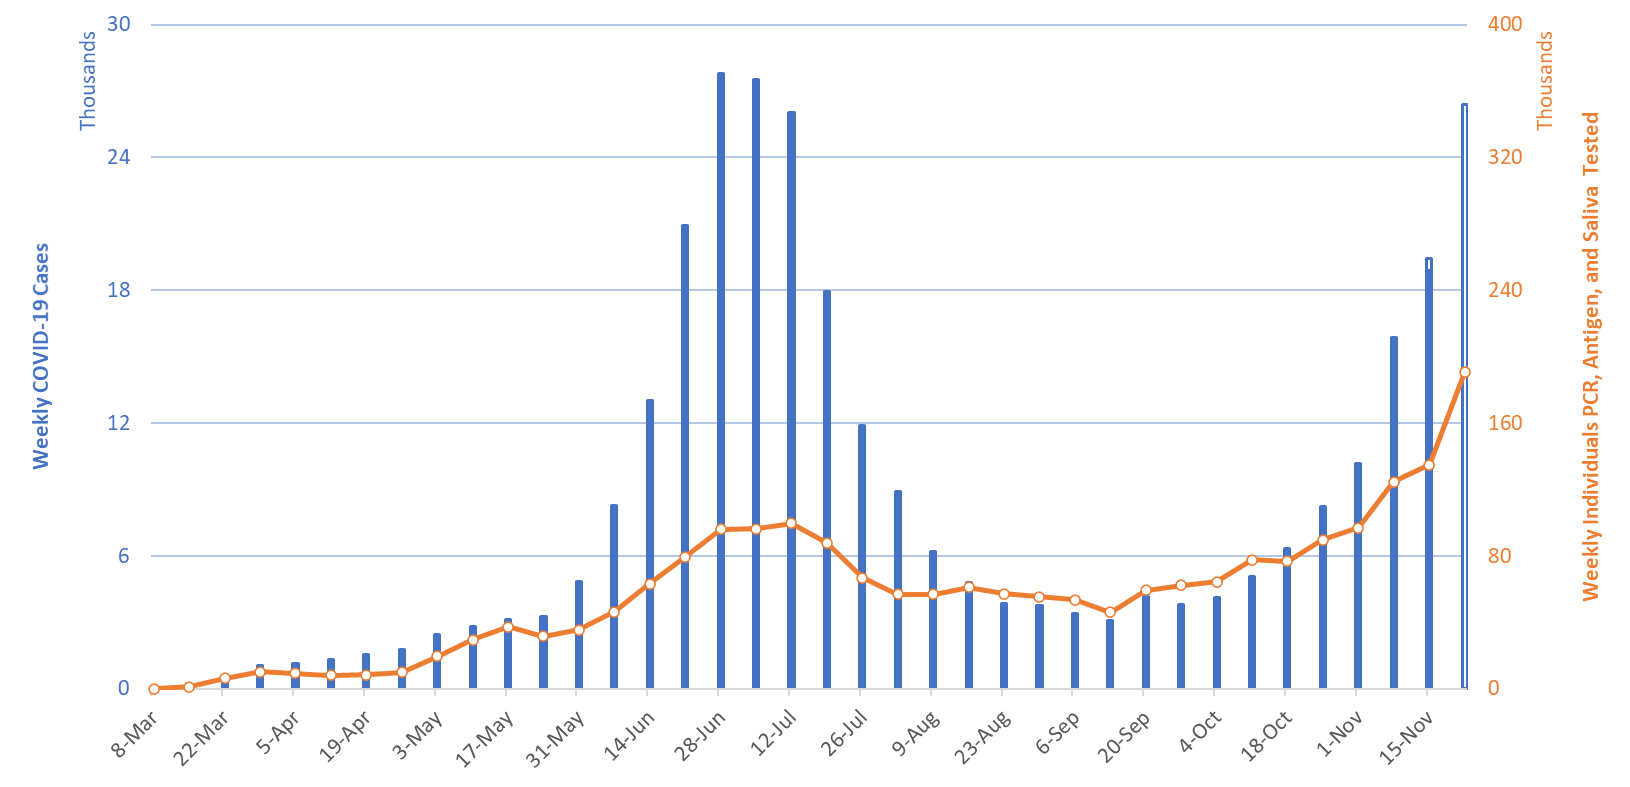
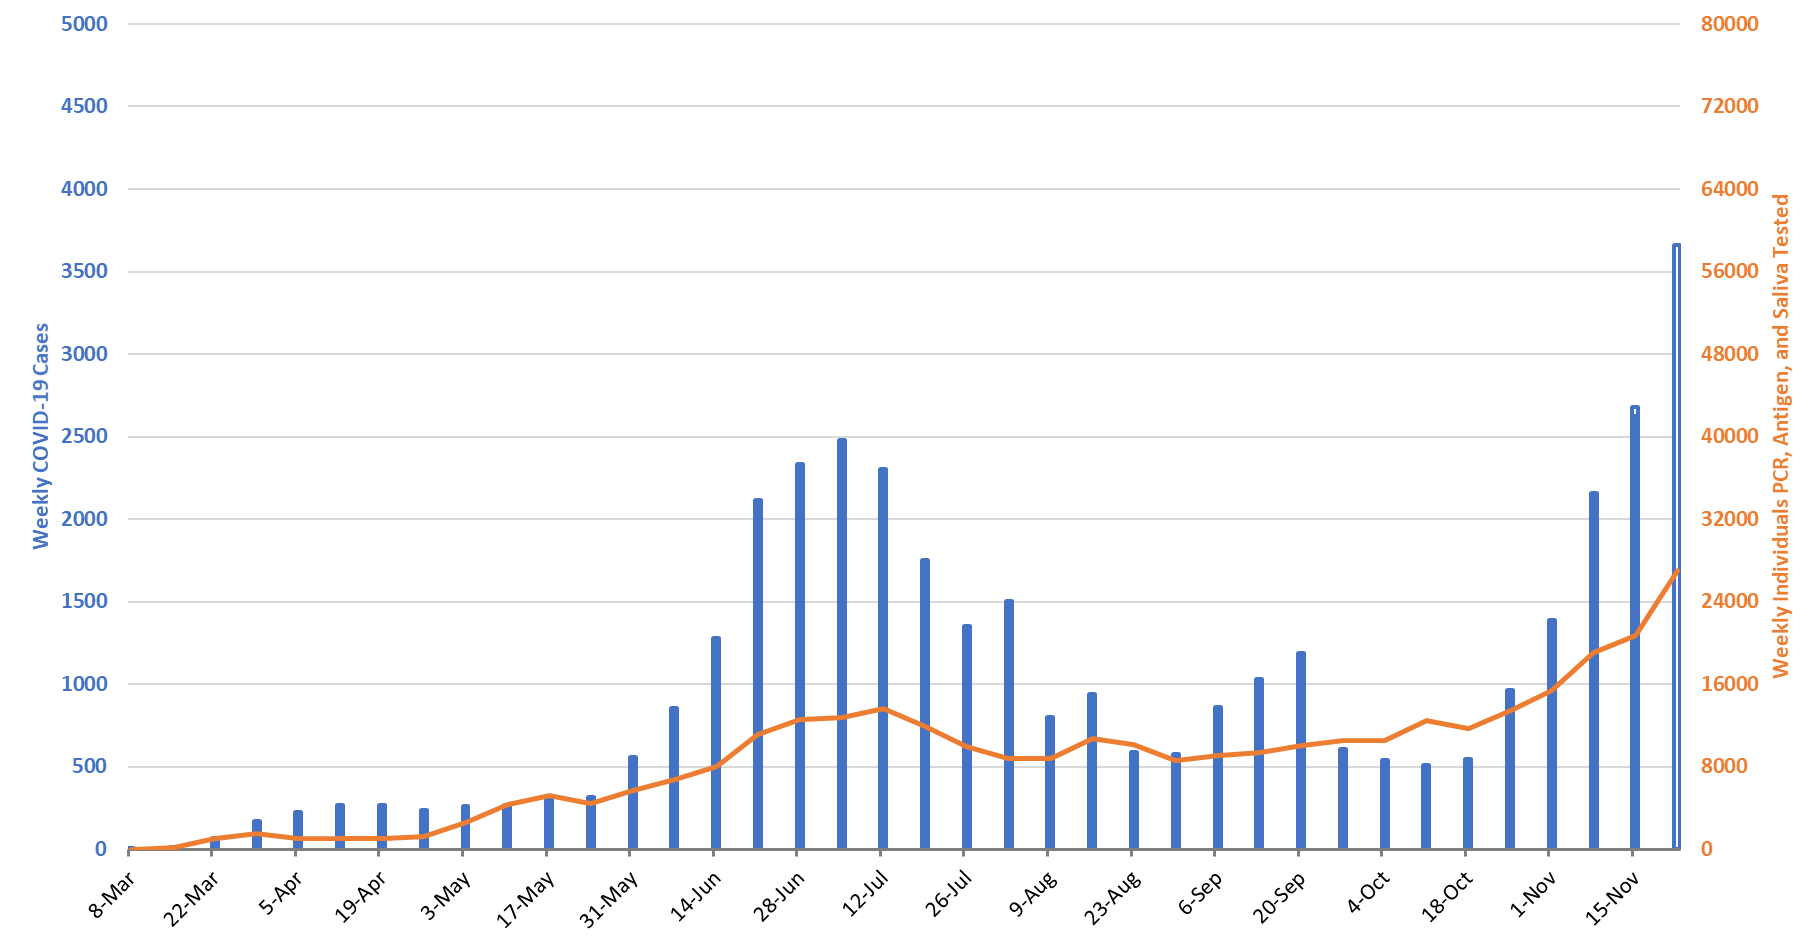
For the week ending November 12nd, at least 26406 new Covid-19 cases were diagnosed in Arizona (Figure 1). This is a 40% increase from last week’s initial tally of 18884 cases. Last week’s tally was upwardly revised this week by 564 cases, a 3% increase. Assuming similar amounts of backfill, this week’s tally is likely to rise in the coming weeks by an additional one thousand cases.
|
Figure 1. Newly Diagnosed Covid-19 Cases in Arizona and Number of Individuals Undergoing Covid-19 Diagnostic Testing March 1 through November 22. |
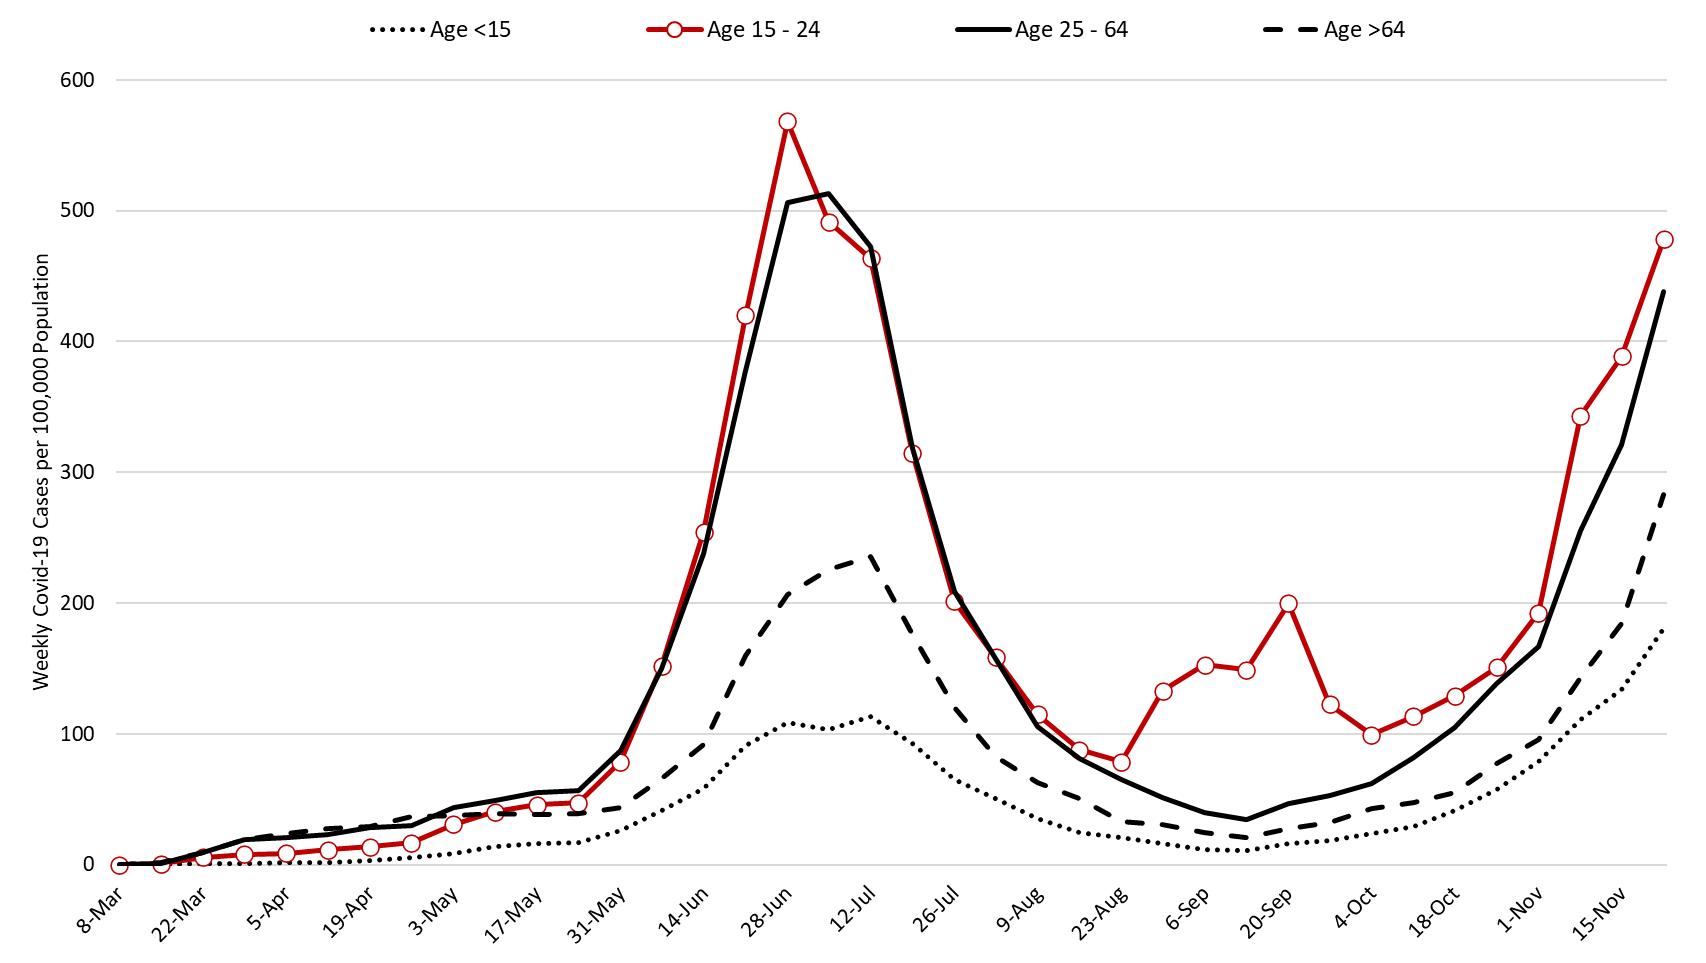
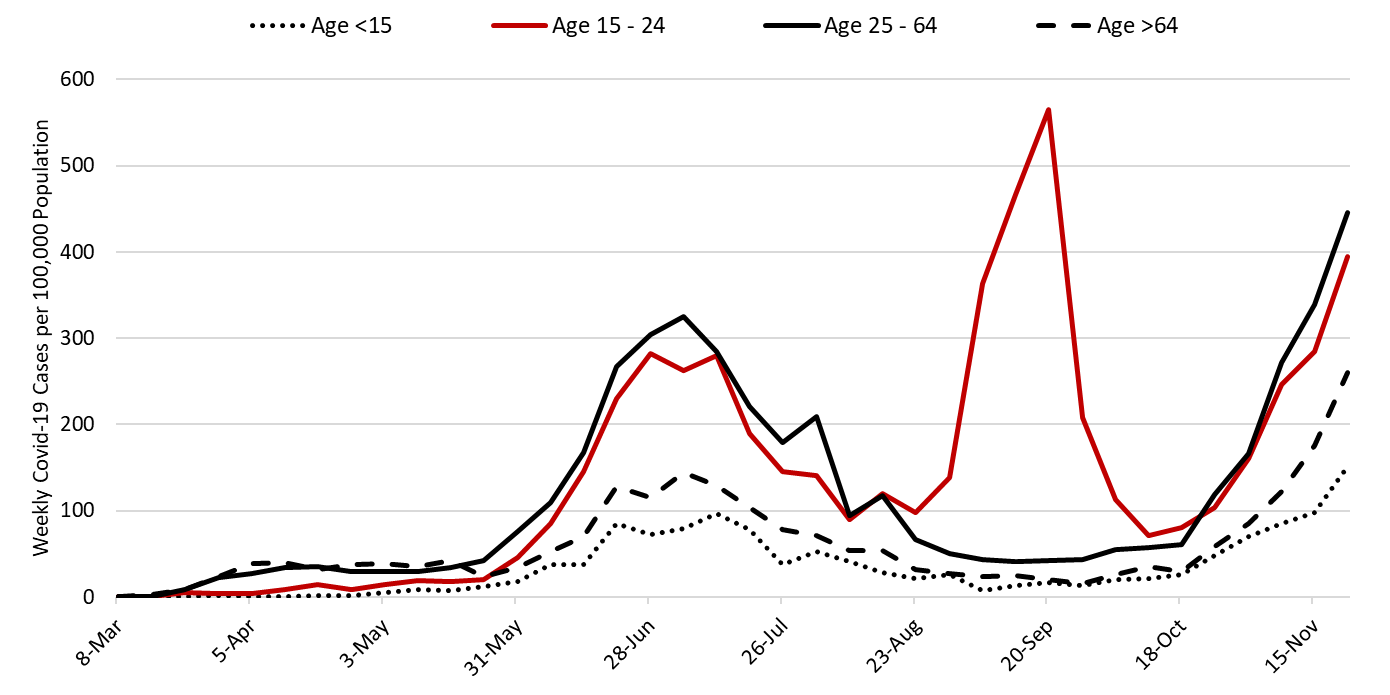
Arizona likely surpassed the 30,000 cases per week (4,000 per day) threshold this week. This outbreak continues to be broadly entrenched with rapid increases among all age groups including those over 65 years of age (Figure 2).
Note: Data for this report was updated mid-morning Friday, November 27 allowing 4 full working days to adjudicate weekend cases. This should reduce week-over-week backfill to 10% allowing more interpretable comparisons and graphics. All comparisons are week-over-week changes. Given the lengthy reporting delays, future updates will continue to be released on weekends.
|
Figure 2. Newly Diagnosed Covid-19 Cases in Arizona by Age Group March 1 through November 22. |
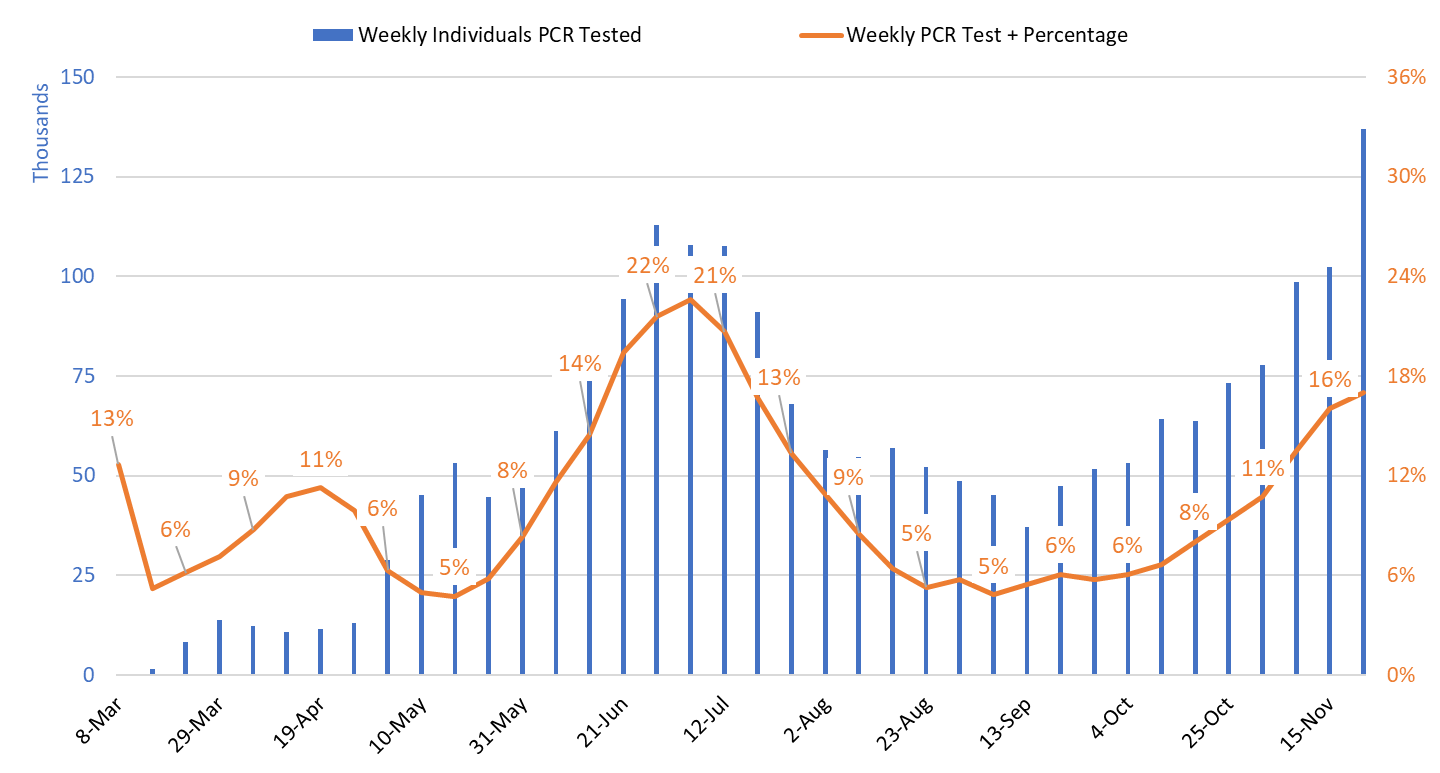
Test positivity among those undergoing traditional PCR testing continues to increase, reaching 17.0% this past week (Figure 3). Increasing test positivity provides additional evidence that viral transmission continues to increase despite the uncertainty surrounding actual case counts. Test positivity for antigen tests being conducted by the University of Arizona and by some long-term care facilities and retail clinics was 14.4% this week. Test positivity for saliva testing being conducted by Arizona State University for students and other groups was 8.3% this week.
|
Figure 3. Weekly Number Patients PCR Tested and Percent with Positive Test March 1 – November 22. |
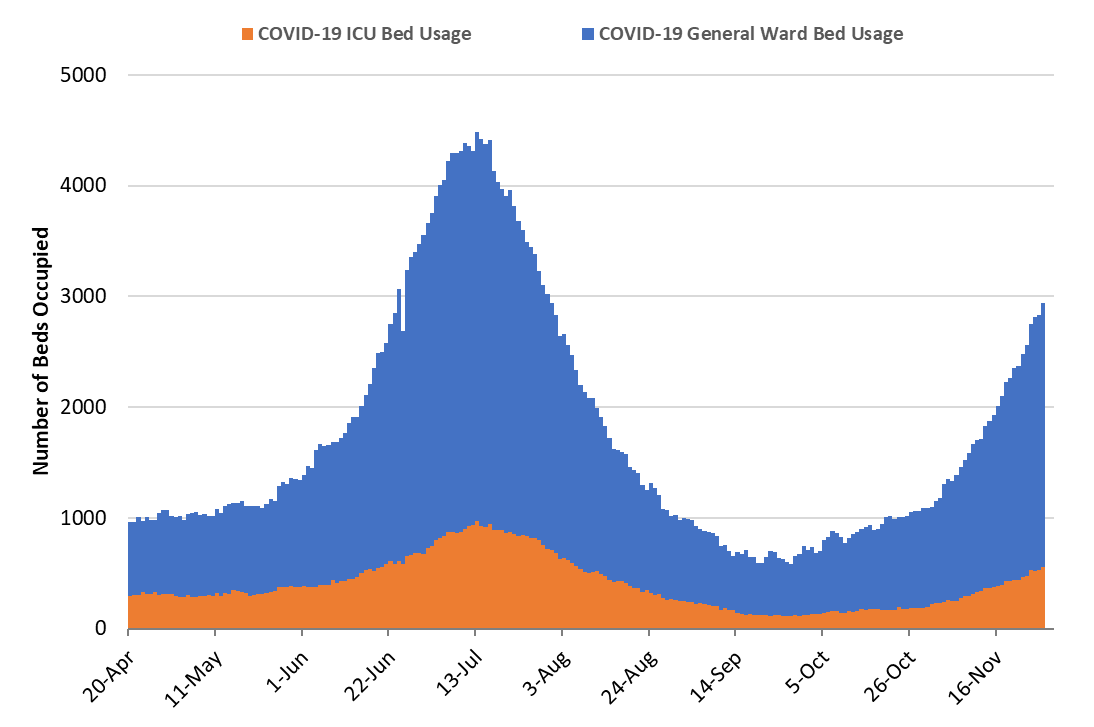
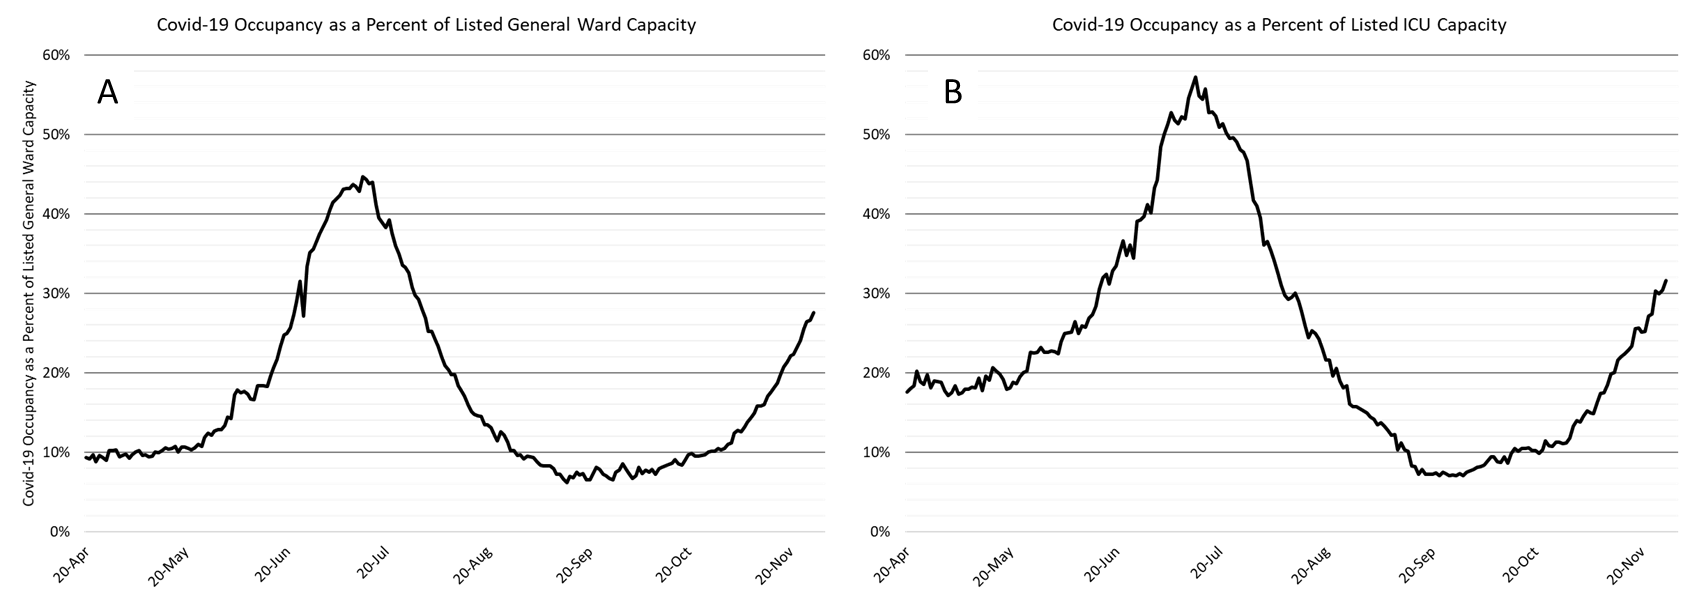
As of November 27th, 2383 (28%) of Arizona’s 8651 general ward beds were occupied by Covid-19 patients, a 24% increase from last week’s 1916 occupied beds (Figure 4 and Figure 5 Panel A). Another 1213 (14%) beds were available for use. This is higher than the 944 beds available last week owing to fewer scheduled admissions over the holiday week.
|
Figure 4. Arizona Daily Covid-19 General Ward and ICU Census April 20 – November 27. |
As of November 27th, 553 (32%) of Arizona’s 1751 ICU beds were occupied with Covid-19 patients, a 27% increase from last week’s count of 435 patients (Figure 4 and Figure 5 Panel B). An additional 196 (11%) ICU beds remain available. This is higher than last week’s 174 beds.
|
Figure 5. Covid-19 Occupancy as a Percent of Listed General Ward (A, left) and ICU (B, right) Capacity in Arizona April 20 – November 27. |
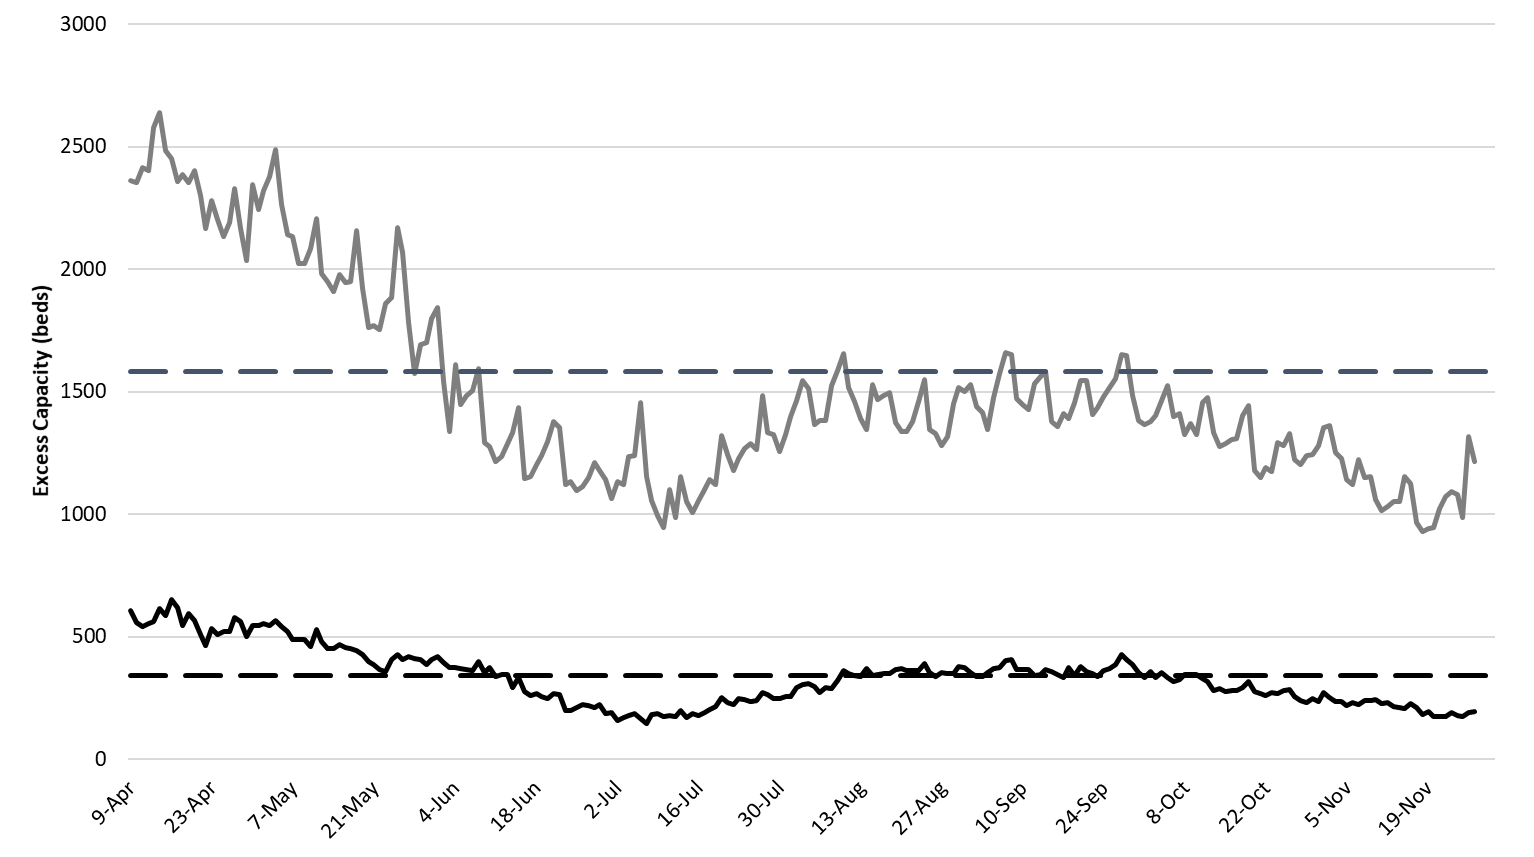
Arizona hospitals’ safety margin continues to erode in both the ward and ICU (Figure 6). Hospital occupancy is high not only because of Covid-19 admissions but also because hospitals continue to perform scheduled procedures and because of higher occupancy this time of year due to wintering part-time residents and viral respiratory season.
While occupancy data suggest Arizona hospitals should be under greater strain, the fact that admissions are dispersed across multiple units, not just Covid-specific units, means the workload is more evenly distributed across physicians, nurses and other health professionals. As Covid-19 admissions continue to increase, this advantage will be lost.
|
Figure 6. Observed Excess Non-Surge General Ward and ICU Capacity April 20 – November 27. |
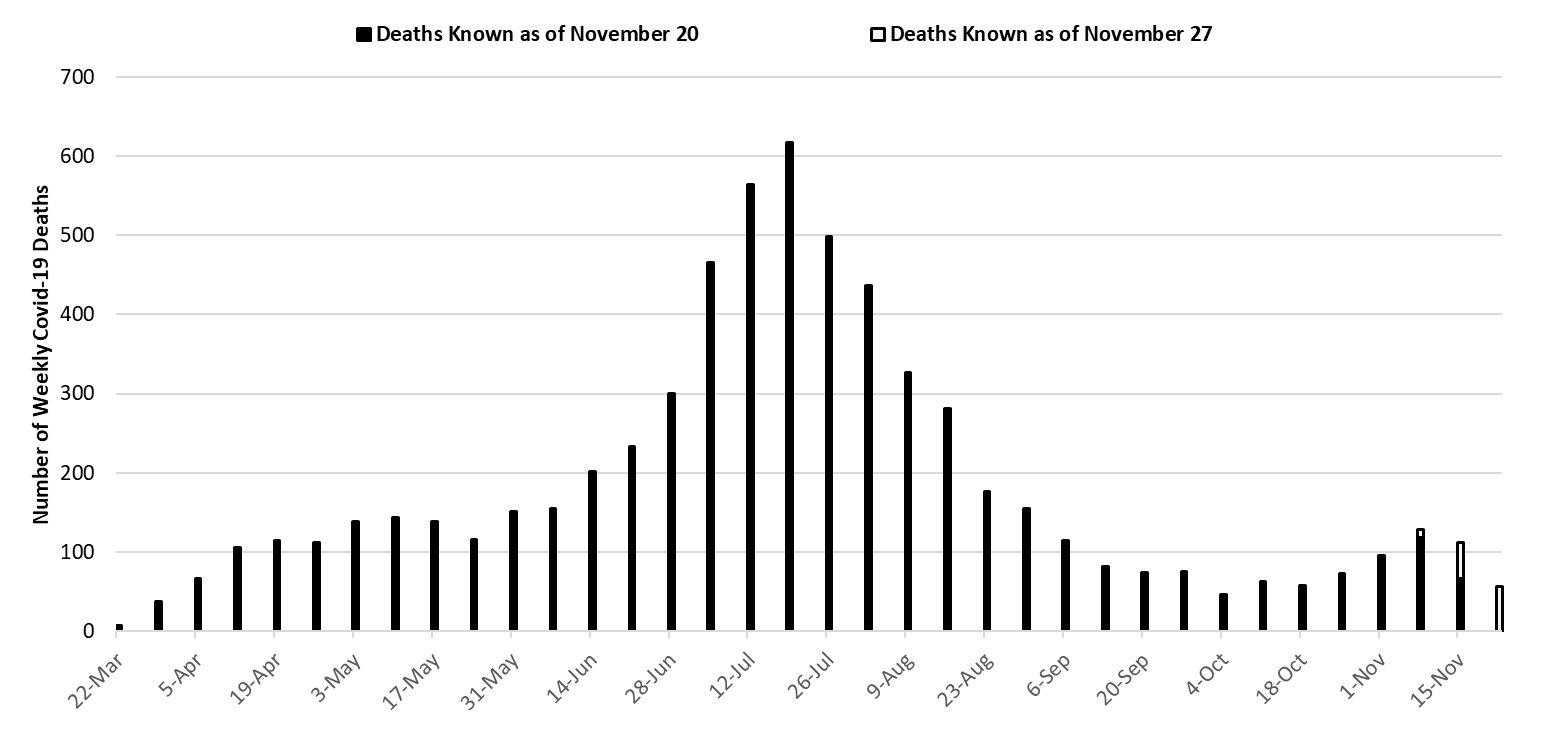
With 617 deaths, the week ending July 19th remains Arizona’s deadliest week (Figure 7). Weekly Covid-19 mortality reached a nadir of 46 deaths the week ending October 4th. Because cases have been increasing, deaths are now trending up and are near those last observed in May.
|
Figure 7. Weekly Known Arizona Covid-19 Deaths March 1 – November 22. |
Pima County Outlook
For the week ending November 22nd, 3660 Pima County residents were diagnosed with Covid-19 (Figure 8). This represents a 39% increase from the 2624 initially reported last week. This tally once again sets a new record for cases observed in a single week. Test reporting remains relatively timely and case reporting delays only caused last week’s initial tally of 2041 cases to be upwardly revised by 2% (56 cases) this week.
|
Figure 8. Covid-19 Cases and Individuals Undergoing Diagnostic Testing in Pima County Mar 1 – Nov 22. |
Increases in viral transmission are occurring across all age groups (Figure 9).
|
Figure 9. Covid-19 Cases by Age Group in Pima County from August 9 – November 22. |
Updated Arizona State University Covid-19 Forecast
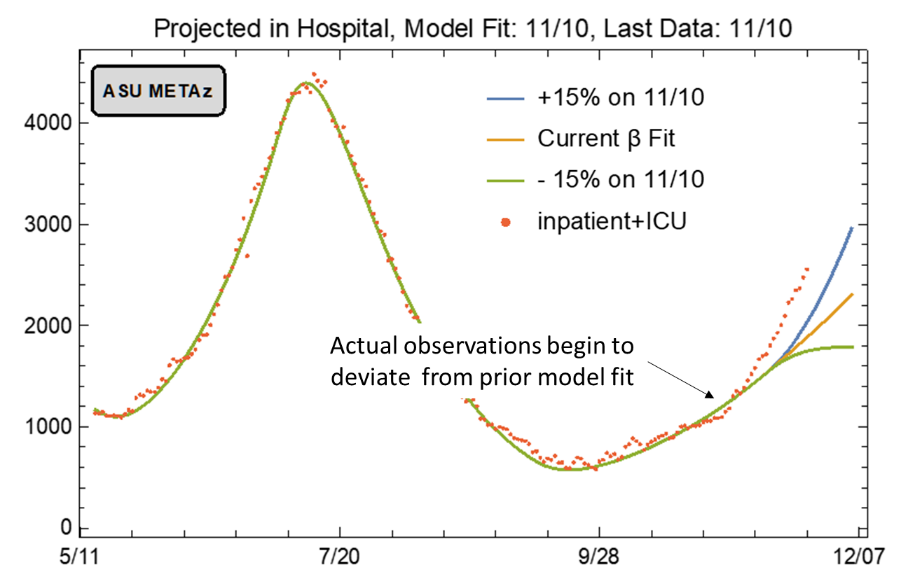
This week the ASU Covid-19 modeling group once again updated its winter projections of cases, hospitalizations, and deaths through mid-January (full report). This update was prompted by the recognition of a recent increase in the outbreak’s trajectory. The main findings are summarized below.
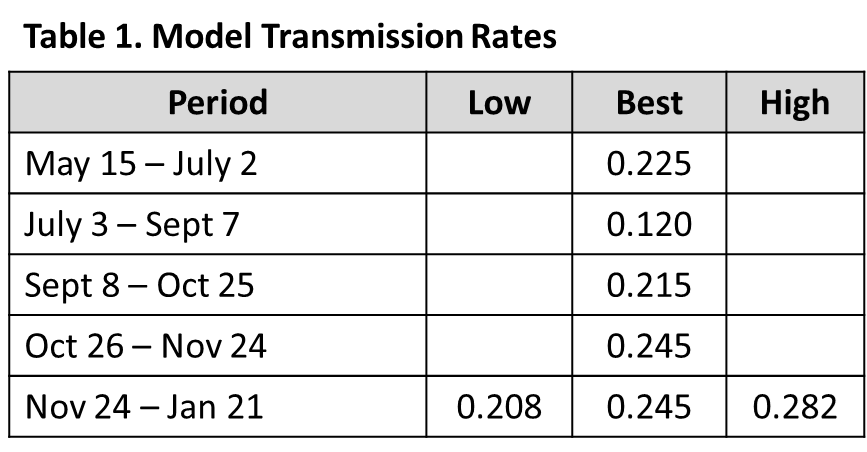
Their SEIR model (susceptible, exposed, infected, recovered) “tracks” hypothetical individuals through the course of the epidemic to generate Arizona-specific estimates of viral transmission rates. These rates are dependent on epidemiologic factors and the strength of mitigation activities such as face coverings, physical distancing, and business closures. Using observed Covid-19 deaths, the ASU groups can estimate transmission rates designated by the β term below (Table 1).
Using this method, they have now identified 4 distinct transmission periods: the post-opening surge from May to July, the post-face mask decline from July to September, the University led fall resurgence from September to present, and the election acceleration. During these 4 periods, the respective transmission rates that fit the observed number of deaths were 0.230, 0.120, 0.215, and 0.245 respectively. Importantly, this last β term is the fastest so far recorded in Arizona’s outbreak.
This new model assumes 3 scenarios: current transmission rates remain unabated (β = 0.245), transmission accelerates (β = 0.282), or transmission declines (β = 0.208). The team’s best fit assumes that transmission will continue unabated. The low and high assumptions reflect arbitrary deviances around their best-fit estimate.
|
Figure 10. ASU Covid-19 Modeling Group Estimate of Hospitalization in Maricopa County through January 21st (November 20 Update). |
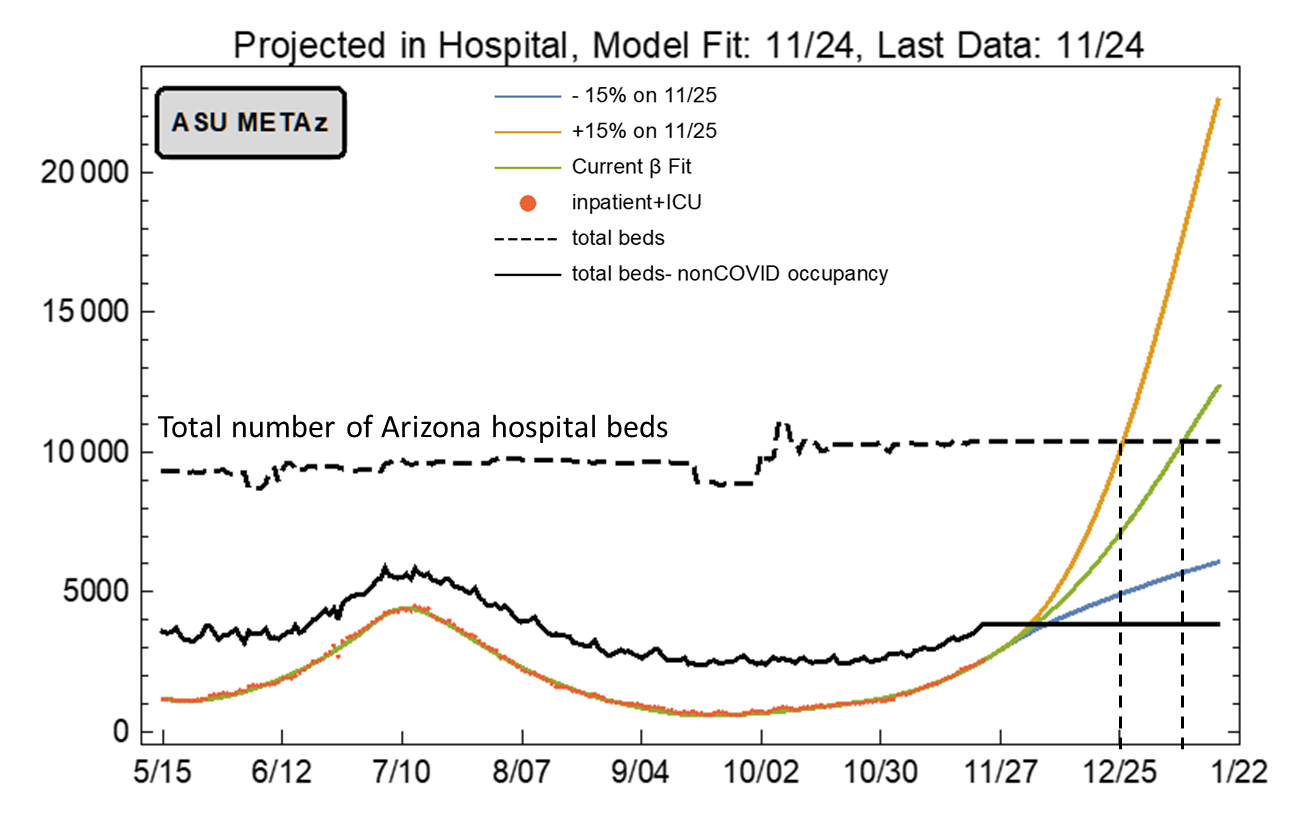
Assuming current viral transmission rates continue unabated, total Covid-19 hospitalizations in Arizona could exceed the total number of hospital beds by Christmas (Figure 11). This change does not reflect increases that might occur because of Thanksgiving travel and gatherings. If such increases occur, then total capacity could be exceeded even sooner.
If this were to happen, it would represent a humanitarian crisis of unparalleled proportion and would be accompanied by hundreds if not thousands of preventable deaths. In addition to degrading care for those with Covid-19, this crisis would also threaten to delay or prevent those with serious medical conditions from accessing care as well. Allowing a crisis of this magnitude to occur is unthinkable.
In this regard, Arizona should reinstate its shelter-in-place order for the post-Thanksgiving – Christmas period. While more targeted restrictions could have slowed transmission if implemented weeks ago, the potential consequences of an outbreak of this size and trajectory are too dire to rely on half-measures now. Of course, such restrictions will impose severe economic hardship on businesses and families at a time when state and federal governments are doing little to ameliorate them. Therefore, it is imperative that the state also expand its efforts to alleviate food insecurity, to prevent evictions and foreclosures, and to protect access to health services.
|
Figure 11. ASU Covid-19 Modeling Group Estimate of Total Covid-19 Hospitalization in Arizona through January 21st. Produced by Esma Gel, PhD, Megan Jehn, PhD, Anna Muldoon MPH, Health Ross, PhD, DNP, ANP-BC, and Tim Lant, PhD, MAS (November 24 Update). |
**A special thank you to the members of the ASU Covid-19 Modeling Group for their efforts to bring greater understanding of the current outbreak and for sharing their report. Readers are encouraged to read the full report which can be found here.
Summary
- Viral transmission is rapidly increasing throughout Arizona. If not slowed within the next 2 – 3 weeks, new Covid-19 cases will overwhelm our capacity to provide hospital care for Covid-19 and non-Covid patients by the end of December.
- New cases are currently being diagnosed at a rate of at least 356 cases per 100,000 residents per week. This rate is increasing by approximately 100 cases per 100,000 residents per week.
- Most counties are experiencing faster transmission than at any previous time. All counties have transmission rates 2X than the recommended level of 100 cases per 100,000 residents.
- The pace of transmission is now accelerating faster than previously forecasted. Holiday travel, commerce, and social gatherings between Thanksgiving and New Years are likely to further accelerate transmission rates.
- A state-wide shelter-in-place order is warranted to slow transmission and to prevent overwhelming our hospital system. A state-wide mask mandate is also needed. Individuals and business who do not comply with restrictions should face sanctions.
- If such action is taken, it must be accompanied by additional state funds to alleviate food insecurity, to prevent evictions and foreclosures, and to protect access to health services as the loss of economic support from the CARES Act is a likely contributor to increased transmission.
- Acknowledging that a shelter-in-place order is unlikely, counties should be granted additional authority to establish and enforce alternative Covid-19 mitigation policies.
- The only unacceptable course is inaction. Without intervention, we are on track to experience a major humanitarian crisis during the Christmas – New Year holiday season.
- All Arizona residents should wear a mask in public, avoid social gatherings, maintain physical distance from non-household contacts, avoid >15 minutes contact in indoor spaces, especially if physical distancing is inadequate and adherence to face masks is low.
- Hospital Covid-19 occupancy is increasing and is expected to exceed its previous peak by mid-December. It could overwhelm hospital capacity by late-December.
- The fall-winter viral respiratory season plus the return of part-time residents who winter in Arizona will continue to strain hospitals capacity through January.
- Hospitals are already postponing scheduled procedures and requiring health professionals to work additional hours and assume new duties. Shortages and burn-out will degrade our capacity to provide critical care services.
- The test positive rate for traditional PCR testing reached 17% this week. The growing mismatch between testing capacity and demand indicates viral transmission is growing faster than the estimate here.
- Covid-19 mortality continues to increase, but rates remain lower than those observed with this summer’s outbreak; however, cases are rising quickly among those >65 years of age which could change the mortality trajectory.
- Avoiding cases among those ≥65 years of age, particularly those residing in long-term care facilities, is critical to keeping mortality low.
Forecast reports to date, available as PDFs
Download PDF to view additional charts of Arizona counties, available in appendix of report.
Based on what we know now about this pandemic, we support guidelines for social distancing to slow the spread of the virus and urge everyone to follow the recommendations provided by the Centers for Disease Control and Prevention (CDC) to protect yourself, your family, your neighbors, and your employees. Please heed the recommendations as provided by the CDC, found at the following website: https://www.cdc.gov/coronavirus/2019-ncov/prepare/prevention.html
COVID covid coronavirus virus covid19 corona forecast model