
Weekly Arizona COVID-19 Data Report – December 10
Note this forecast page is not the most recent forecast available.
View the most current forecast report
Researcher Analyzes Arizona COVID-19 Spread Models for Decision-Makers
The following information regarding the spread of COVID-19 in Arizona was prepared by Joe Gerald, MD, PhD, a researcher at the Mel and Enid Zuckerman College of Public Health (MEZCOPH) at the University of Arizona. This information has also been reviewed by other MEZCOPH faculty.
This data were obtained from the Arizona Department of Health Services COVID-19 webpage and reflect conditions in Arizona as of December 10, 2021.
This information is intended to help guide our response to the outbreak. It is not intended to predict how this pandemic will evolve. Rather, this model extrapolates what might occur if current conditions remain unchanged. As regional authorities and healthcare providers respond, their actions are expected to mitigate the worst consequences of this pandemic.

COVID-19 Disease Outbreak Forecast
Arizona State and Pima County
Updated December 10, 2021
Disclaimer: This information represents my personal views and not those of The University of Arizona, the Zuckerman College of Public Health, or any other government entity. Any opinions, forecasts, or recommendations should be considered in conjunction with other corroborating and conflicting data. Updates can be accessed at https://publichealth.arizona.edu/news/2021/covid-19-forecast-model.
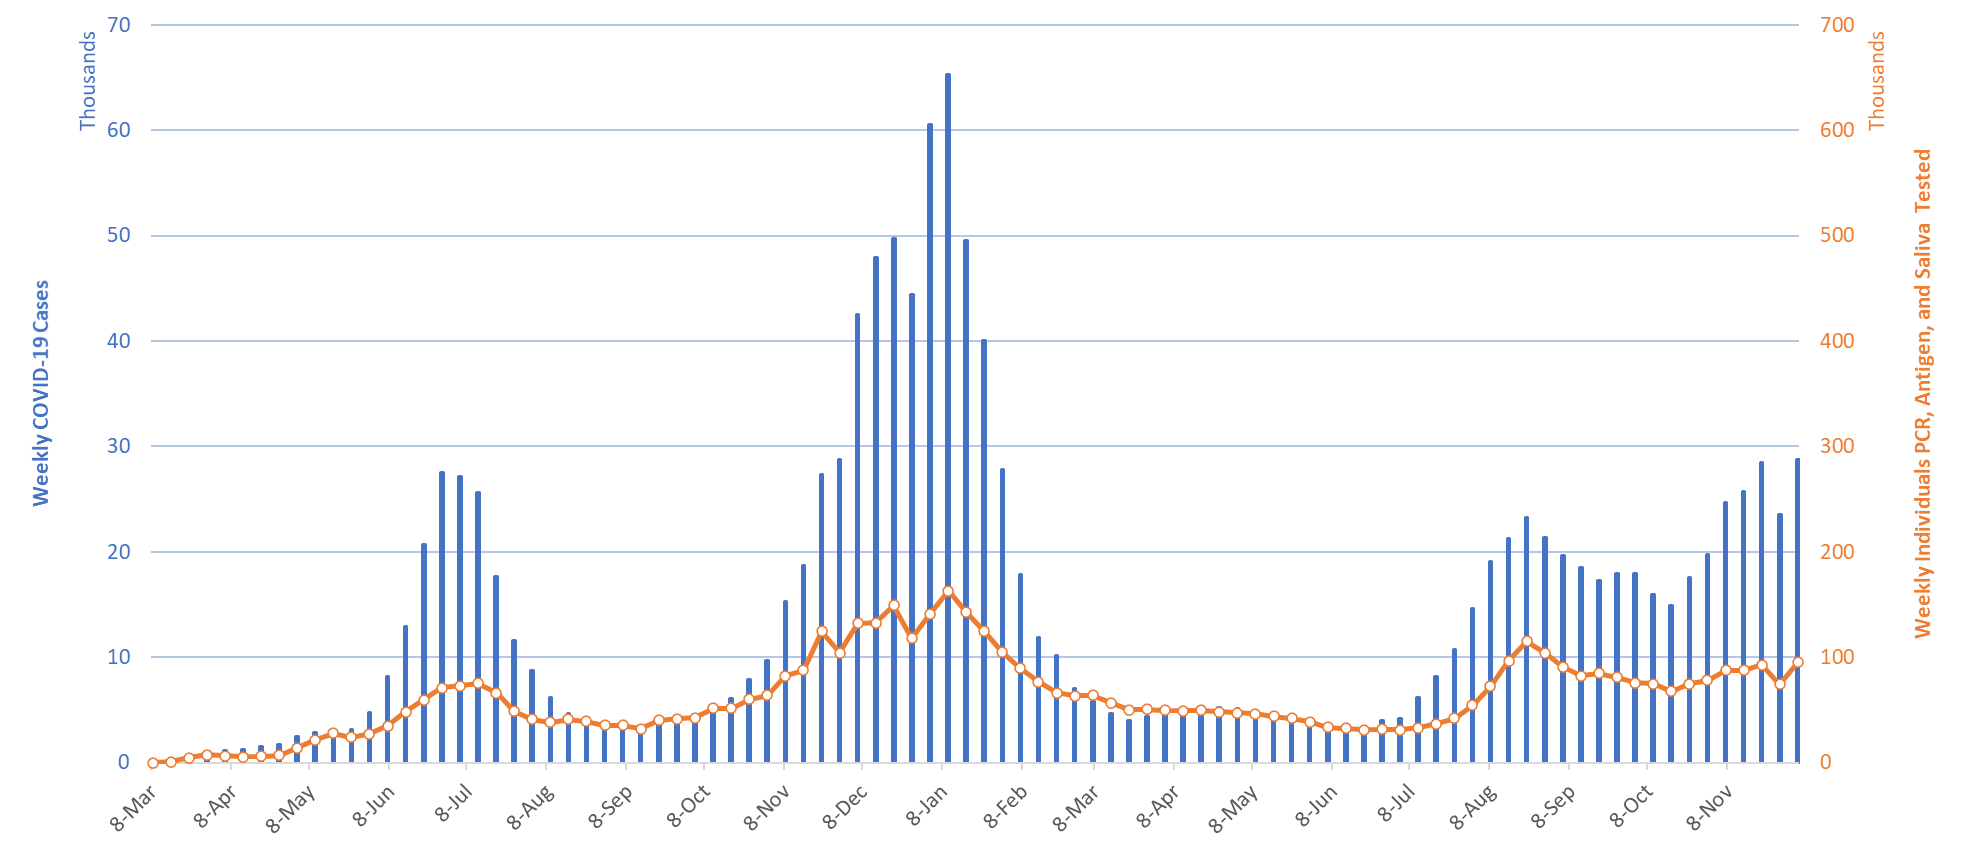
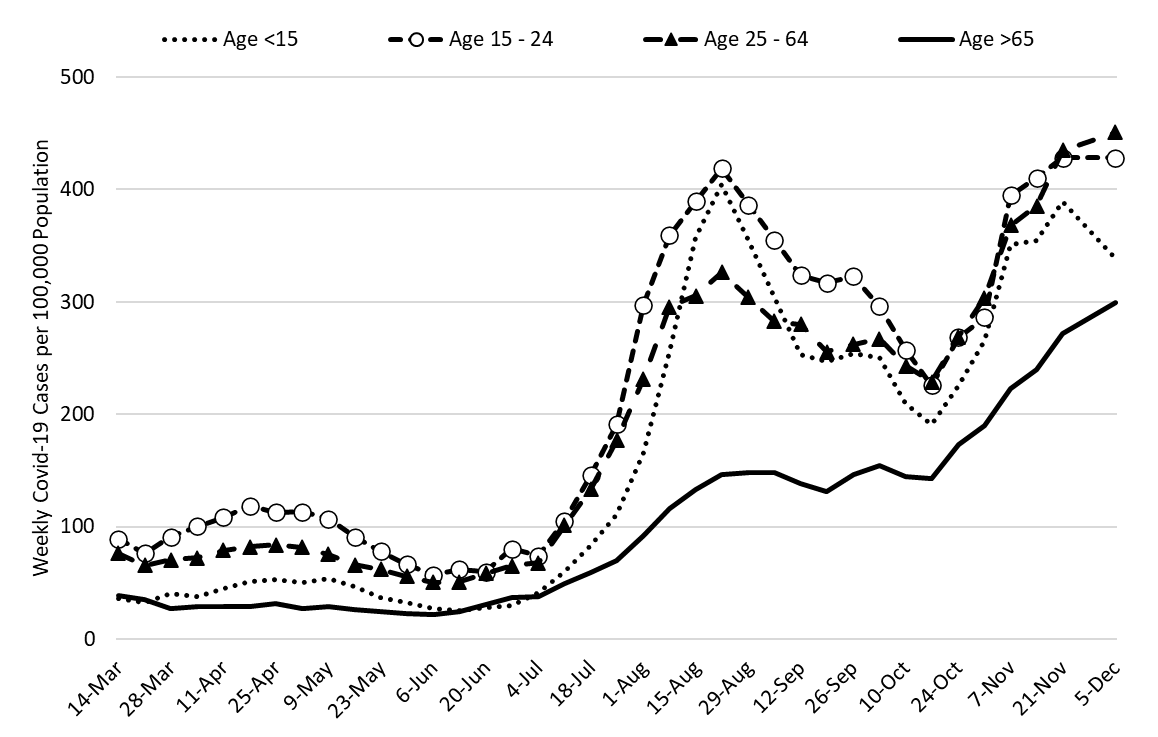
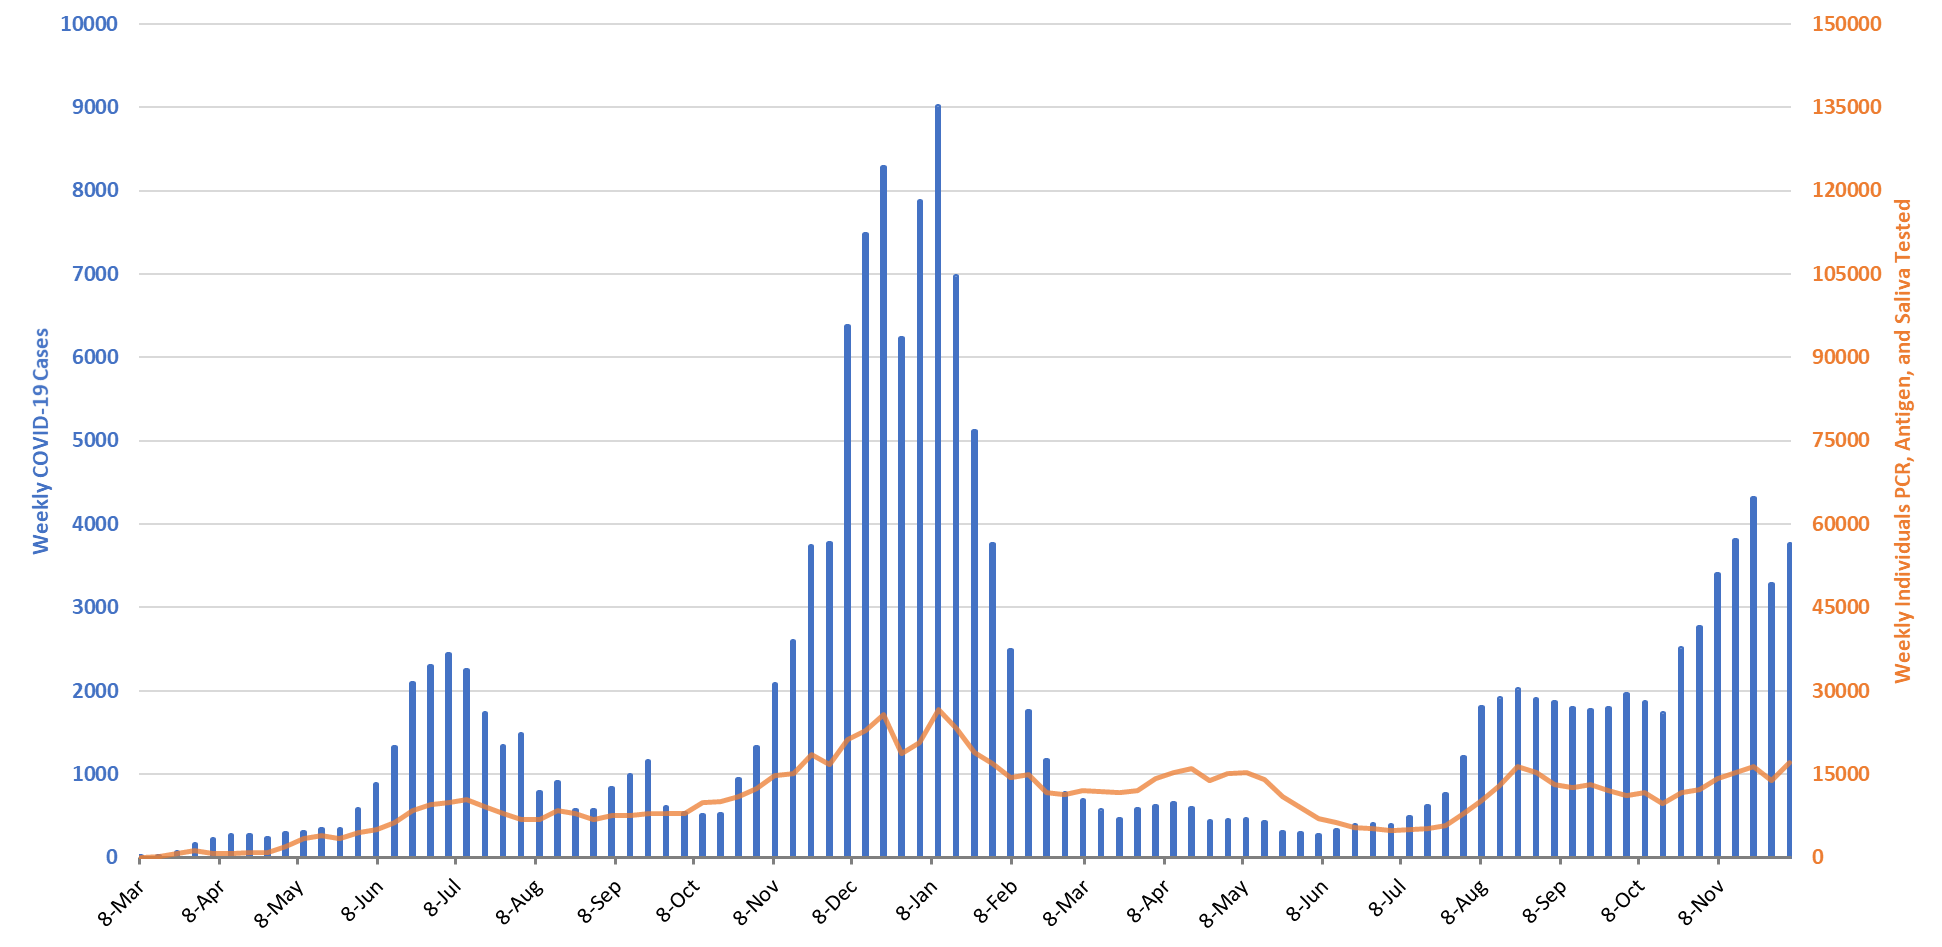
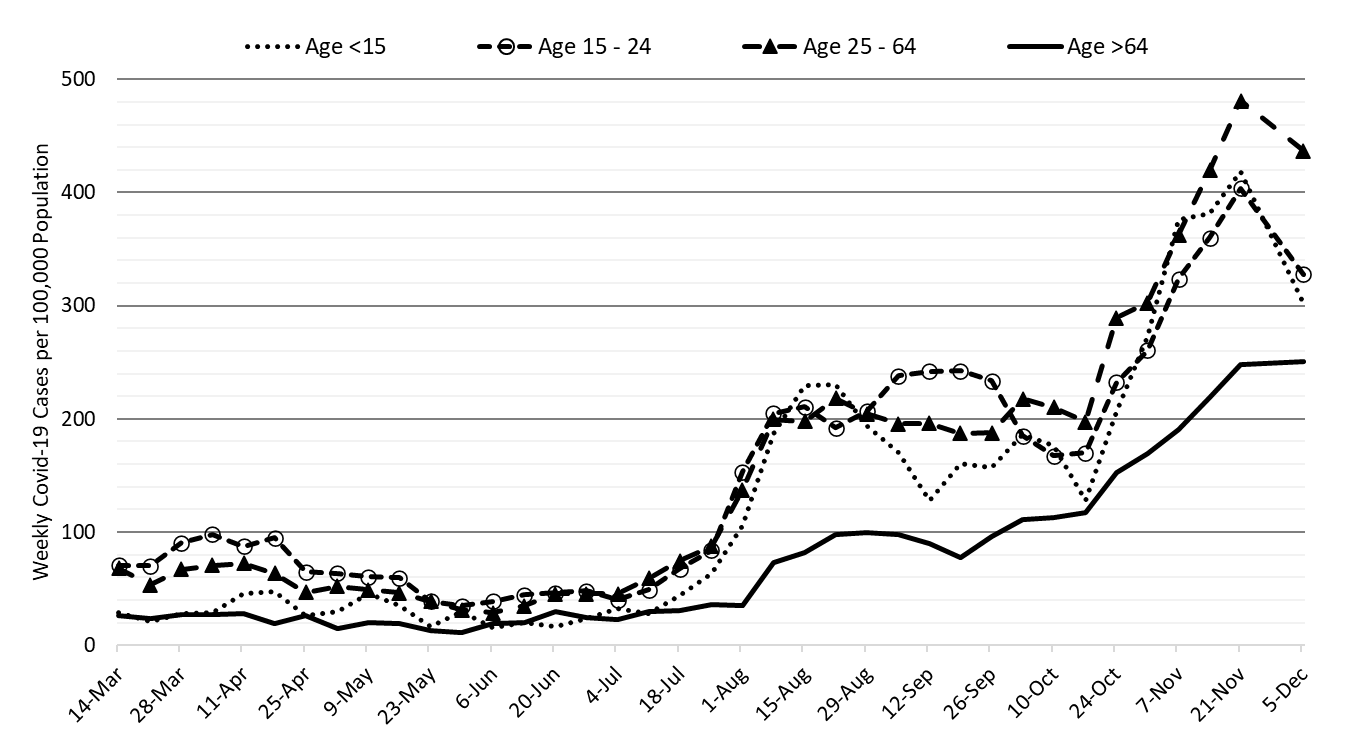
For the week ending December 5th, 28746 Arizonans were diagnosed with COVID-19, a 3% increase from the 27846 cases initially reported two weeks ago (Figure 1). Case counts were disrupted during Thanksgiving with fewer tests being conducted and transmission being underestimated. Cases are currently being diagnosed at a rate of 404 cases per 100K residents per week, the highest level since late January 2021. Rates are highest among those 25 – 64 years and lowest among those ≥65 years, 451 and 300 cases per 100K residents, respectively (Figure 2a below).
|
Figure 1. Weekly COVID-19 Cases in Arizona and Number of Individuals Undergoing COVID-19 Diagnostic Testing March 1, 2020 – December 5, 2021. |
Arizona’s new case ranking has risen from 22nd to 16th. The nation’s current leaders are New Hampshire (659), Michigan (589), Minnesota (577), Rhode Island (559), and New Mexico (507). According to the CDC, only 25% of Arizona adults and 45% of its seniors are vaccinated with a third dose booster. The ADHS Vaccine Dashboard shows weekly doses delivered rose to 200K doses after Thanksgiving continuing a generally increasing trend. The CDC recommends everyone ≥18 years should receive a booster and has widened eligibility to those 16 – 17 years. As winter approaches, waning immunity among those without a booster will place them at risk, particularly from the new Omicron variant.
STILL TRUE → Arizona continues to experience a high number of cases, hospitalizations, and deaths. With waning vaccine efficacy and a potentially short duration of acquired immunity, herd immunity is not achievable. As winter approaches, more individuals will become susceptible. While the previously vaccinated and previously infected will remain mostly protected from severe outcomes, they will contribute to community transmission. Unvaccinated Arizonans will not be able to avoid infection by “free riding” on high levels of community immunity. The decision to remain unvaccinated carries a much greater risk than getting vaccinated. For the vaccinated, third-shot boosters provide considerable additional protection and should be a priority for anyone >50 years to ward off infection from the predominant Delta variant or the newly emergent Omicron variant.
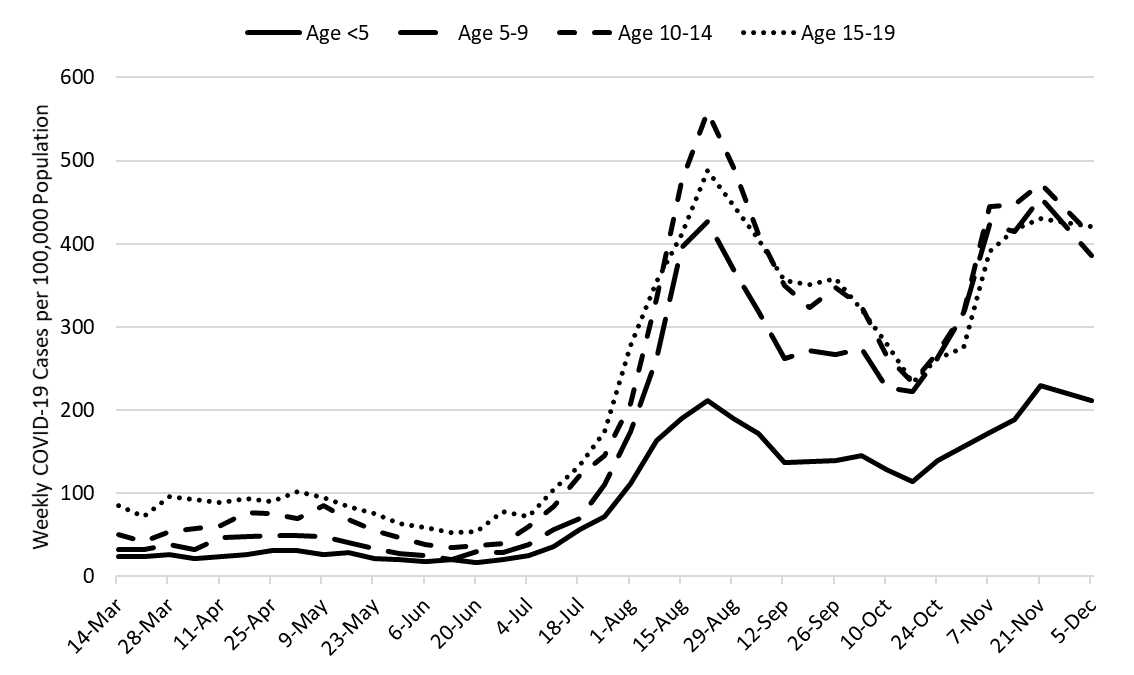
With data from Thanksgiving week suppressed, Figure 2a shows transmission among working-age adults and seniors continues to increase. However, transmission among children has generally declined over the past two weeks presumably because of holiday break and reduction of school exposures (Figure 2b). The Christmas – New Year holidays will continue to bring major changes to work and social life. For the next several weeks, hospital COVID-19 occupancy will give a more consistent, although lagged, indicator of what is happening with viral transmission in the community.
|
Figure 2a. COVID-19 Cases in Arizona by Age Group March 7 – December 5, 2021. (Data from week ending November 28 suppressed) |
|
Figure 2b. COVID-19 Cases in Arizona among Children by Age Group March 7 – December 5, 2021. (Data from week ending November 28 suppressed) |
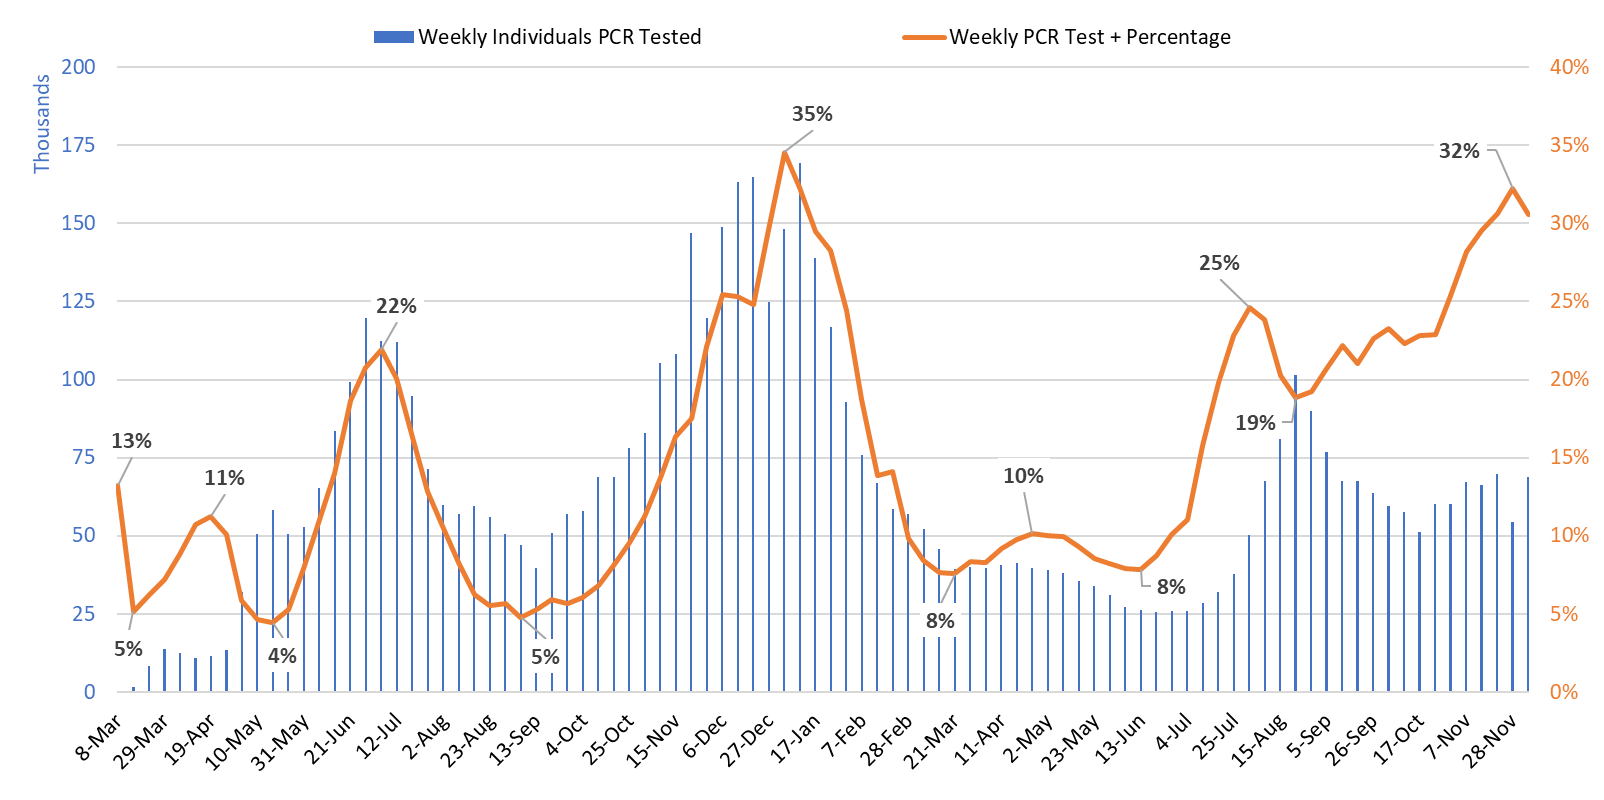
Test positivity, at 31%, has at least momentarily plateaued. However, last week’s 32% may be artificially peaked owing to a much smaller testing base during Thanksgiving. Testing remains inadequate for public health practice and many cases are going undiagnosed (Figure 3).
|
Figure 3. Weekly Number of Patients Undergoing Traditional Nasopharyngeal PCR Testing and Associated Percent Positivity March 1, 2020 – December 5, 2021. |
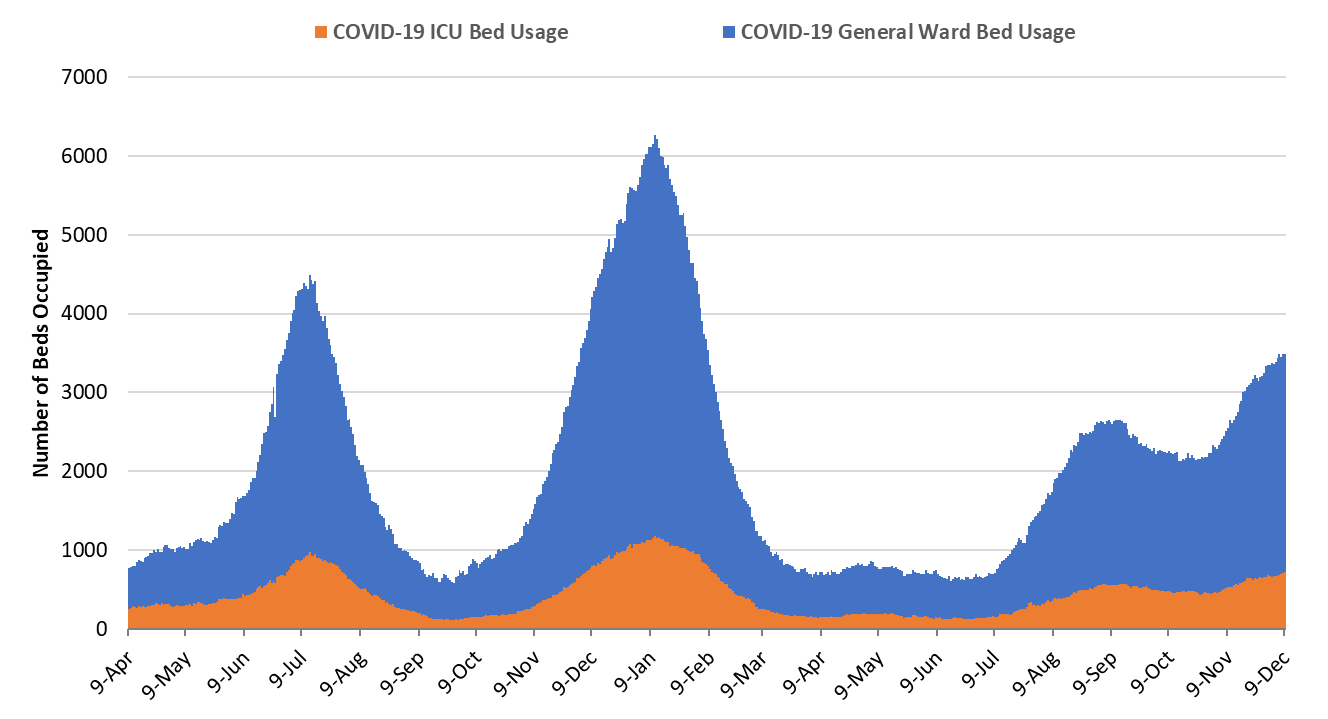
As of December 9th, 2770 (31%) of Arizona’s 8812 general ward beds were occupied by COVID-19 patients, a 2% increase from last week’s 2714 occupied beds (Figure 4 and Figure 5 Panel A). Another 447 (5%) beds remained available for use. Another all-time low for ward availability was set this week at 392 available beds. Seven-hundred fifteen (715, 40%) of Arizona’s 1770 ICU beds were occupied by COVID-19 patients, a 9% increase from last week’s 656 occupied beds (Figure 4 and Figure 5 Panel B). An additional 86 (5%) ICU beds remained available for use. Another all-time low for ICU availability was set this week at 78 beds.
|
Figure 4. Arizona Daily COVID-19 General Ward and ICU Census April 9, 2020 – December 9, 2021. |
While peak occupancy is unlikely to reach prior levels, the base of the Delta wave is broader. The Delta wave has seen 119 days with a combined occupancy >2000 patients whereas the summer 2020 and winter 2021 waves saw 57 and 98 days, respectively. We have now had >3000 combined occupancy for 23 days whereas the summer 2020 and winter 2021 waves saw 35 and 78 days, respectively.
|
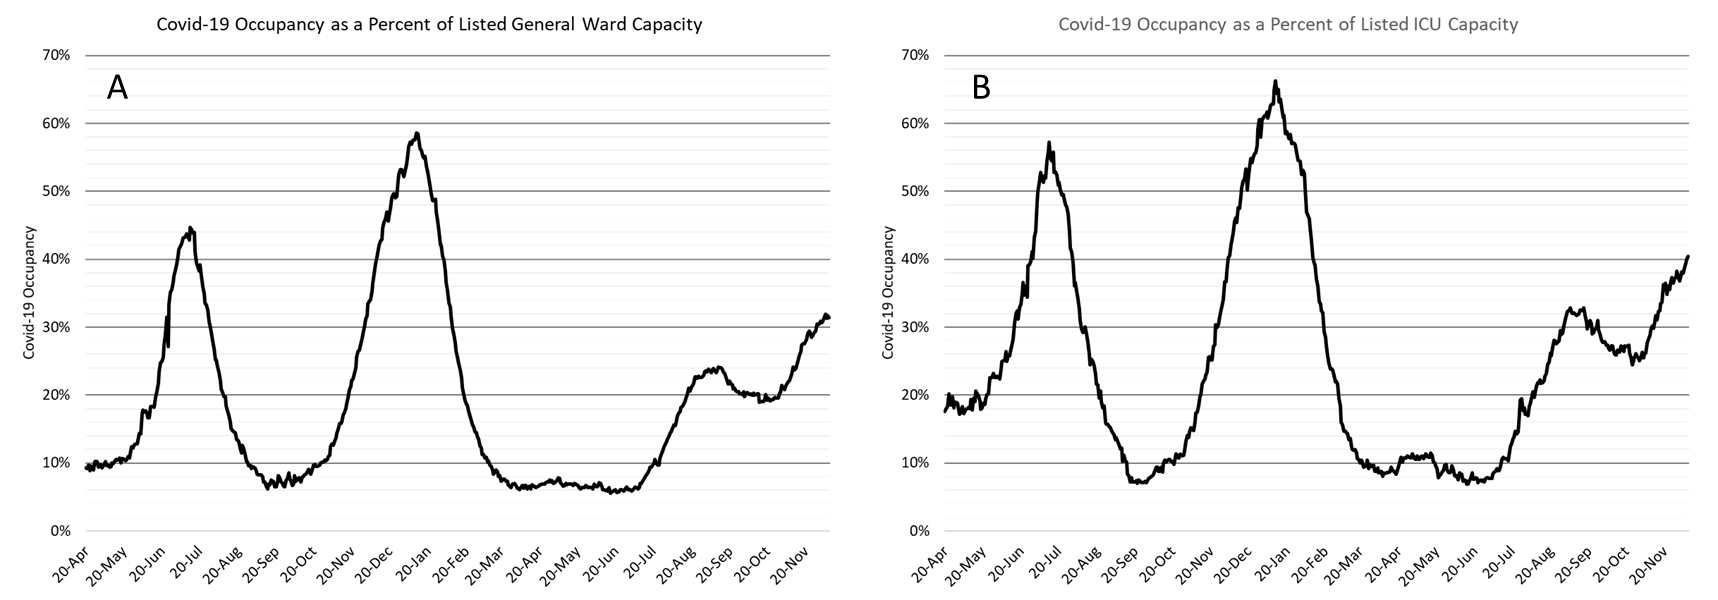
Figure 5. COVID-19 Occupancy as a Percent of Listed General Ward (A, left) and ICU (B, right) Capacity in Arizona April 20, 2020 – December 9, 2021. |
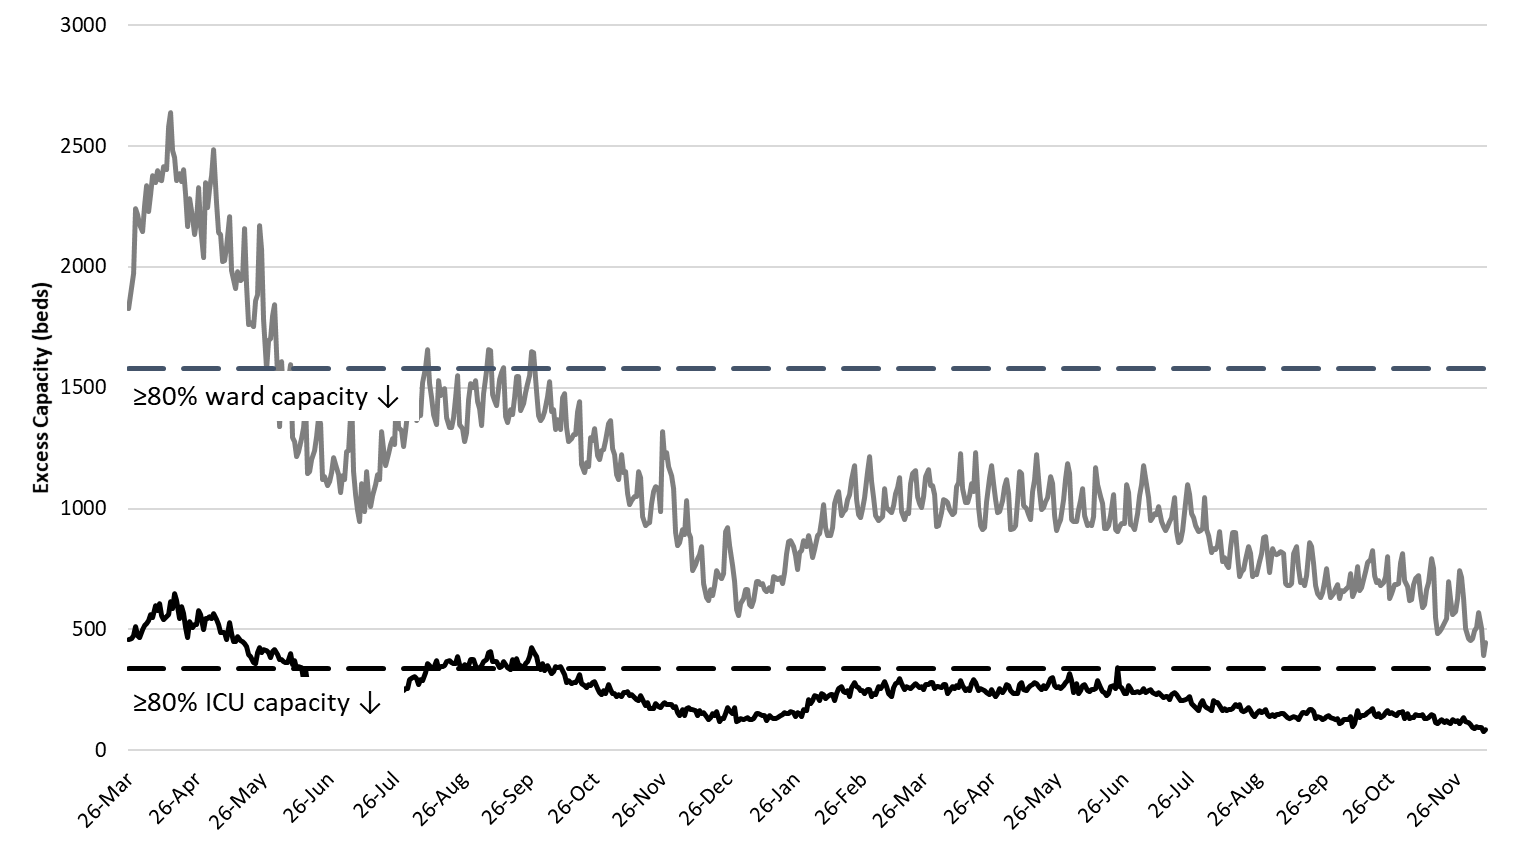
Hospital occupancy remains far above seasonal levels. Safety margins, as measured by available beds, remain at or below historical lows (Figure 6). In fact, the number of available ward and ICU beds both set record lows this week. Hospitals should prepare for >25% ward occupancy and >35% ICU occupancy for some time.
|
Figure 6. Observed Excess Non-Surge General Ward and ICU Capacity in Arizona March 26, 2020 – Dec 9, 2021. |
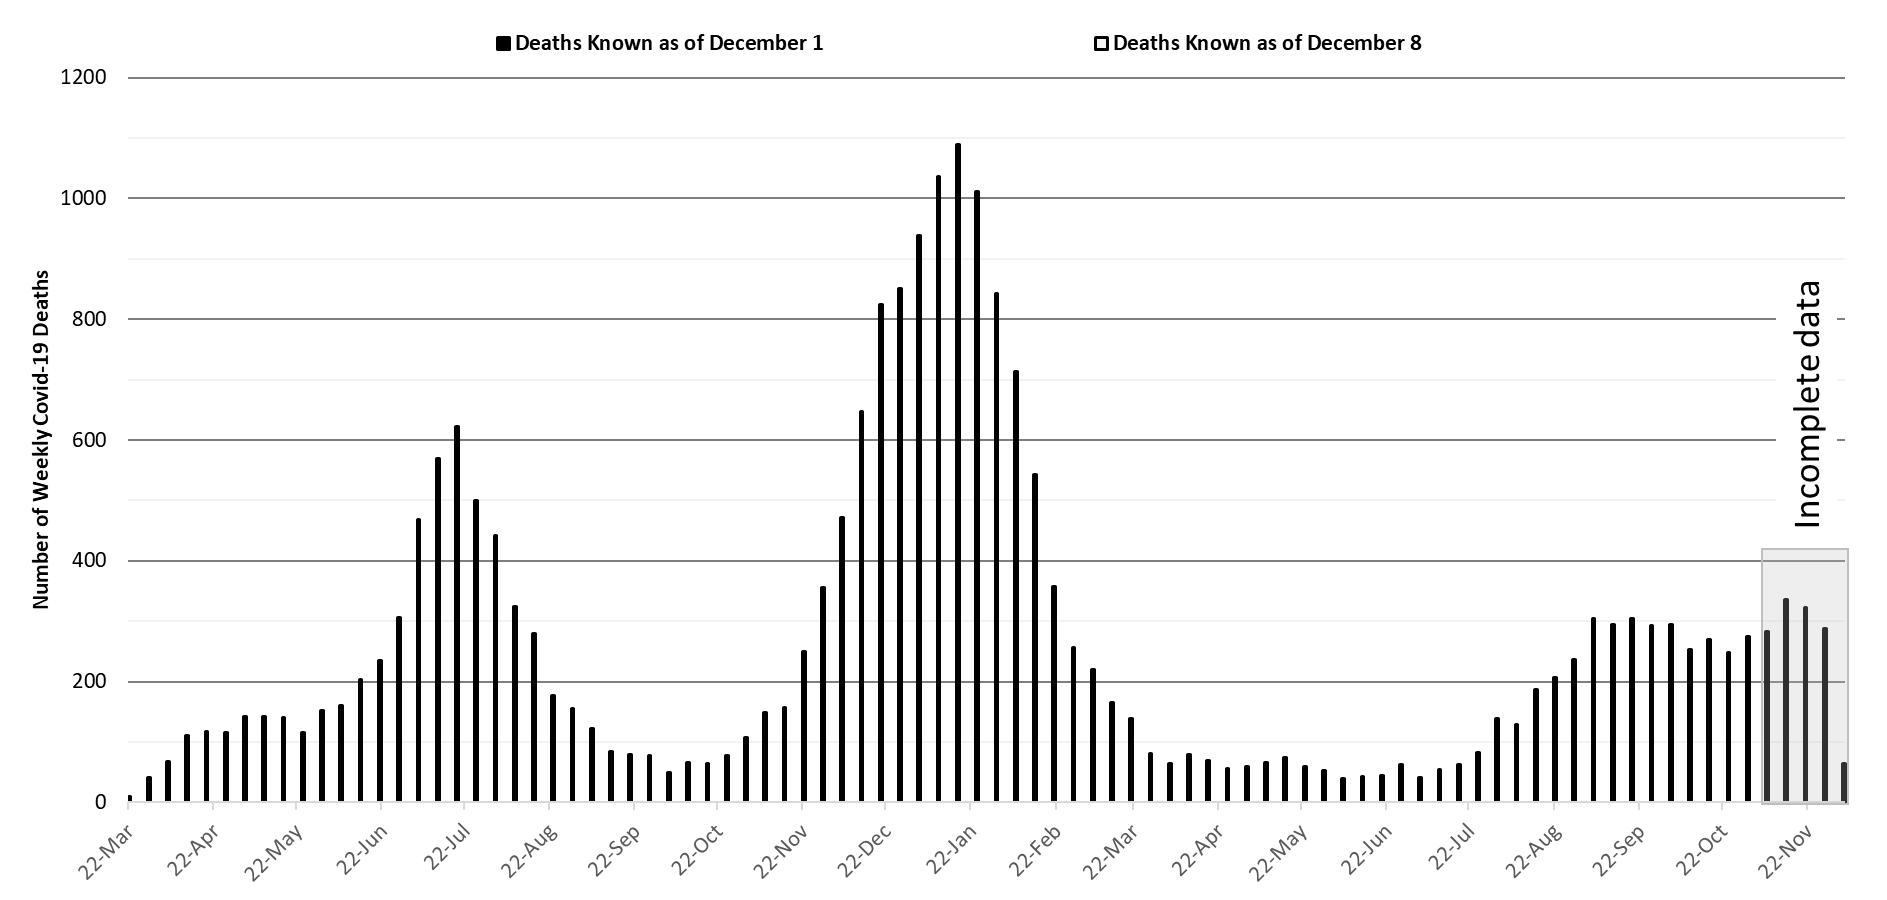
Arizona has been experiencing >200 COVID-19 deaths per week since August 22nd; and, beginning the week ending November 14th there have been >300 deaths a week (Figure 7). So far, 22947 Arizonans have lost their lives to COVID-19 making it Arizona’s leading cause of death, the only state to achieve such a distinction.
|
Figure 7. Weekly Arizona COVID-19 Deaths March 16, 2020 – December 5, 2021. |
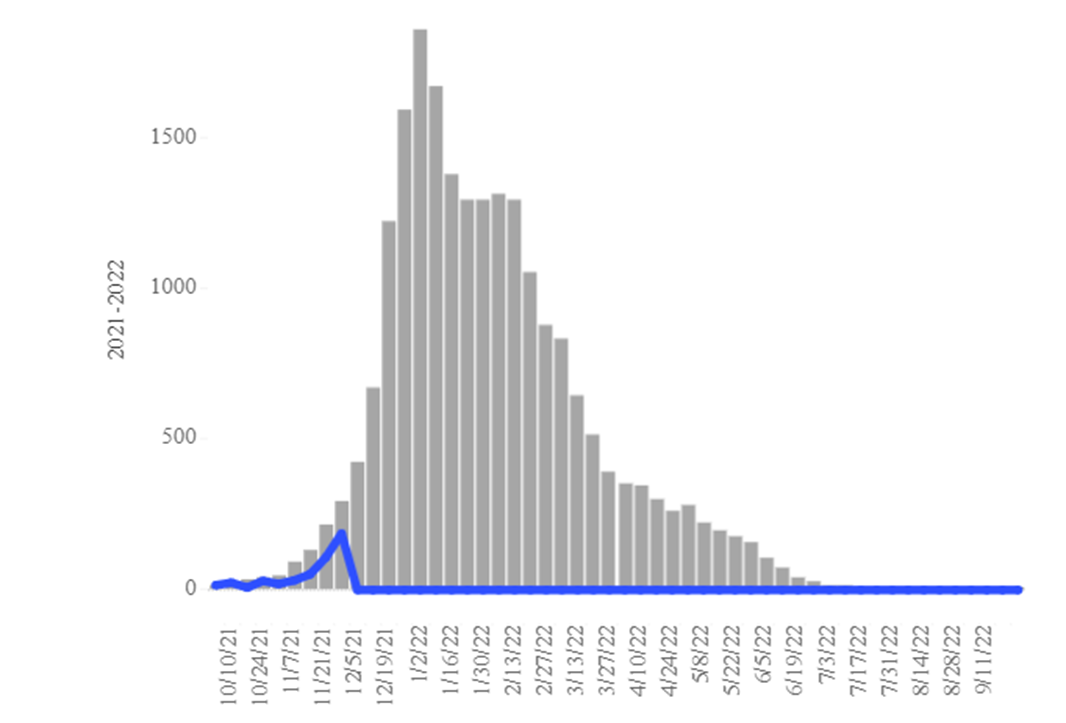
Seasonal influenza cases in Arizona (blue line) remain below the 5-year historical average (Figure 8, grey bars) but rates at or below historical averages could still cause a feared ‘twindemic’ in late December – early January. Given current levels of hospital crowding, even a below-average year could still tip the balance such that extreme overcrowding occurs. This trend bears close observation over the next 4 – 8 weeks.
|
Figure 8. Arizona Influenza Cases in 2021 (blue) versus 5-Year Historical Average (grey) |
Pima County Outlook
For the week ending December 5th, 3760 Pima County residents were diagnosed with COVID-19, a 10% decrease from the initial tally two weeks ago (Figure 9).
|
Figure 9. Weekly COVID-19 Cases in Pima County and Number of Individuals Undergoing COVID-19 Diagnostic Testing March 1, 2020 – December 5, 2021. |
Trends across the various age groups in Figure 10 below show generally lower transmission locally except among those ≥65 years.
|
Figure 10. Figure 10. COVID-19 Cases in Pima County by Age Group March 7, 2020 – December 5, 2021. (Data from week ending November 28 are suppressed). |
Summary
- Arizona continues to experience high levels of community transmission (Delta). Test positivity also remains high reminding us that test capacity, accessibility, and/or uptake is inadequate. Increasing case rates among older, highly vaccinated groups serves as a warning that major behavioral shifts and/or waning immunity could result in future increases in not only cases but also hospitalizations. In general, transmission will likely increase in fits-and-starts through the holidays before gradually subsiding in early 2022. However, the Omicron variant may cause cases to rise late January 2022.
- As of December 5th, new cases were being diagnosed at a rate of 404 cases per 100K residents per week.
- Mask mandates are once again needed at municipal and county levels to reduce transmission and relieve overwhelmed hospitals. Masking reduces viral transmission via aerosolized particles. Regardless of public action, individuals should mask in indoor settings using a KN-95 or better.
- Vaccination remains the most important medium-term public health priority to reduce transmission and severe illness.
- Waning vaccine immunity makes it imperative that all adults who were previously vaccinated obtain a booster, particularly those 50+ years of age.
- Third shot boosters provided additional protection against breakthrough infection https://jamanetwork.com/journals/jamainternalmedicine/fullarticle/2786890
- Third shot boosters may also provide additional protection against symptomatic breakthrough illness from Omicron (Page 20 – 21, UK Technical Briefing 31 https://assets.publishing.service.gov.uk/government/uploads/system/uploads/attachment_data/file/1040076/Technical_Briefing_31.pdf.
- Risk factors for breakthrough hospitalization and death were recently elucidated in the British Medical Journal: Down’s syndrome, kidney transplantation, sickle cell disease, nursing home residents, chemotherapy, recent bone marrow or solid organ transplantation (ever), HIV/AIDS, dementia, Parkinson’s disease, neurological conditions, and liver cirrhosis.
https://www.bmj.com/content/374/bmj.n2244 - ADHS and county health departments should re-open mass vaccination pods for boosters given low uptake among high-risk groups. There is a narrow window of opportunity over the next 6 weeks to prepare for a potential Omicron wave.
- Waning vaccine immunity makes it imperative that all adults who were previously vaccinated obtain a booster, particularly those 50+ years of age.
- The World Health Organization has named another COVID-19 variant of concern (VOC), the Omicron variant. https://www.who.int/news/item/26-11-2021-classification-of-omicron-(b.1.1.529)-sars-cov-2-variant-of-concern
- The United Kingdom published a good overview of Omicron’s impact so far (Dec 10): https://assets.publishing.service.gov.uk/government/uploads/system/uploads/attachment_data/file/1040076/Technical_Briefing_31.pdf
- A pre-print (not peer-reviewed) examines various Omicron scenarios in the UK. Most models predict another large case wave beginning late December with peaks exceeding those of last year. Hospitalizations and deaths are expected to be lower than last year under many, but not all scenarios. While preliminary, it behooves us to act sooner rather than later. https://cmmid.github.io/topics/covid19/reports/omicron_england/report_11_dec_2021.pdf
- For those wanting to track variant data, here are links to genomic state data (https://pathogen.tgen.org/covidseq-tracker/) and national data (https://covid.cdc.gov/covid-data-tracker/#variant-proportions). Other surveillance methods include S-gene Target Failure (SGTF) from PCR testing and wastewater surveillance. Unfortunately, I do not have any links to publicly available data for these latter two mechanisms.
- COVID-19 hospital occupancy is increasing and will likely exceed 25% of all beds in the general ward and 35% of beds in the ICU for the remainder of the year. Access to care will continue to be restricted in the face of staff shortages in inpatient and outpatient settings.
- Weekly COVID-19 deaths have now reached 300 per week and should remain at or above this level as long as cases exceed 20000 per week. So far, 22561 Arizonans have lost their lives to COVID-19.
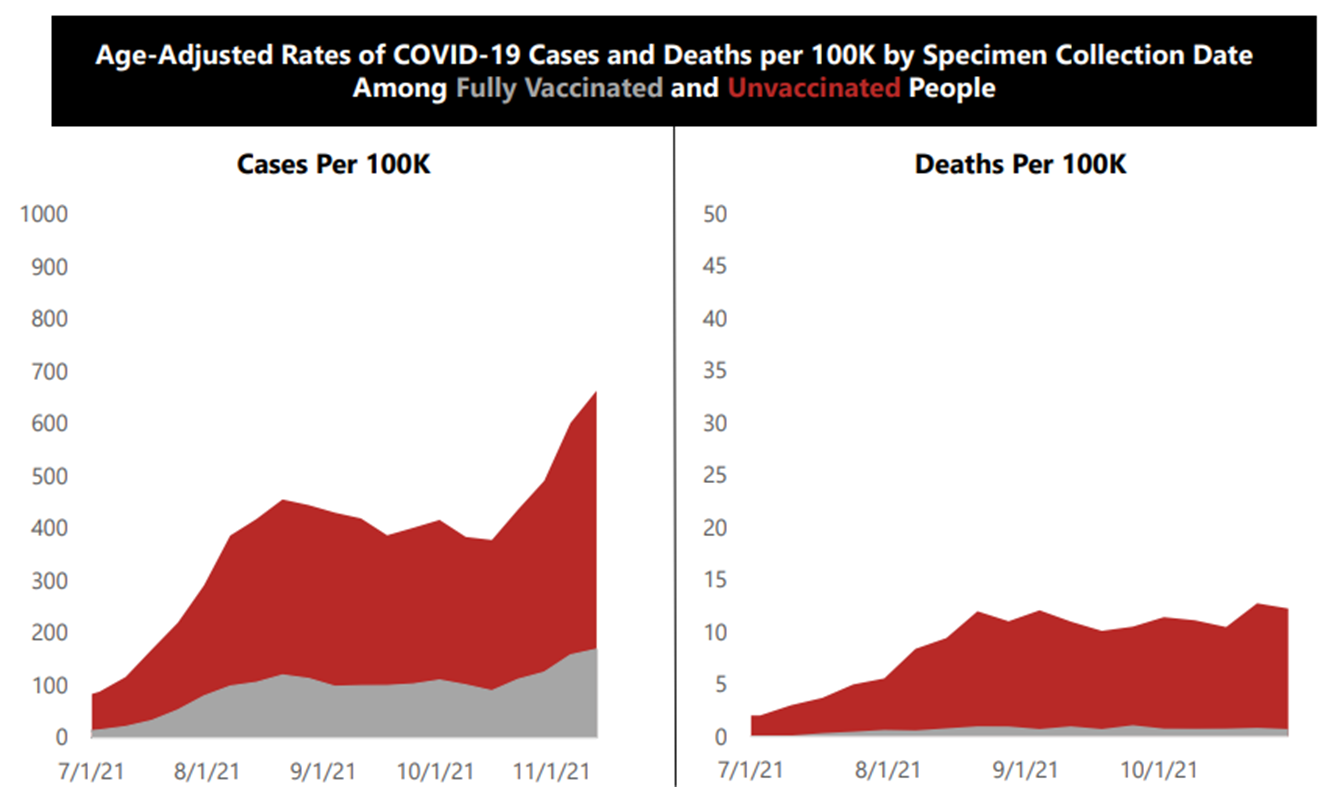
- ADHS released its first report of COVID-19 cases and deaths by vaccination status. Consistent with data from other geographic regions, case rates are 4X higher and death rates are 15X higher in the unvaccinated than the vaccinated.
https://www.azdhs.gov/covid19/documents/data/rates-of-cov-19-by-vaccination.pdf
- ADHS released its first report of COVID-19 cases and deaths by vaccination status. Consistent with data from other geographic regions, case rates are 4X higher and death rates are 15X higher in the unvaccinated than the vaccinated.
Forecast reports to date, available as PDFs
Download PDF to view additional charts of Arizona counties, available in appendix of report.
2020 Reports
Based on what we know now about this pandemic, we support guidelines for social distancing to slow the spread of the virus and urge everyone to follow the recommendations provided by the Centers for Disease Control and Prevention (CDC) to protect yourself, your family, your neighbors, and your employees. Please heed the recommendations as provided by the CDC.
COVID covid coronavirus virus covid19 corona forecast model