
COVID-19 Forecast Models Report for Arizona, January 29 Update
Note this forecast page is not the most recent forecast available.
View the most current forecast report
Researcher Analyzes Arizona COVID-19 Spread Models for Decision-Makers
The following information regarding the spread of COVID-19 in Arizona was prepared by Joe Gerald, MD, PhD, a researcher at the Mel and Enid Zuckerman College of Public Health (MEZCOPH) at the University of Arizona. This information has also been reviewed by other MEZCOPH faculty.
This data were obtained from the Arizona Department of Health Services COVID-19 webpage and reflect conditions in Arizona as of January 29, 2021.
This information is intended to help guide our response to the outbreak. It is not intended to predict how this pandemic will evolve. Rather, this model extrapolates what might occur if current conditions remain unchanged. As regional authorities and healthcare providers respond, their actions are expected to mitigate the worst consequences of this pandemic.

COVID-19 Disease Outbreak Forecast
Arizona State and Pima County
Updated January 29, 2021
Disclaimer: This information represents my personal views and not those of The University of Arizona, the Zuckerman College of Public Health, or any other government entity. Any opinions, forecasts, or recommendations should be considered in conjunction with other corroborating and conflicting data. Updates can be accessed at https://publichealth.arizona.edu/news/2021/covid-19-forecast-model.
**NOTICE** While conditions are improving, Arizona remains in a public health crisis where access to critical care services is limited due to shortages of space, personnel, and critical supplies. These conditions will persist into early February before easing. Additional mitigation efforts could further slow viral transmission, more quickly reduce hospital burden, and allow additional time to vaccinate those at greatest risk.
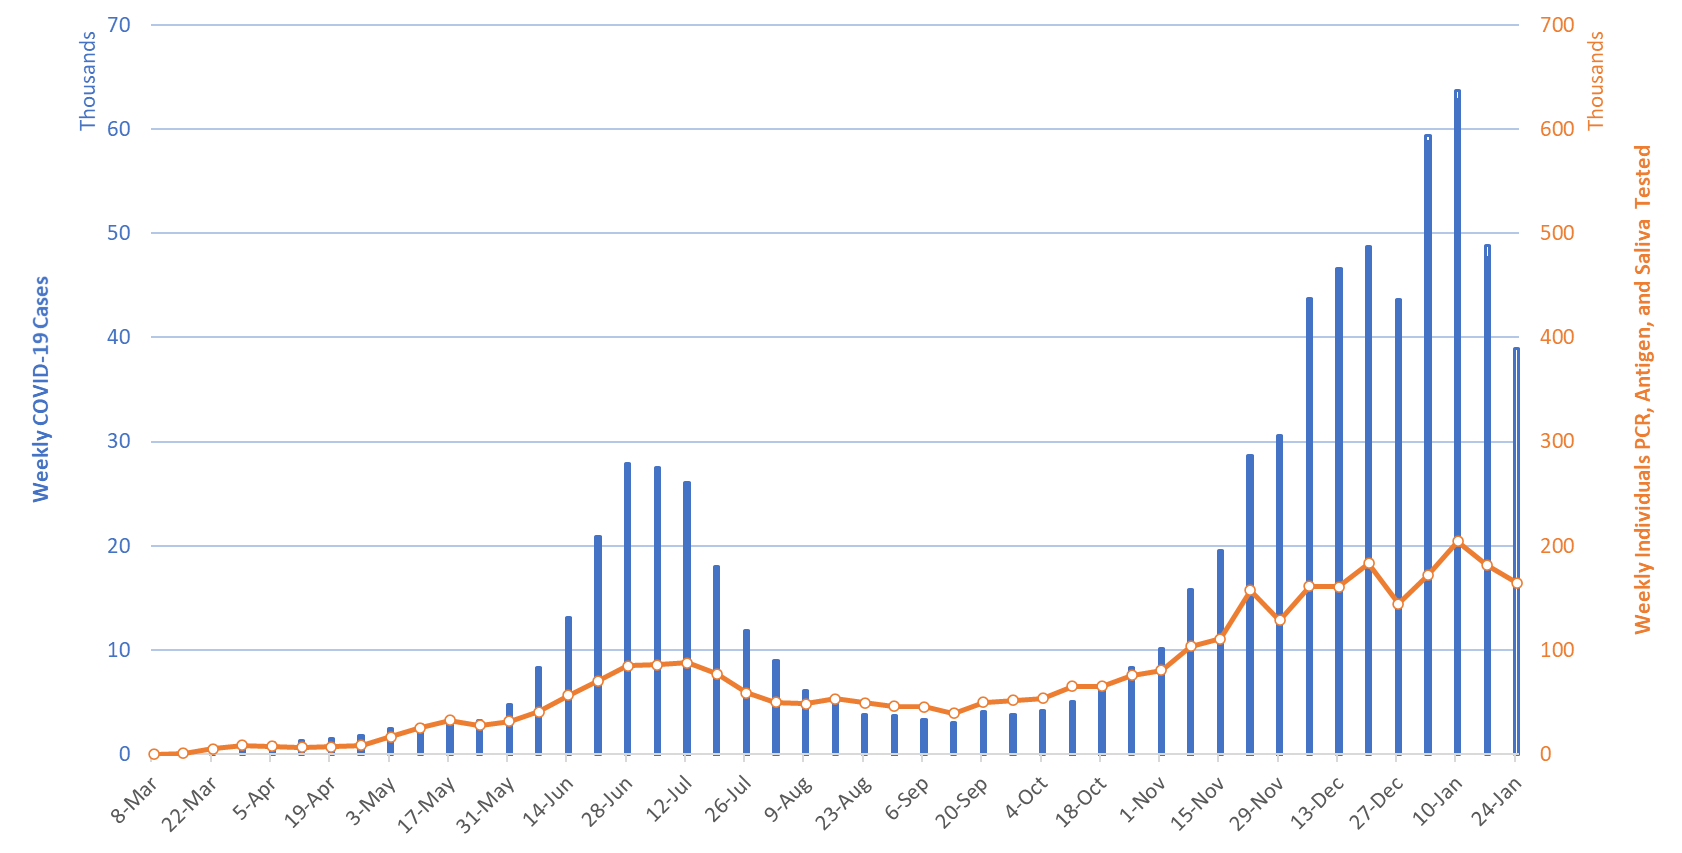
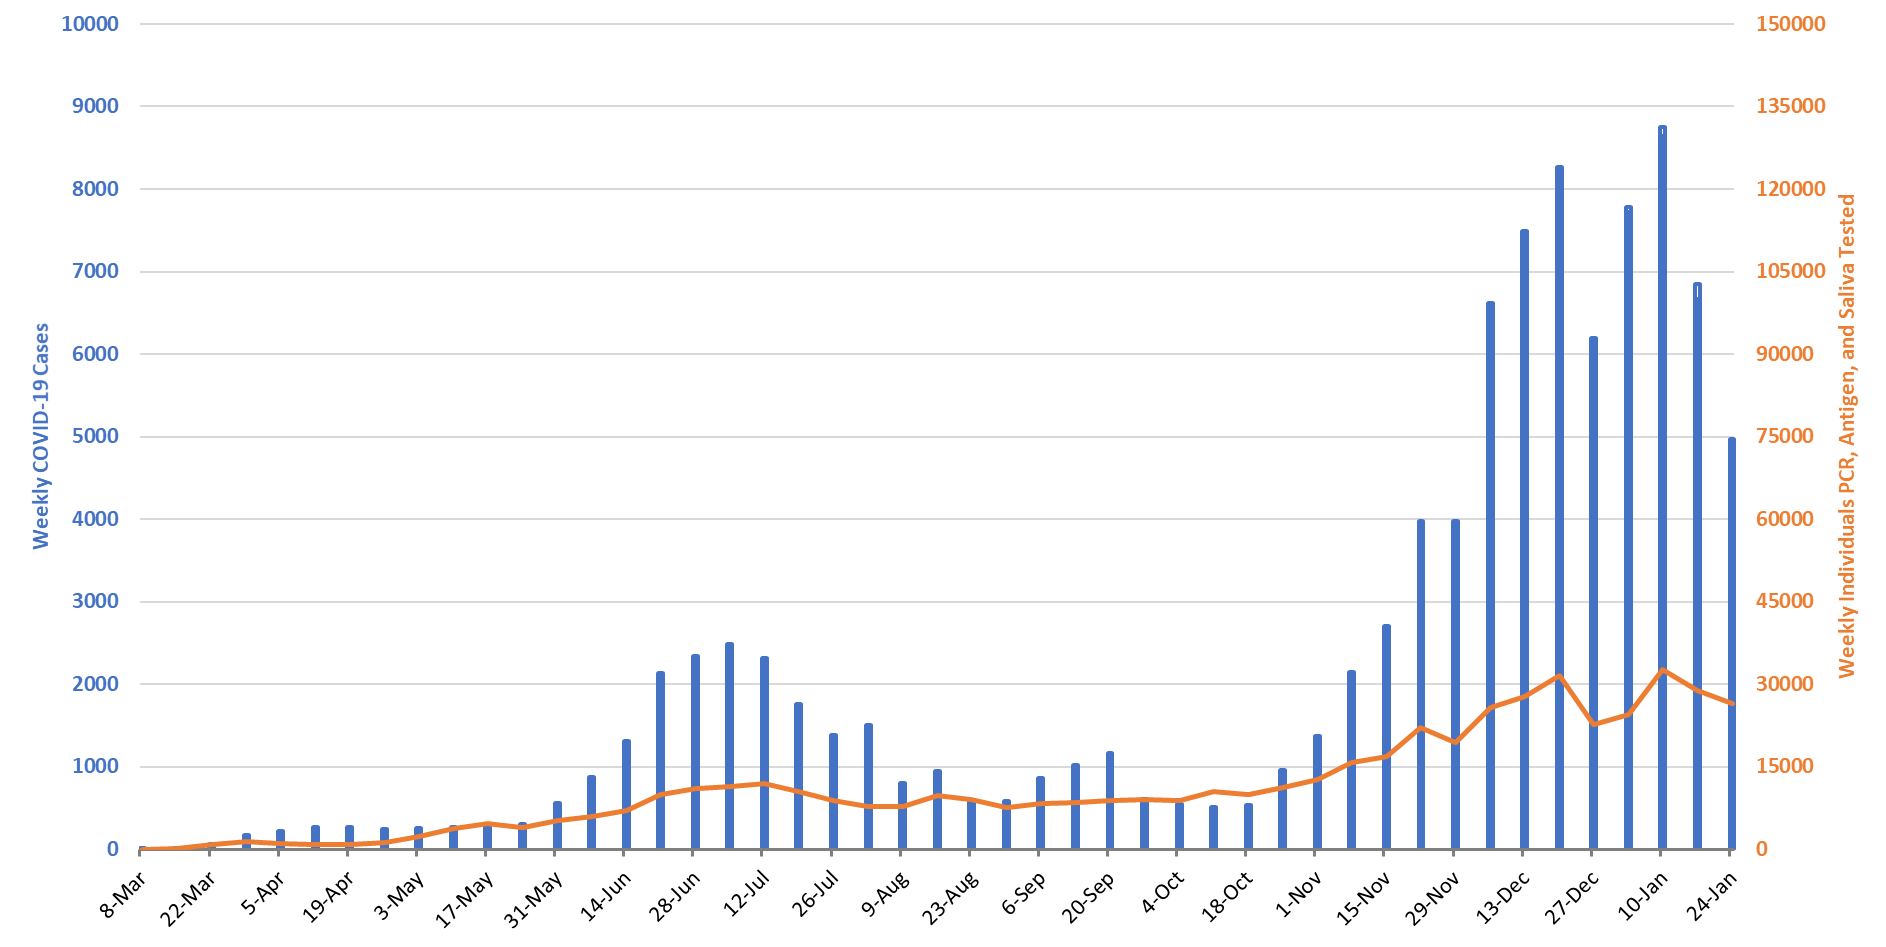
For the week ending January 24th, at least 38921new Covid-19 cases were diagnosed in Arizona (Figure 1). This represents an 18% decrease from last week’s initial tally of 47637 cases and the second straight week of decline. The prior week’s tally has since been upwardly revised by 3% (1226 cases) to 48863 cases.
|
Figure 1. Newly Diagnosed Covid-19 Cases in Arizona and Number of Individuals Undergoing Covid-19 Diagnostic Testing March 1 through January 24, 2021. |
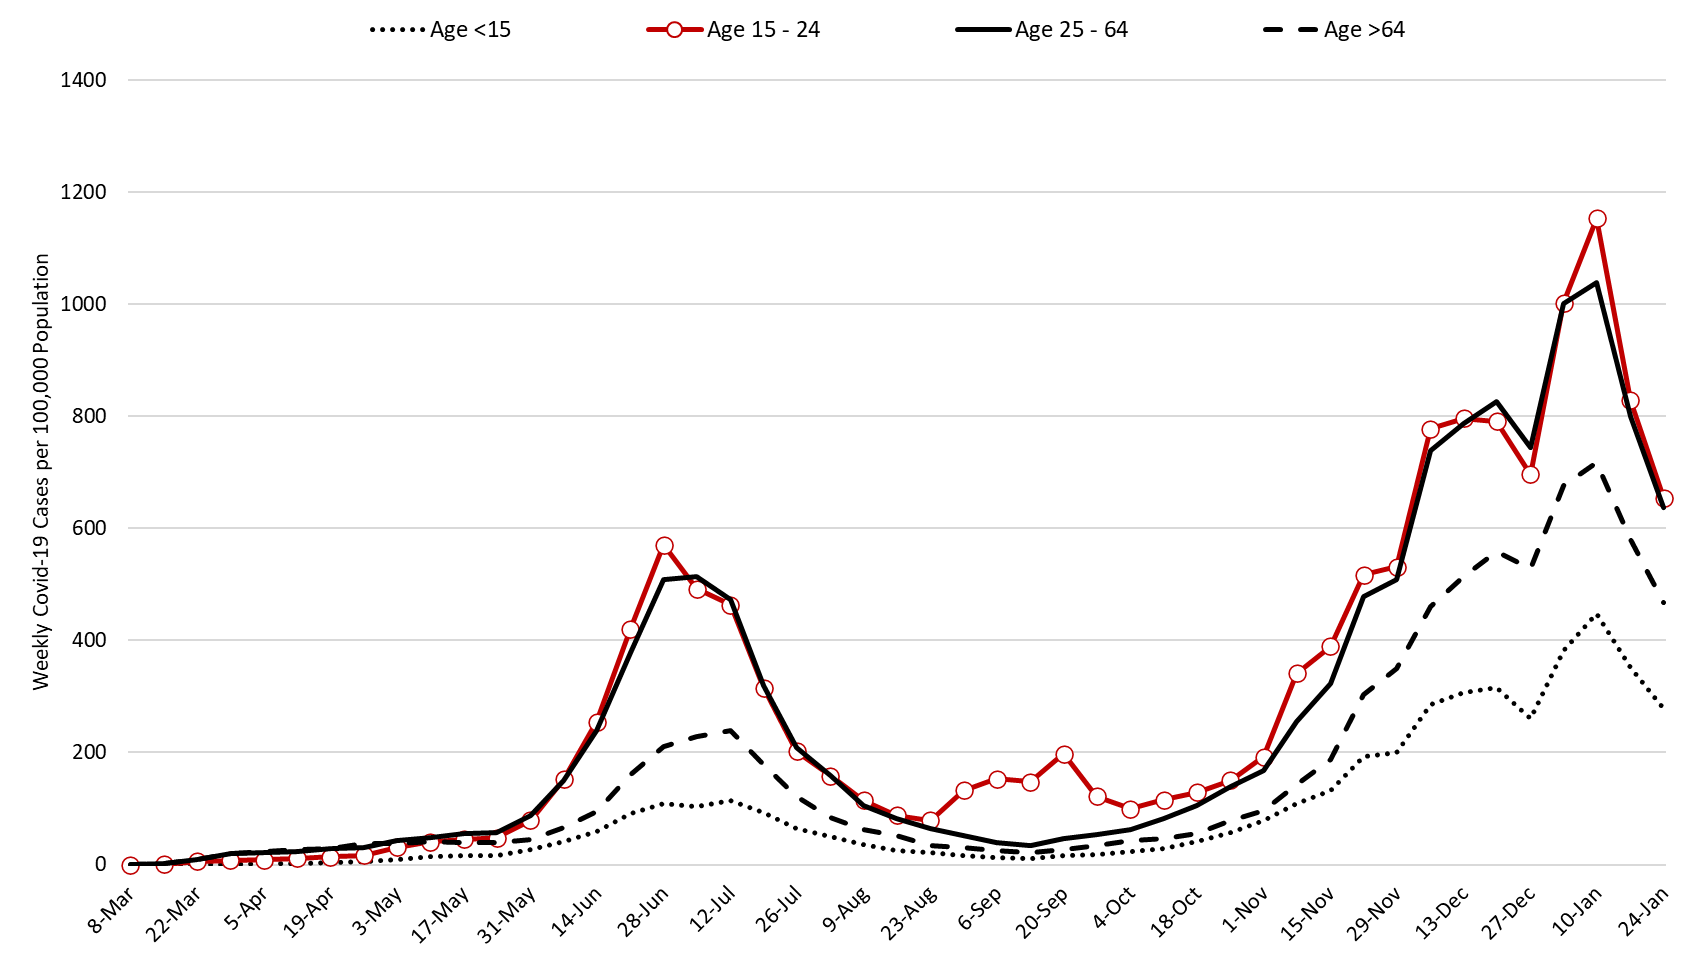
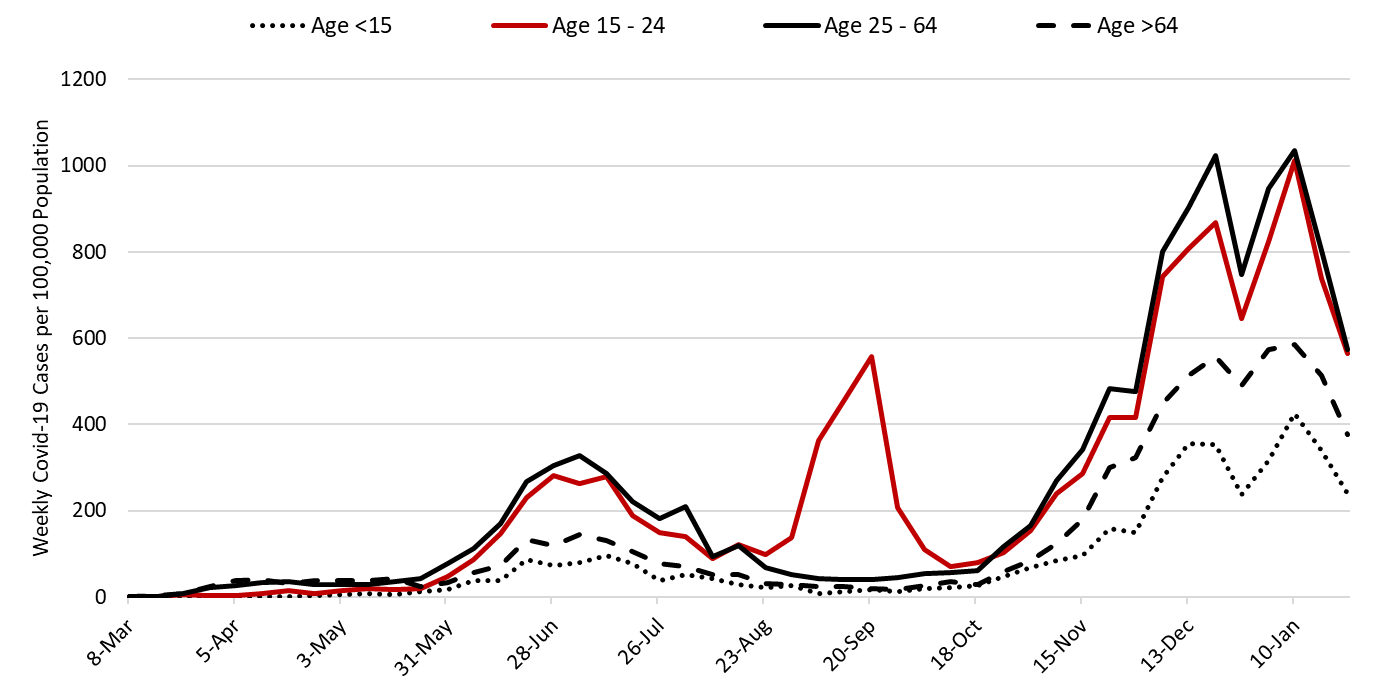
The number of Arizonans tested for Covid-19 declined once again the week ending January 24th. Test positivity also declined, dropping from a peak of 35% the week ending January 3rd to 29% the week ending January 24th. This lends additional evidence that viral transmission is slowing and that the decline in testing is due to slackening demand. Nevertheless, testing capacity remains woefully inadequate for the scale of the problem. The outbreak remains broadly entrenched and trends are similar across age groups (Figure 2).
Note: Data for this report was updated Friday, January 29 allowing 4 full days to adjudicate cases and keep week-over-week backfill 10%. This allows more interpretable comparisons and graphics. All comparisons are week-over-week changes. Future updates will be released on Saturdays.
|
Figure 2. Newly Diagnosed Covid-19 Cases in Arizona by Age Group March 1 through January 24, 2021. |
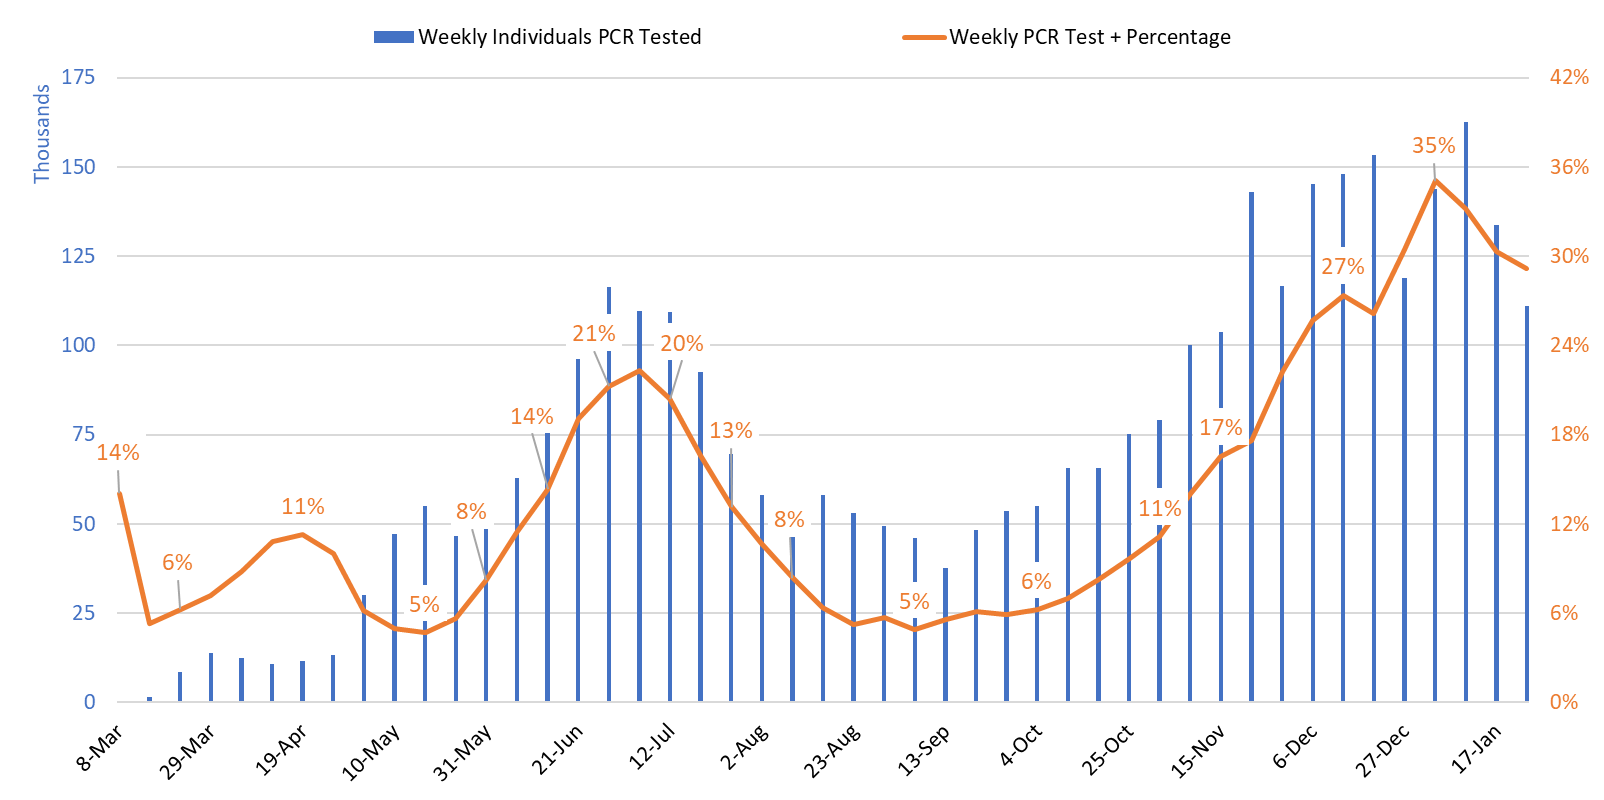
Test positivity among those undergoing traditional nasopharyngeal PCR testing decreased from 30% the week ending January 17th to 29% the week ending January 24th (Figure 3). The continued decline in positivity indicates that viral transmission is in fact slowing. Nevertheless, 29% test positivity reflects woefully inadequate testing capacity as it should be less than 5 – 10%.
|
Figure 3. Weekly Number Patients Undergoing Traditional Nasopharyngeal PCR Testing and Associated Percent Positivity March 1 – January 24, 2021. |
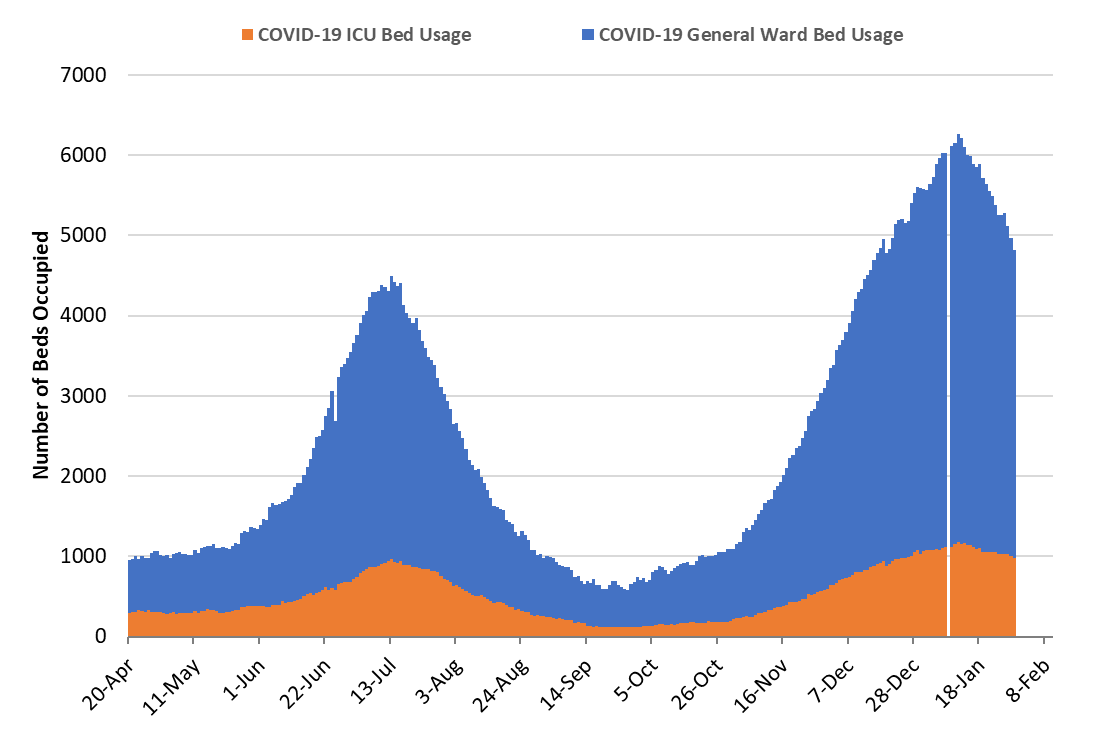
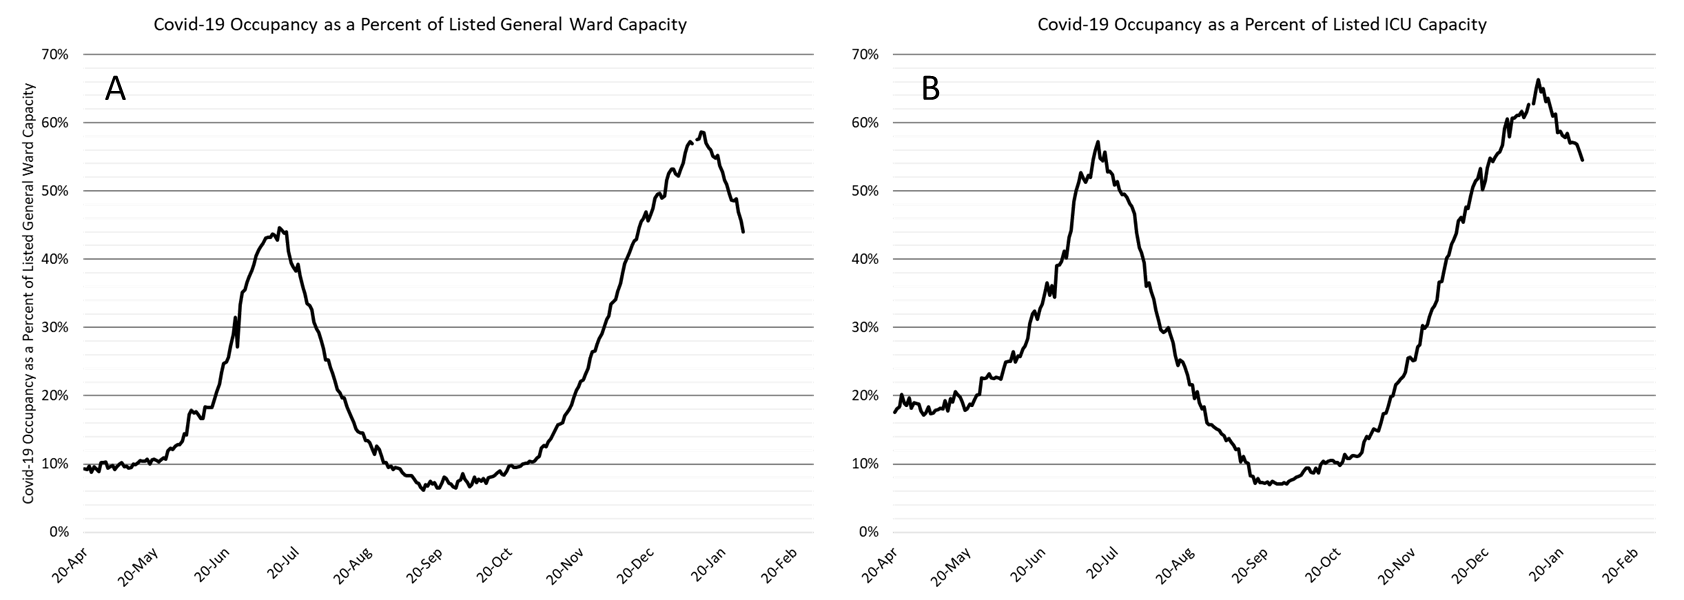
As of Jan 29th, 3828 (44%) of Arizona’s 8700 general ward beds were occupied by Covid-19 patients, a 14% decrease from the previous week’s 4442 occupied beds (Figure 4 and Figure 5 Panel A). Another 828 (9%) beds remained available for use. The number of available beds is higher than the previous week’s 815 beds.
While still incredibly high, there are fewer Covid-19 patients in the hospital this week as compared to last. This persistent trend is good news and substantiates that viral transmission continues to slow.
|
Figure 4. Arizona Daily Covid-19 General Ward and ICU Census April 20 – January 29, 2021. |
As of January 29th, 984 (55%) of Arizona’s 1804 ICU beds were occupied with Covid-19 patients, a 6% decrease from the prior week’s count of 1049 patients (Figure 4 and Figure 5 Panel B). An additional 141 (8%) ICU beds remain available. This is lower than the prior week’s 152 beds.
|
Figure 5. Covid-19 Occupancy as a Percent of Listed General Ward (A, left) and ICU (B, right) Capacity in Arizona April 20 – January 29, 2021. |
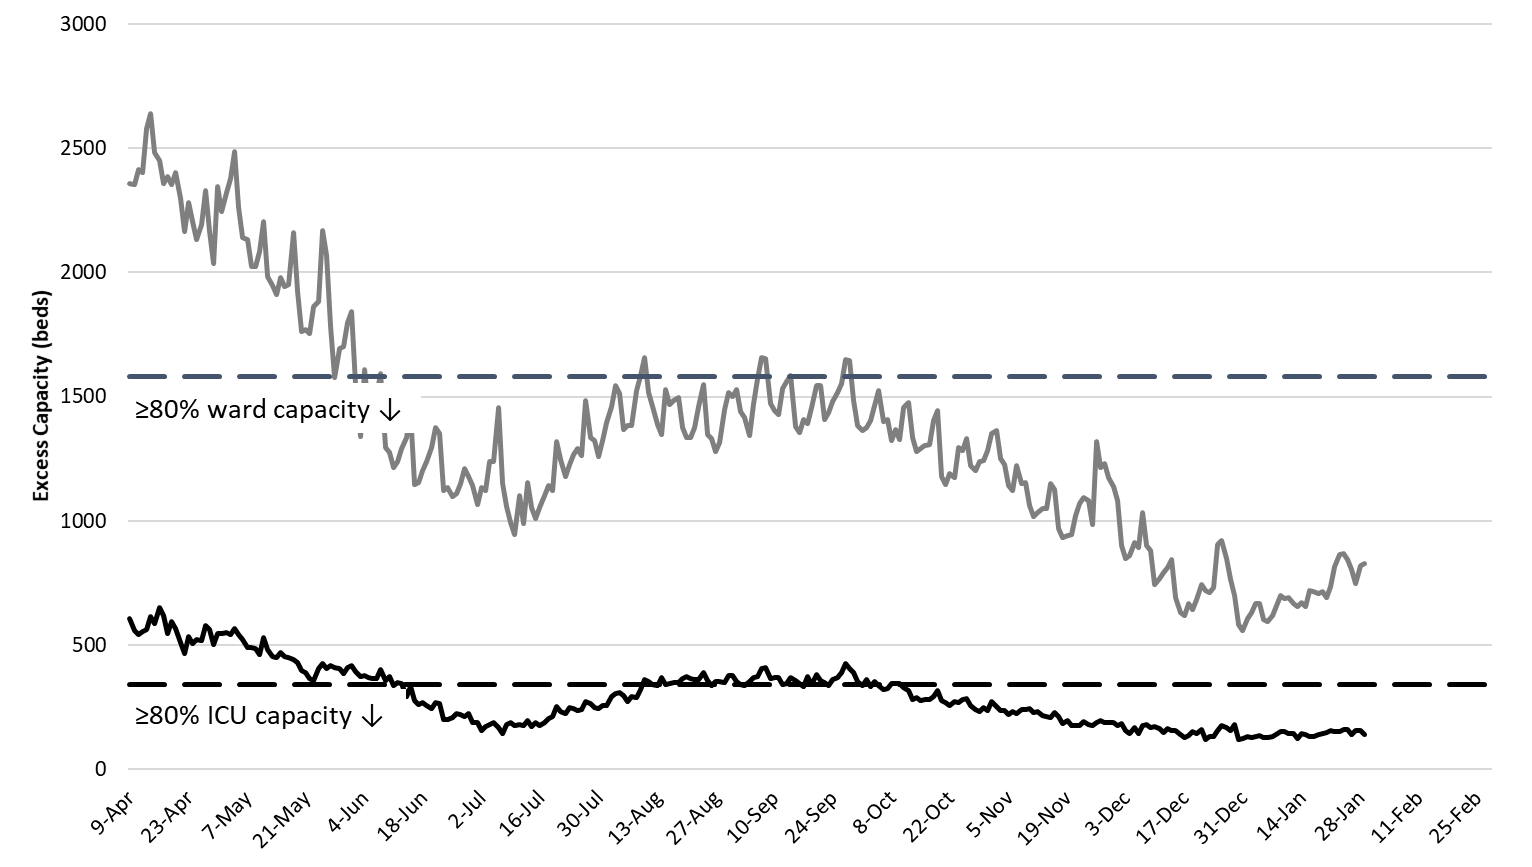
Arizona hospitals’ safety margins remains low in the general ward and more noticeably in the ICU (Figure 6). Hospitals are now beginning to resume scheduled procedures in a limited capacity. Nevertheless, the tremendous backlog of postponed care will take months to resolve. The recent trends in hospitalization numbers and occupancy are encouraging. As capacity constraints are lessened, care practices should return to those prior to the outbreak ensuring all patients will receive optimal care. Nevertheless, hospitals will remain crowded through February before returning to pre-outbreak levels in early spring assuming continued reductions in viral transmission.
|
Figure 6. Observed Excess Non-Surge General Ward and ICU Capacity April 20 – January 29, 2021. |
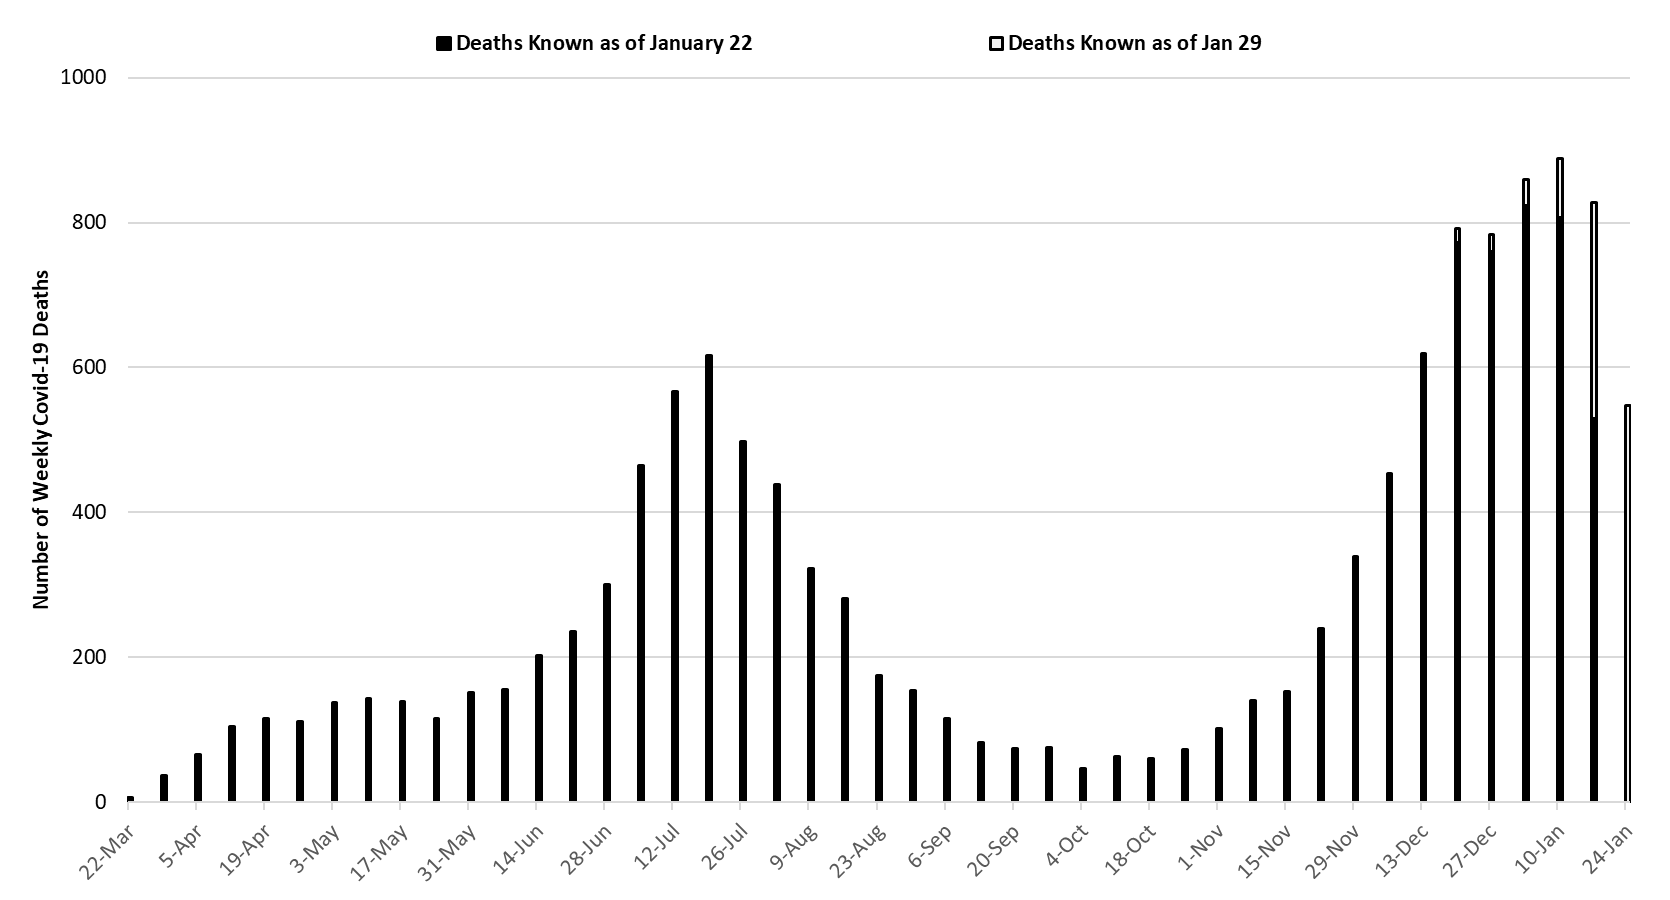
The week ending January 10th has seen 889 deaths so far, making it Arizona’s deadliest week (Figure 7). The week of January 10th or 17th will likely end up being Arizona’s deadliest weeks with subsequent improvement from that point onward. Nevertheless, Covid-19 deaths are expected to remain exceptionally high for the next 4 - 6 weeks.
|
Figure 7. Weekly Arizona Covid-19 Deaths March 1 – January 24, 2021. |
Updated Arizona State University Covid-19 Forecast
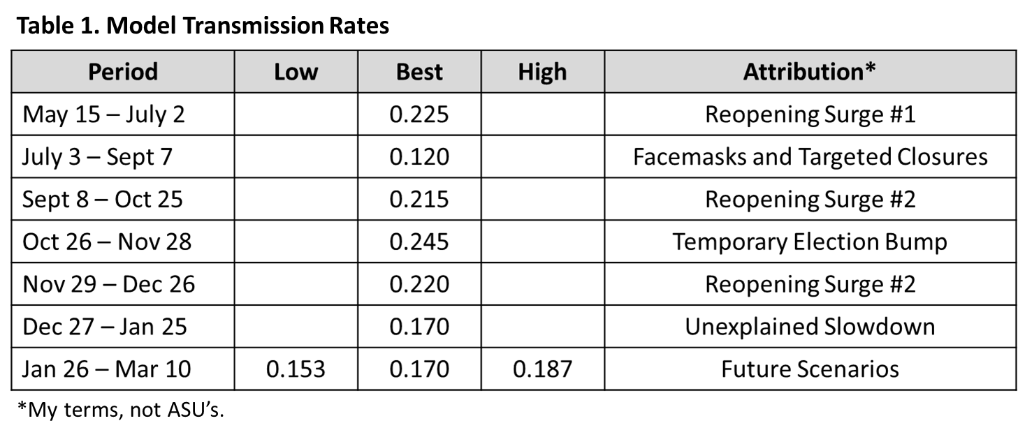
The ASU Covid-19 modeling group updated its projection of cases, hospitalizations, and deaths through mid-January (partial report). This update was prompted by the recently observed decrease in viral transmission. The main findings are summarized below. As a reminder, they developed a SEIR model (susceptible, exposed, infected, recovered) that “tracks” hypothetical individuals through the course of the epidemic. Using observed Covid-19 deaths, the ASU groups estimates Arizona-specific transmission rates designated by the β term in Table 1. These rates are dependent on epidemiologic factors and existing mitigation efforts (e.g., face coverings, physical distancing, and business closures).
They have identified 6 distinct transmission periods (the dates are theirs; the attributions are mine). The first (May – July) reflects the reopening surge after a 6-week shelter-in-place order expired. The second (July – Sept) reflects an 8-week decline attributable to local face-mask ordinances and targeted state-wide business closures. The third (Sept – Oct) reflects a resurgence of viral transmission following the expiration of the summer’s targeted business closures. A temporary acceleration was observed around the 2020 presidential election (November) after which transmission returned to a baseline rate of ~0.220 for the month of December. The most recent 6th period (January) is marked by an unexplained, but welcomed, slowdown.
|
Table 1. Model Transmission Rates |
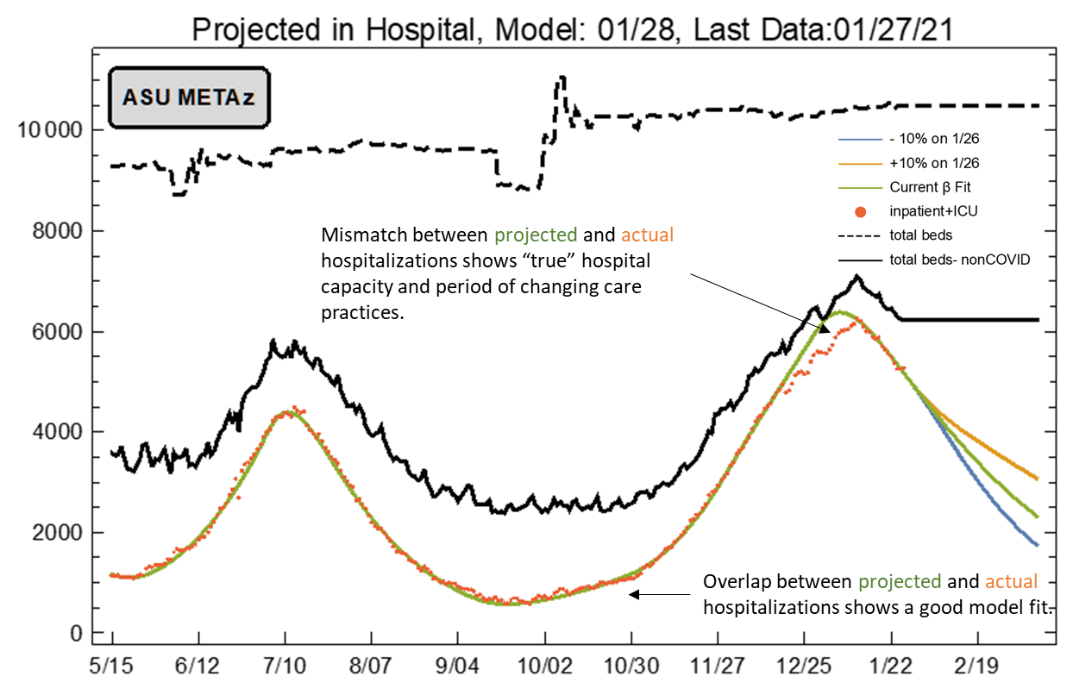
Each of these periods’ transmission rates were used to predict the number of Covid-19 hospitalizations (Figure 8). As can be seen, the actual number of observed hospitalizations (orange dots) closely match the predicted number (green line). This is true throughout the observation period except during December – January when hospital capacity was most stressed. The ASU team (and I concur) believes this deviation identifies when hospital capacity exceeded “true” capacity as compared to listed capacity. In other words, this period was one in which clinical practices most strikingly deviated from previous practices leading many patients to be managed in a lower-intensity setting than compared to standard-of-care practices (e.g., discharged home instead of admitted). Similar results were obtained for ICU admissions.
Looking forward, their model assumes 3 scenarios: current transmission rates remain unabated (β = 0.170, green), transmission accelerates (β = 0.187, orange), or transmission declines (β = 0.153, blude). The low and high assumptions reflect arbitrary 10% deviances around their best-fit estimate.
|
Figure 8. ASU Covid-19 Modeling Group Estimate of Hospitalization in Maricopa County through March 10th (January 27 Model Update). |
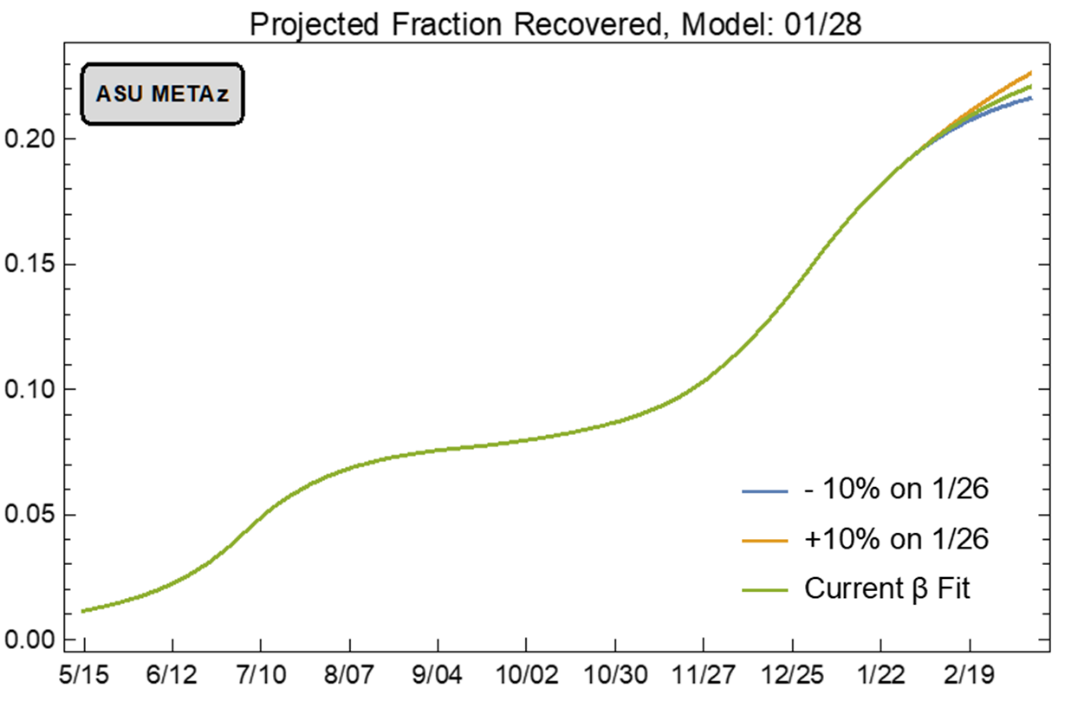
The ASU model also predicts the size of the previously infected, now recovered population (Figure 9). While they predict 20% of Arizonans are recovered, 80% remain at-risk. Enough such that transmission rates can still markedly increase.
For this reason, continued adherence to recommended public health practices (e.g., mask wearing, physical distancing, and hand hygiene) will remain an essential part of our coronavirus response for months to come. Furthermore, it is vital that we strengthen Arizona’s vaccine infrastructure to “put more shots in arms.” We are in a race to see whether infection or vaccination get us to herd immunity first. With more transmissible variants in play, the virus is going to be harder to stop moving forward.
**A special thank you to the members of the ASU Covid-19 Modeling Group for their efforts to bring greater understanding of the current outbreak and for sharing their report with me.
|
Figure 9. ASU Covid-19 Modeling Group Estimate of Proportion of Recovered Individuals through March 10th (January 27 Model Update). |
Pima County Outlook
For the week ending January 17th, 4969 Pima County residents were diagnosed with Covid-19 (Figure 10). This represents a 26% decrease from the 6671 cases initially reported last week. Test capacity and/or uptake also declined from last week.
|
Figure 10. Covid-19 Cases and Individuals Undergoing Diagnostic Testing in Pima County Mar 1 – Jan 24 |
Last week’s initial tally of 6671 cases was upwardly revised by 3% (184 cases) this week. Trends are similar across various age groups (Figure 11).
|
Figure 11. Covid-19 Cases by Age Group in Pima County from March 1 – January 24, 2021. |
Summary
- This week saw another meaningful decline in Covid-19 cases which now clearly represents a sustained, real decrease in viral transmission. This decline is accompanied by reductions in hospital and ICU occupancy. Reductions in mortality should quickly follow. While this reprieve is welcomed, the absolute level of SARS-CoV-2 virus transmission remains exceptionally high.
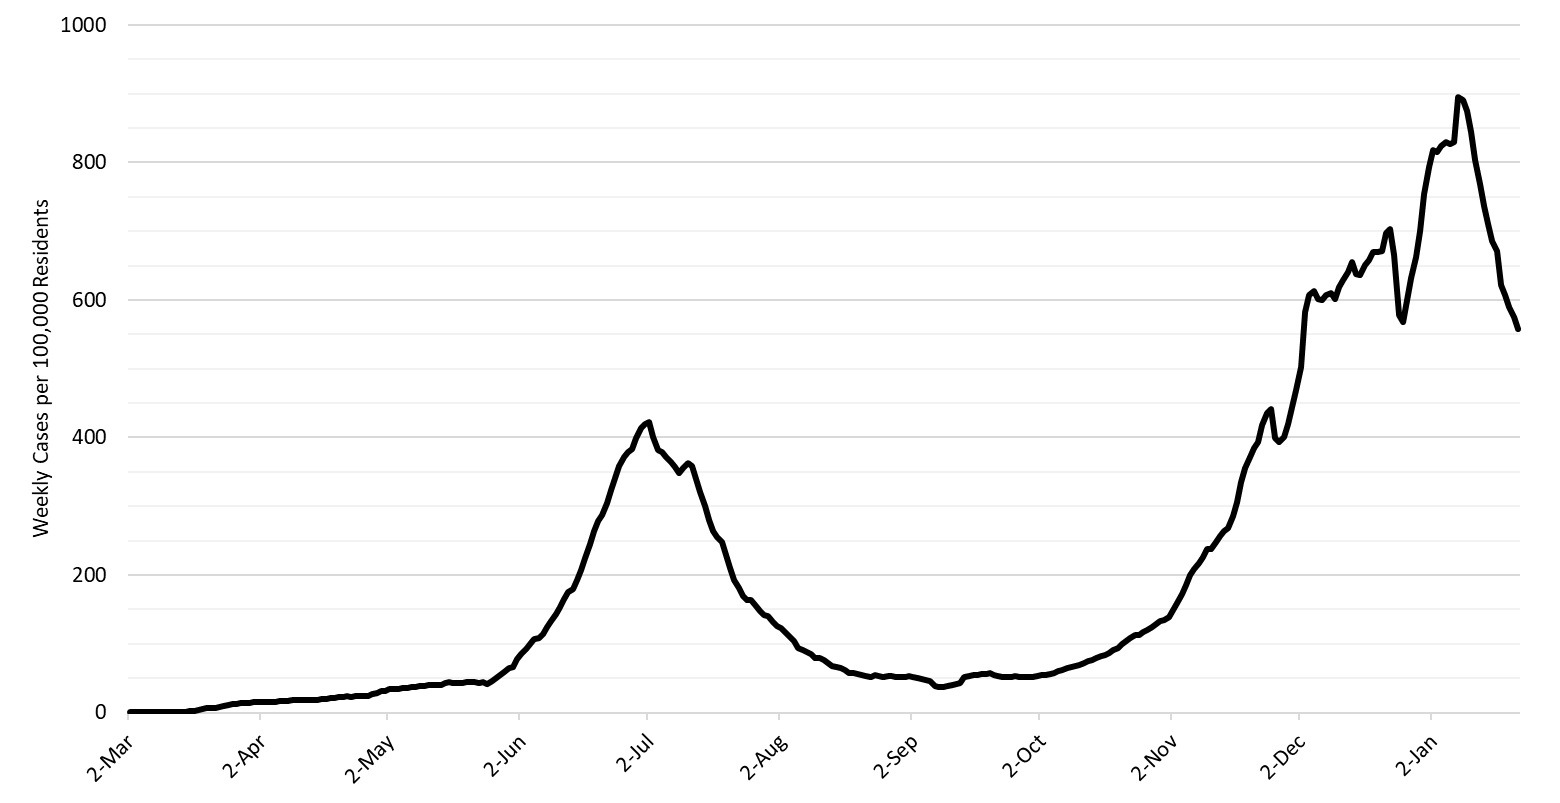
- As of January 24th, new cases were being diagnosed at a rate of 557 cases per 100,000 residents per week (Figure 12 below). This rate was declining by 150 cases per 100,000 residents per week. Despite this improvement, no other state is experiencing faster transmission than Arizona according to the CDC. Because of this, Arizona has moved up 2 positions to the 6th hardest hit state since the outbreak began.
- Arizona is reporting >800 Covid-19 deaths per week (>115 per day) and this count may underestimate true fatalities by half (see Woolf, Woolf, or Weinberger). Many of these deaths were preventable if the state had more aggressively adopted evidenced-based public health practices. Arizona’s weekly tally of deaths now ranks second in the nation. Overall, we rank 10th.
- The Arizona Public Health Association released a report on all-cause mortality during the Covid-19 pandemic. The main finding is that all-cause mortality was 23% higher in 2020 than 2019 with the months of July and December being outliers with 64% and 61% higher mortality, respectively. This translates into approximately 15,000 excess deaths.
- The Arizona Public Health Association also released a report that describes the chronological course of the Covid-19 outbreak in Arizona and chronicles the state’s response or lack thereof.
|
Figure 12. 7-Day Moving Average of Arizona Covid-19 Cases by Date of Test Collection Mar 1 – Jan 24, 2021. |
- All Arizona residents should continue to wear a mask in public, avoid social gatherings, maintain physical distance from non-household contacts, avoid >15 minutes contact in indoor spaces, especially if physical distancing is inadequate and adherence to face masks is low.
- Hospital Covid-19 occupancy is declining in the ward and ICU. However, access to care for Covid-19 and non-Covid patients remains restricted in ways that are difficult to understand owing to changes in care practices.
- Hospitals continue to postpone many scheduled procedures to create additional capacity for Covid-19 patients at the expense of others with serious medical conditions.
- Health professionals are being asked to work additional hours and assume duties outside their traditional scope of practice.
- The test positivity rate for traditional nasopharyngeal PCR testing declined for the third straight week, dropping from a peak of 35% to 29% this past week. Nevertheless, our testing capacity is wholly inadequate to the scale of the problem and other regions.
- So far, 1110 per 100,000 (1.1%) Arizona residents have received at least 2-doses of vaccine while 6044 per 100,000 (6.0%) have received at least 1-dose. Arizona vaccination roll-out places us in the bottom half of US states. To date, Arizona has administered only about one-half of its delivered doses.
Forecast reports to date, available as PDFs
Download PDF to view additional charts of Arizona counties, available in appendix of report.
2020 Reports
Based on what we know now about this pandemic, we support guidelines for social distancing to slow the spread of the virus and urge everyone to follow the recommendations provided by the Centers for Disease Control and Prevention (CDC) to protect yourself, your family, your neighbors, and your employees. Please heed the recommendations as provided by the CDC, found at the following website: https://www.cdc.gov/coronavirus/2019-ncov/prepare/prevention.html
COVID covid coronavirus virus covid19 corona forecast model