
Weekly Arizona COVID-19 Data Report – Dr. Joe Gerald, July 13 Mid-Summer Update
Note this forecast page is not the most recent forecast available.
View the most current forecast report
Researcher Analyzes Arizona COVID-19 Spread Models for Decision-Makers
The following information regarding the spread of COVID-19 in Arizona was prepared by Joe Gerald, MD, PhD, a researcher at the Mel and Enid Zuckerman College of Public Health (MEZCOPH) at the University of Arizona. This information has also been reviewed by other MEZCOPH faculty.
This data were obtained from the Arizona Department of Health Services COVID-19 webpage and reflect conditions in Arizona as of July 8, 2021.
This information is intended to help guide our response to the outbreak. It is not intended to predict how this pandemic will evolve. Rather, this model extrapolates what might occur if current conditions remain unchanged. As regional authorities and healthcare providers respond, their actions are expected to mitigate the worst consequences of this pandemic.

COVID-19 Disease Outbreak Forecast
Arizona State and Pima County
Mid-Summer Update July 13, 2021
Disclaimer: This information represents my personal views and not those of The University of Arizona, the Zuckerman College of Public Health, or any other government entity. Any opinions, forecasts, or recommendations should be considered in conjunction with other corroborating and conflicting data. Updates can be accessed at https://publichealth.arizona.edu/news/2021/covid-19-forecast-model.
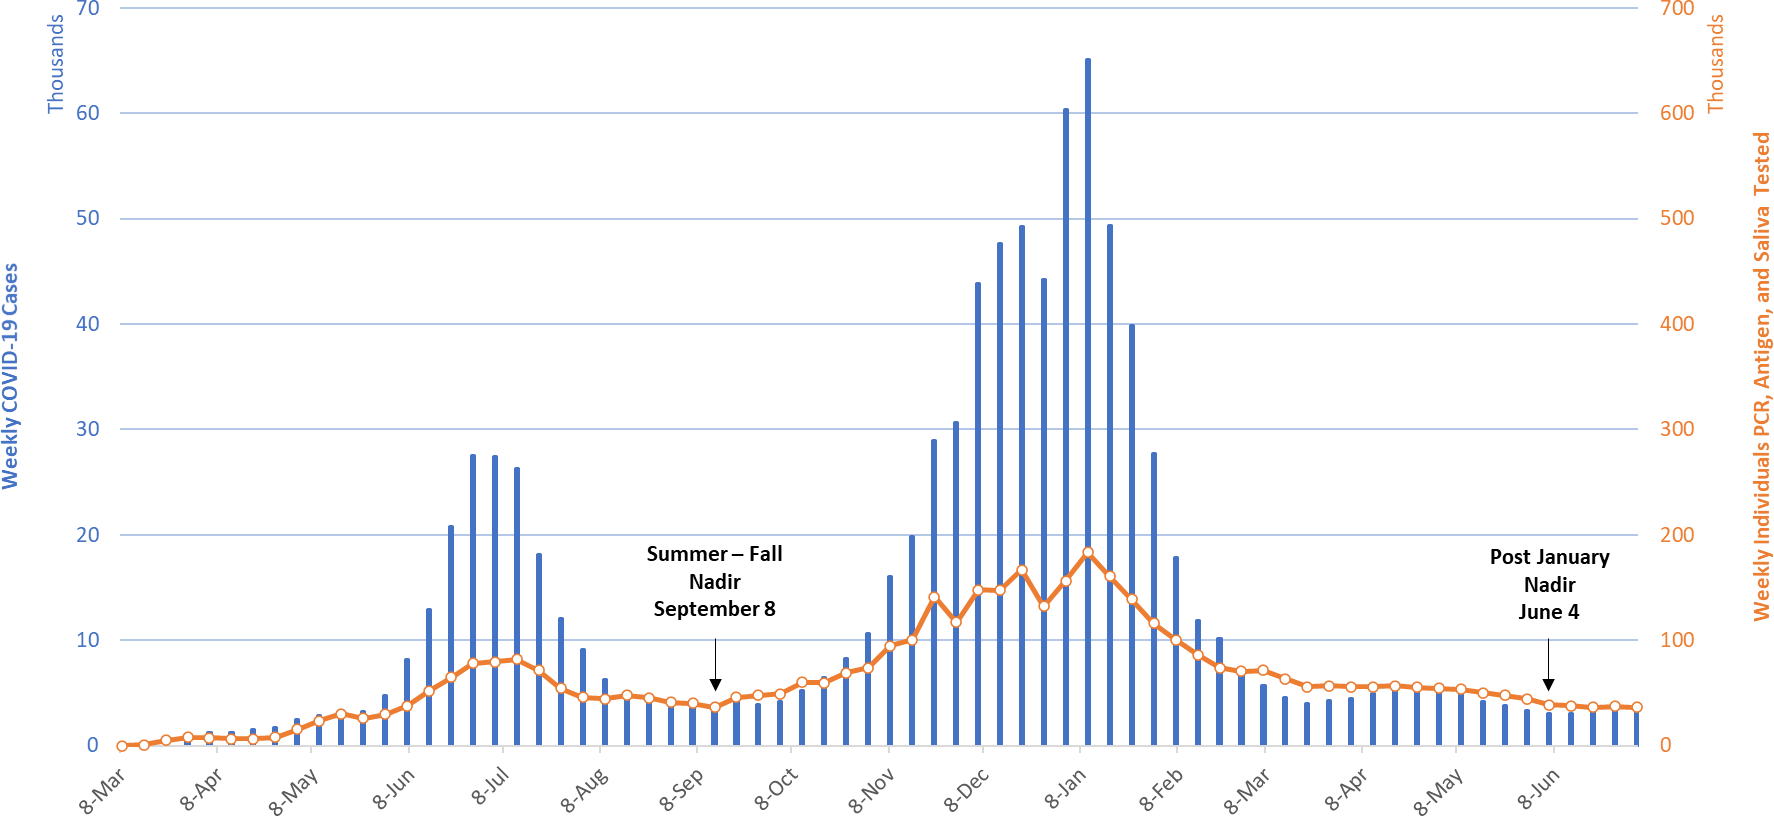
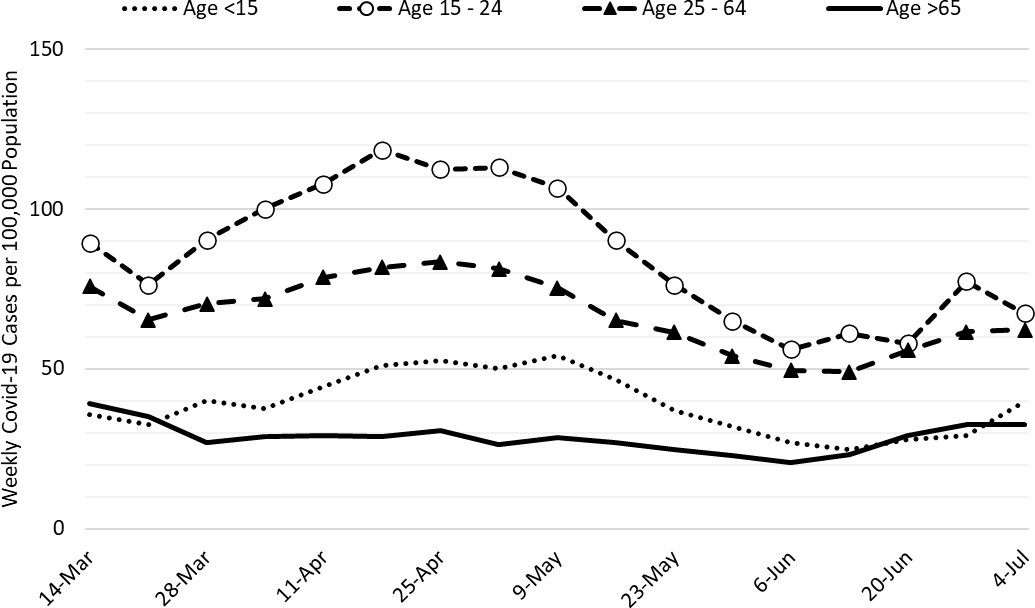
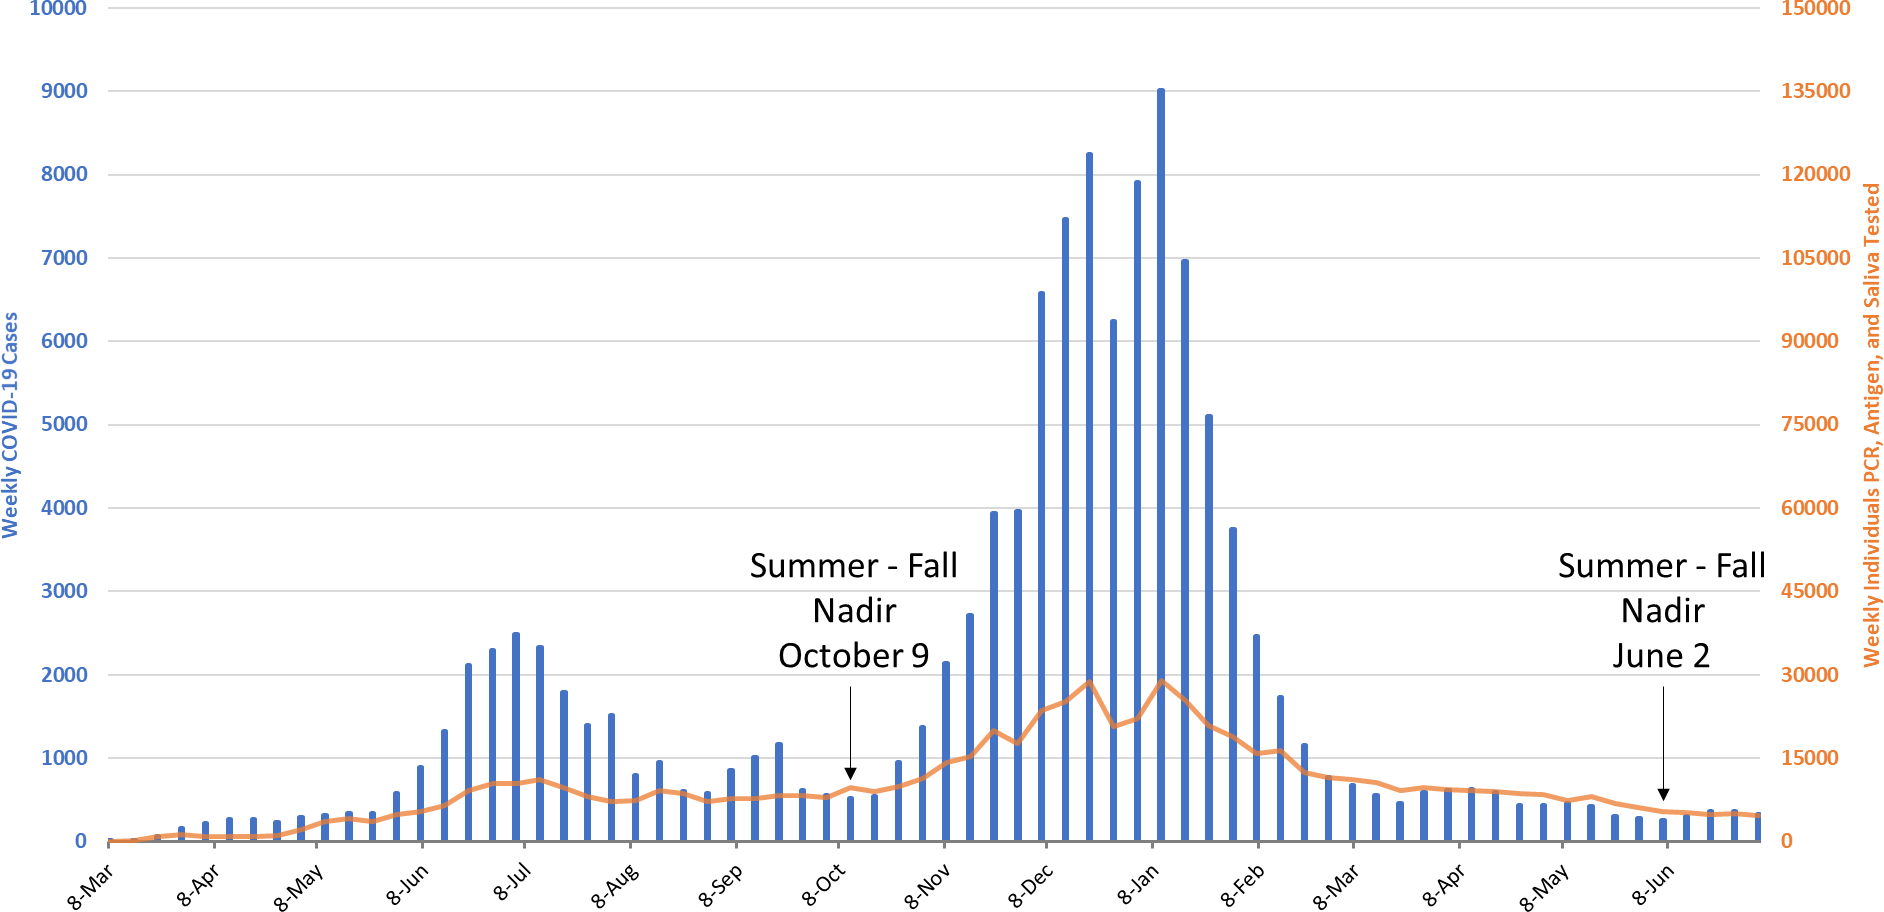
For the week ending July 4th, 3842 Arizonans were diagnosed with COVID-19, a 3% increase from last week’s initial tally of 3735 cases (Figure 1). This marks the 4th consecutive week of increases. The current case rate, 53 per 100K residents per week, is increasing by 5 - 10 cases per 100K residents per week. For historical reference, the lowest value recorded since January 2021 was 39 cases per 100K residents on June 4, 2021. Prior to that, the lowest value was 38 cases per 100K residents per week on September 8, 2020. Current rates are twice as high among those 15 – 24 years of age as compared to those ≥65 years of age, 67 versus 33 cases per 100K residents per week (Figure 2).
|
Figure 1. Newly Diagnosed Covid-19 Cases in Arizona and Number of Individuals Undergoing Covid-19 Diagnostic Testing March 1, 2020 through July 4, 2021. |
For the remainder of July and perhaps into August, case rates will remain at or above the 50 cases per 100K residents per week threshold differentiating substantial and moderate levels of transmission. Even so, another large surge remains unlikely because of moderate levels of vaccination supplemented by additional natural immunity from past infection.
According to the CDC, 54% of Arizona’s adult population is fully vaccinated and another 8% have received one dose. With 74% of its ≥65 population fully vaccinated, Arizona ranks 10th worst among the 50 states. However, 12% of Arizona’s population has tested positive for COVID-19 disease making Arizona the state with the 6th highest level of natural immunity. Until higher levels of total immunity are achieved, moderate to substantial levels of community transmission will persist; and, the unvaccinated and partially vaccinated will remain at risk of developing severe COVID-19 disease.
Note: Data for this report was updated Thursday, July 8.
|
Figure 2. Newly Diagnosed Covid-19 Cases in Arizona by Age Group March 7 – July 4, 2021. |
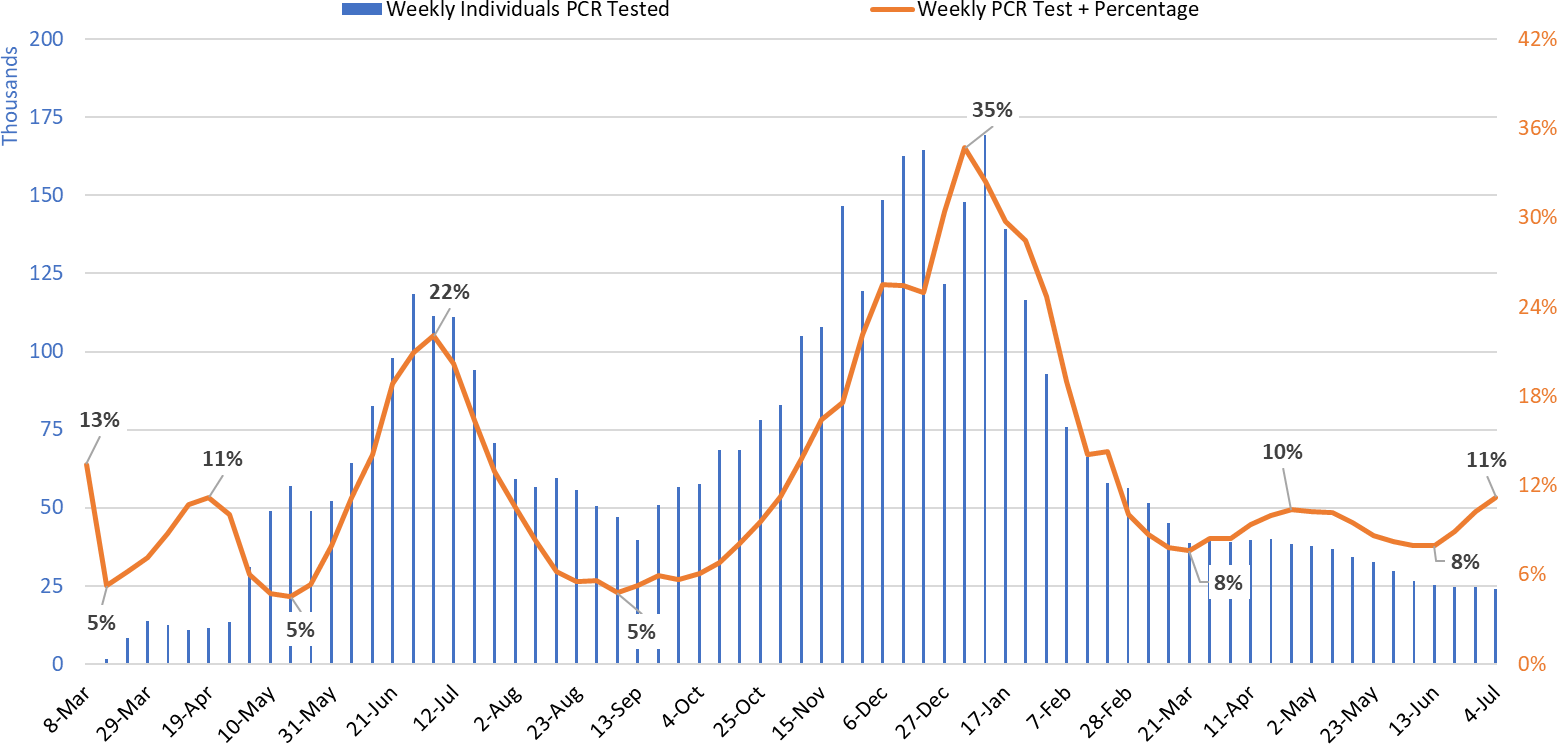
Test positivity among those undergoing traditional nasopharyngeal PCR testing is 11%, just above the 5 – 10% window for optimal public health practice (Figure 3).
|
Figure 3. Weekly Number Patients Undergoing Traditional Nasopharyngeal PCR Testing and Associated Percent Positivity March 1, 2020 – July 4, 2021. |
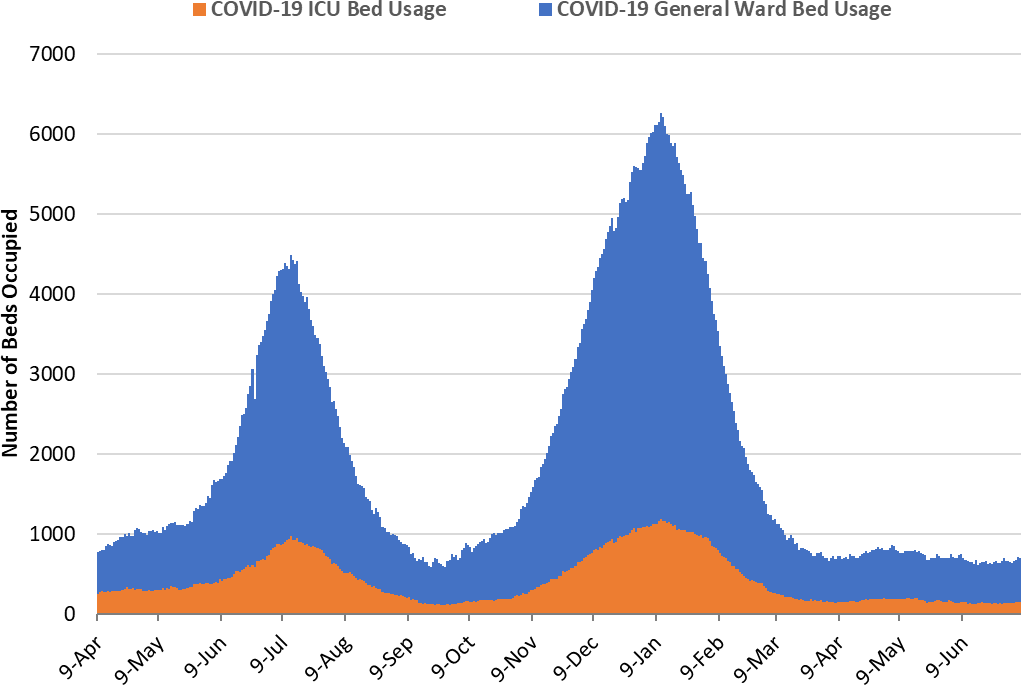
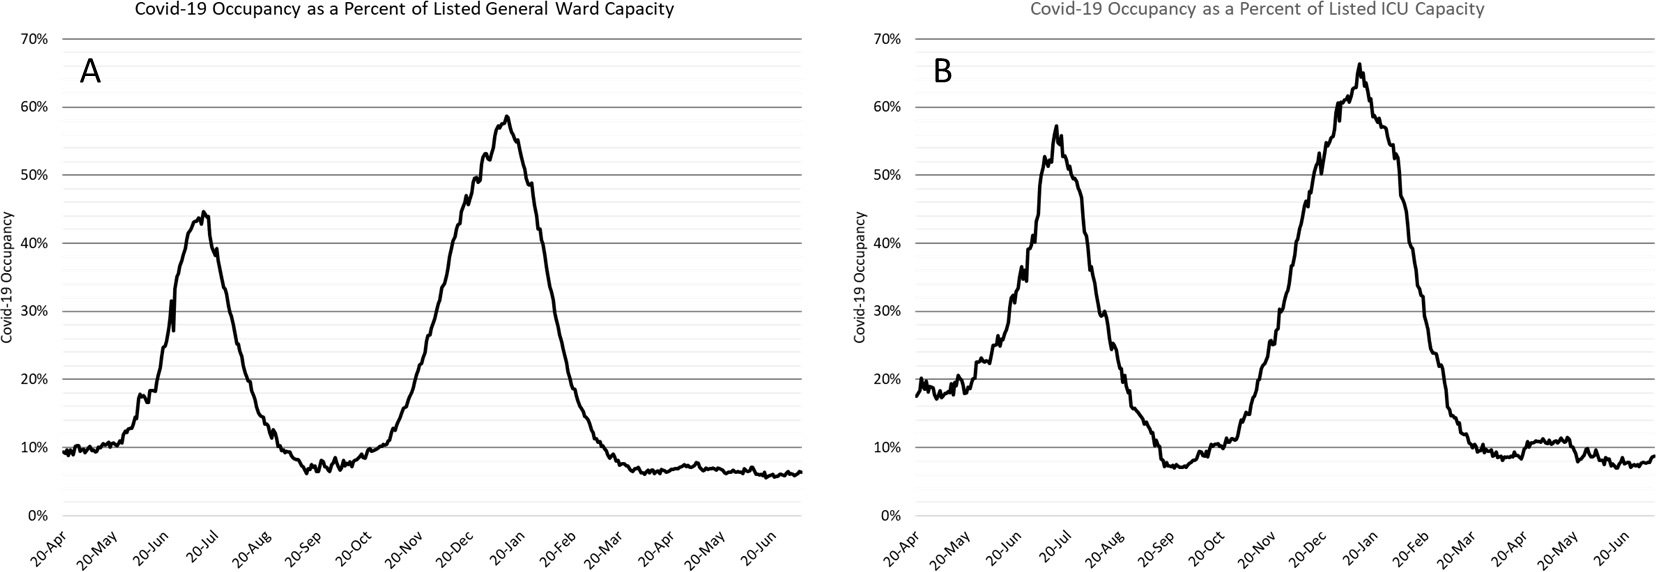
As of July 7th, 548 (7%) of Arizona’s 8648 general ward beds were occupied by Covid-19 patients, a 4% increase from the previous week’s 527 occupied beds (Figure 4 and Figure 5 Panel A). Another 1047 (12%) beds remained available for use. The number of available beds is higher than the previous week’s 928 beds.
The summer 2020 nadir was 468 occupied beds on September 27, 2020. So far, the summer 2021 nadir was 480 occupied beds on June 16.
|
Figure 4. Arizona Daily Covid-19 General Ward and ICU Census April 9, 2020 – July 7, 2021. |
As of July 7th, 152 (10%) of Arizona’s 1735 ICU beds were occupied with Covid-19 patients, a 12% increase from the prior week’s count of 136 patients (Figure 4 and Figure 5 Panel B). An additional 246 (14%) ICU beds remained available for use. This is similar to the prior week’s 241 available beds. The summer 2020 nadir was 114 occupied beds on September 22, 2020. So far, the summer 2021 nadir was 140 beds on June 15th.
|
Figure 5. Covid-19 Occupancy as a Percent of Listed General Ward (A, left) and ICU (B, right) Capacity in Arizona April 20, 2020 – July 7, 2021. |
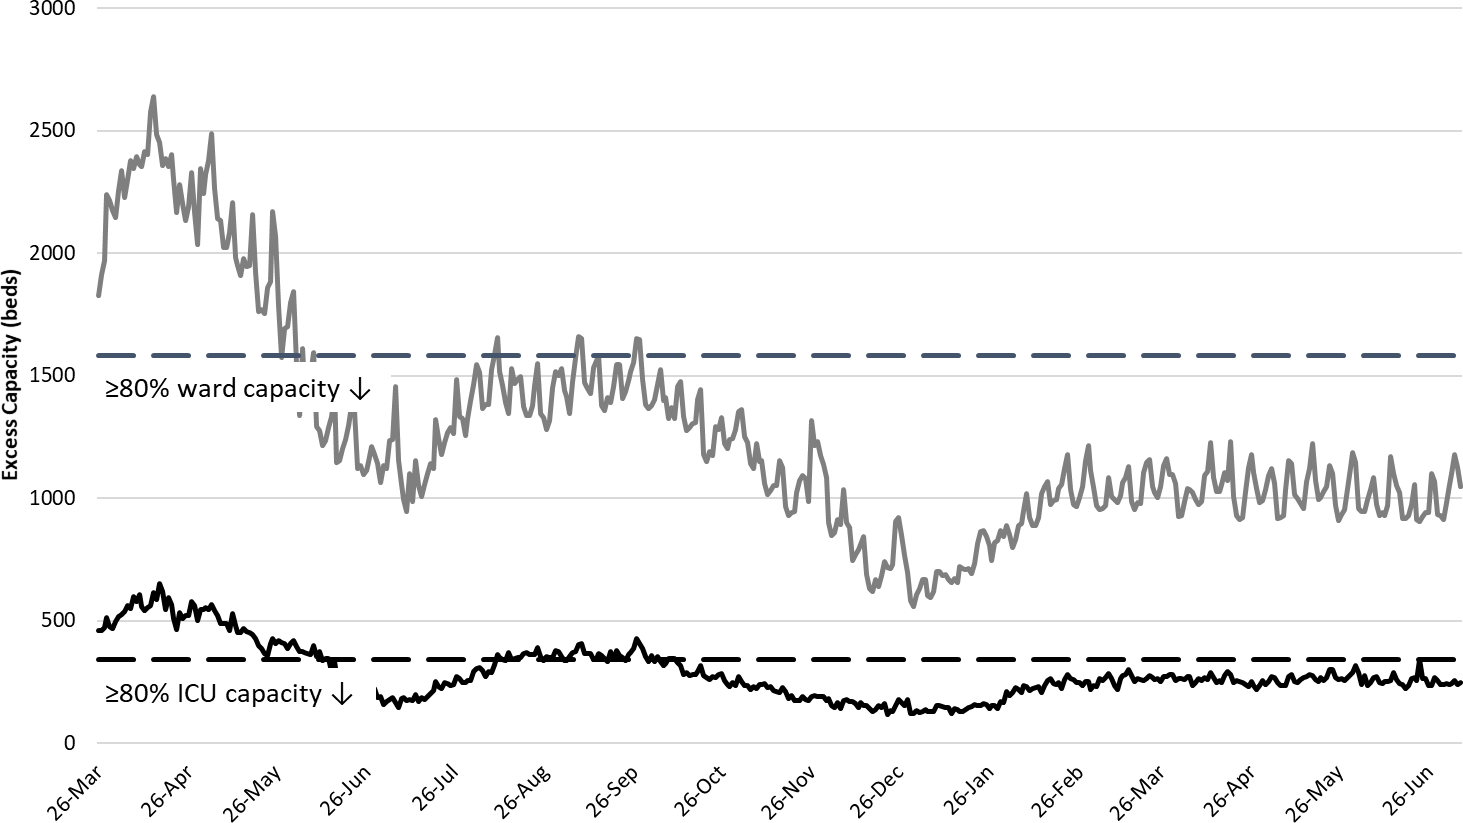
Arizona hospital occupancy remains above seasonal levels. Improvements in ward and ICU occupancy remain stalled at ≥85% occupancy (Figure 6). Undoubtedly, some medically necessary procedures that were previously postponed are still being rescheduled to address the backlog of care. Occupancy will need to fall 70-75% before conditions will be back to “normal.” However, hospitals should be prepared for a “new normal” with 5-10% higher inpatient activity due to COVID-19 for the foreseeable future as viral transmission remains in the moderate-substantial range.
|
Figure 6. Observed Excess Non-Surge General Ward and ICU Capacity March 26, 2020 – July 7, 2021. |
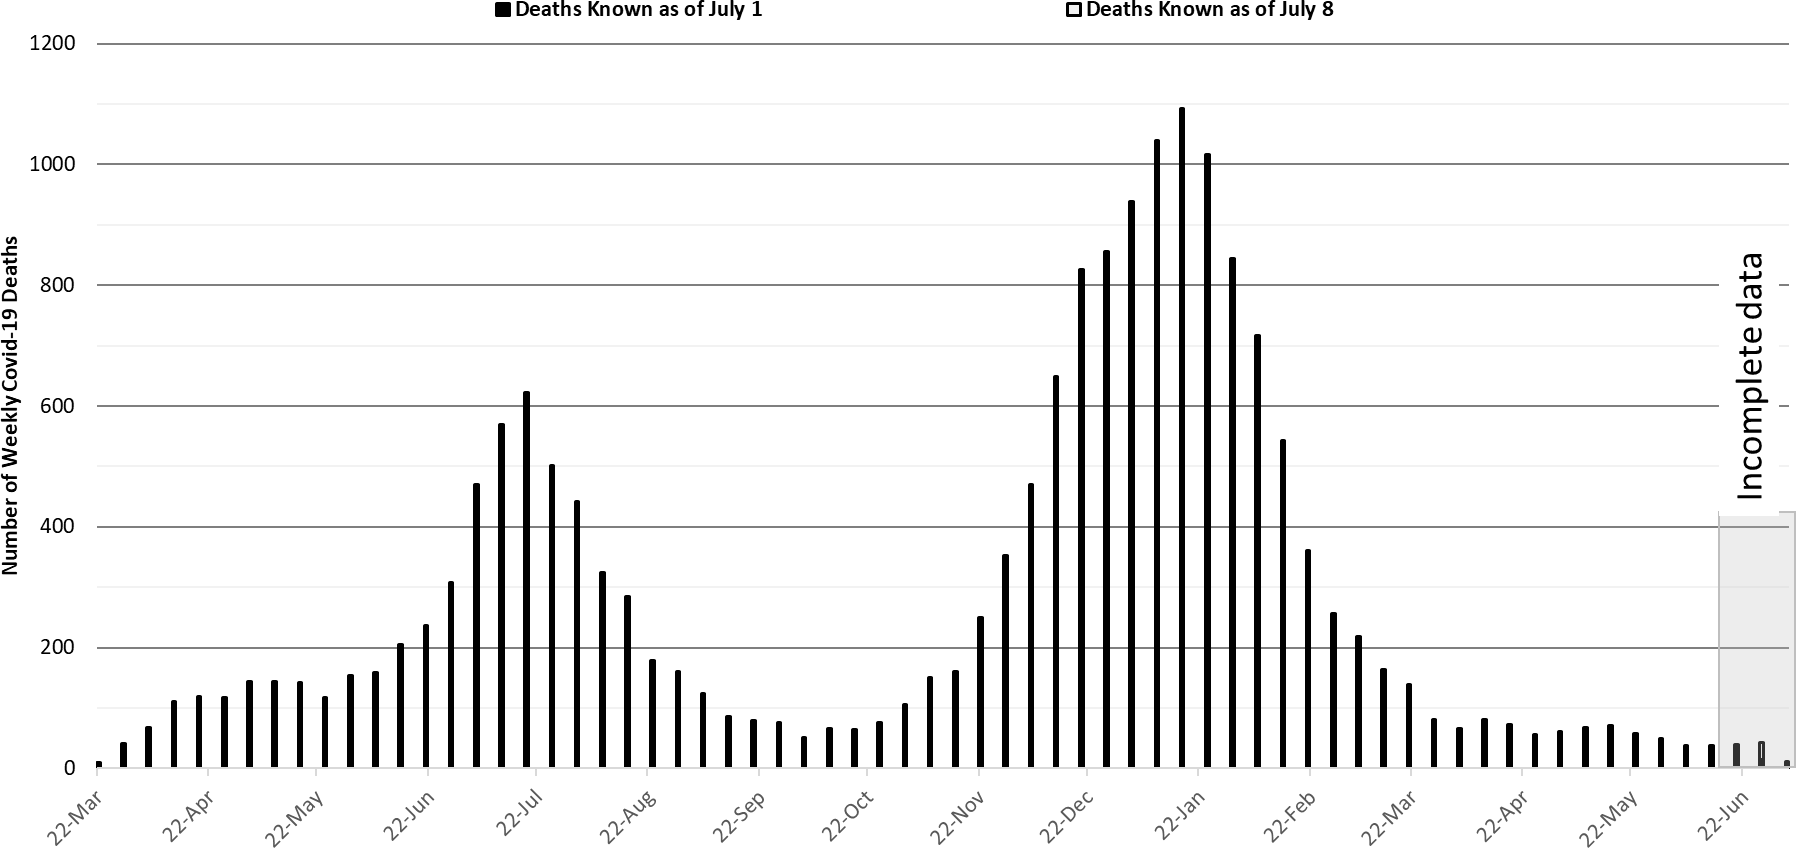
The week ending January 17, 2021 remains Arizona’s deadliest with 1093 deaths (Figure 7). Arizona will continue to record 40 - 50 deaths per week for the foreseeable future unless case rates change faster than anticipated.
|
Figure 7. Weekly Arizona Covid-19 Deaths March 16, 2020 – July 4, 2021. |
Pima County Outlook
For the week ending July 4th, 335 Pima County residents were diagnosed with Covid-19 (Figure 8). This is a 4% decrease from the 349 cases initially reported last week.
|
Figure 8. Covid-19 Cases and Individuals Undergoing Testing in Pima County Mar 1, 2020 – July 4, 2021. |
New cases are being diagnosed at a rate of 33 cases per 100K residents per week, much lower than the state average. October 9th marked the summer 2020 nadir at 46 cases per 100K residents per week. So far, the summer 2021 nadir was 24 cases per 100K residents per week on June 2, 2021. Trends across the various age groups appear in Figure 9.
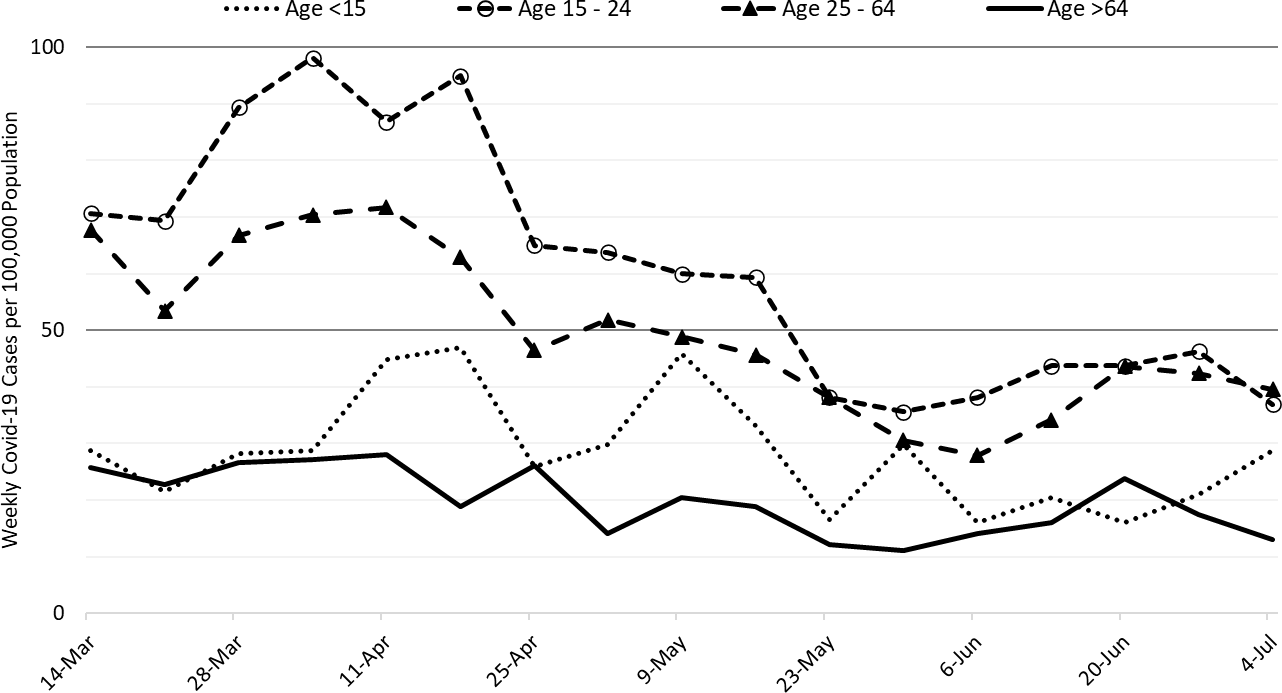
|
Figure 9. Covid-19 Cases by Age Group in Pima County from March 14 – July 4, 2021. |
Summary
- Except for small oscillations around 50 cases per 100K residents per week, viral transmission has not changed much since April of this year. Moderate levels of transmission are expected through the summer. Continued normalization of behaviors along with more transmissible variants (e.g., delta) will be mostly balanced by immunity from vaccination and recovery from past infection.
- As of July 7th, new cases were being diagnosed at a rate of 56 cases per 100,000 residents per week. Over the next several weeks, rates can be expected to change relatively slowly, +/- 5 - 10 cases per 100,000 residents per week, as we continue to hover around Rt values of 1.
- The emergence of another large wave of cases and hospitalizations seems unlikely despite the increasing prevalence of the Delta variant. While Arizona has not achieved herd immunity, total immunity is high enough to prevent a repeat of the past two outbreaks. However, unvaccinated, partially vaccinated, and immunocompromised individuals will remain at risk of severe infection as community transmission is expected to persist at moderate levels.
- Vaccination remains the most important public health priority to reduce viral transmission among everyone and severe illness among those at greatest risk.
- While not expected, mask mandates would lead to faster disease reduction by decreasing transmission in public settings. In retrospect, mask mandates should have been tied to population case rates (e.g., 10 cases per 100K residents per week) or some population vaccination goal (e.g., 80% fully vaccinated) instead of being lifted based on risk of infection to the individual. This was, and continues to be, a significant policy failure/error at the state and federal level.
- With inadequate vaccination uptake, eliminating COVID-19 is no longer a plausible public health policy goal. COVID-19 is almost certain to become an endemic disease with varying temporal and geographic implications. Fortunately, vaccination will remain a viable disease control strategy offering a high degree of protection to those willing to accept them.
- Hospital COVID-19 occupancy is holding steady in the ward and ICU at 5 – 10% of occupancy. Access to care remains somewhat restricted as overall occupancy remains unseasonably high at 85%.
- Arizona Covid-19 fatality counts are now 50 deaths per week should remain below that level unless case rates meaningfully increase.
- According to the CDC, 54% of Arizona adults have received at least 2-doses of vaccine while another 8% have received 1-dose. Arizona passed peak vaccination rates in early April and these rates continue to erode. We are unlikely to achieve 70+% vaccination of our eligible population and should be prepared to adjust to COVID-19 as persistent risk.
- Despite evidence of limited immune escape to the Delta variant, especially before completion of the full vaccination sequence, vaccination continues to provide extraordinarily high levels of protection from infection and severe illness.
Forecast reports to date, available as PDFs
Download PDF to view additional charts of Arizona counties, available in appendix of report.
July 13 |
2020 Reports
Based on what we know now about this pandemic, we support guidelines for social distancing to slow the spread of the virus and urge everyone to follow the recommendations provided by the Centers for Disease Control and Prevention (CDC) to protect yourself, your family, your neighbors, and your employees. Please heed the recommendations as provided by the CDC, found at the following website: https://www.cdc.gov/coronavirus/2019-ncov/prepare/prevention.html
COVID covid coronavirus virus covid19 corona forecast model