
Weekly Arizona COVID-19 Data Report – Dr. Joe Gerald, October 1
Note this forecast page is not the most recent forecast available.
View the most current forecast report
Researcher Analyzes Arizona COVID-19 Spread Models for Decision-Makers
The following information regarding the spread of COVID-19 in Arizona was prepared by Joe Gerald, MD, PhD, a researcher at the Mel and Enid Zuckerman College of Public Health (MEZCOPH) at the University of Arizona. This information has also been reviewed by other MEZCOPH faculty.
This data were obtained from the Arizona Department of Health Services COVID-19 webpage and reflect conditions in Arizona as of October 1, 2021.
This information is intended to help guide our response to the outbreak. It is not intended to predict how this pandemic will evolve. Rather, this model extrapolates what might occur if current conditions remain unchanged. As regional authorities and healthcare providers respond, their actions are expected to mitigate the worst consequences of this pandemic.

COVID-19 Disease Outbreak Forecast
Arizona State and Pima County
Updated October 1, 2021
Disclaimer: This information represents my personal views and not those of The University of Arizona, the Zuckerman College of Public Health, or any other government entity. Any opinions, forecasts, or recommendations should be considered in conjunction with other corroborating and conflicting data. Updates can be accessed at https://publichealth.arizona.edu/news/2021/covid-19-forecast-model.
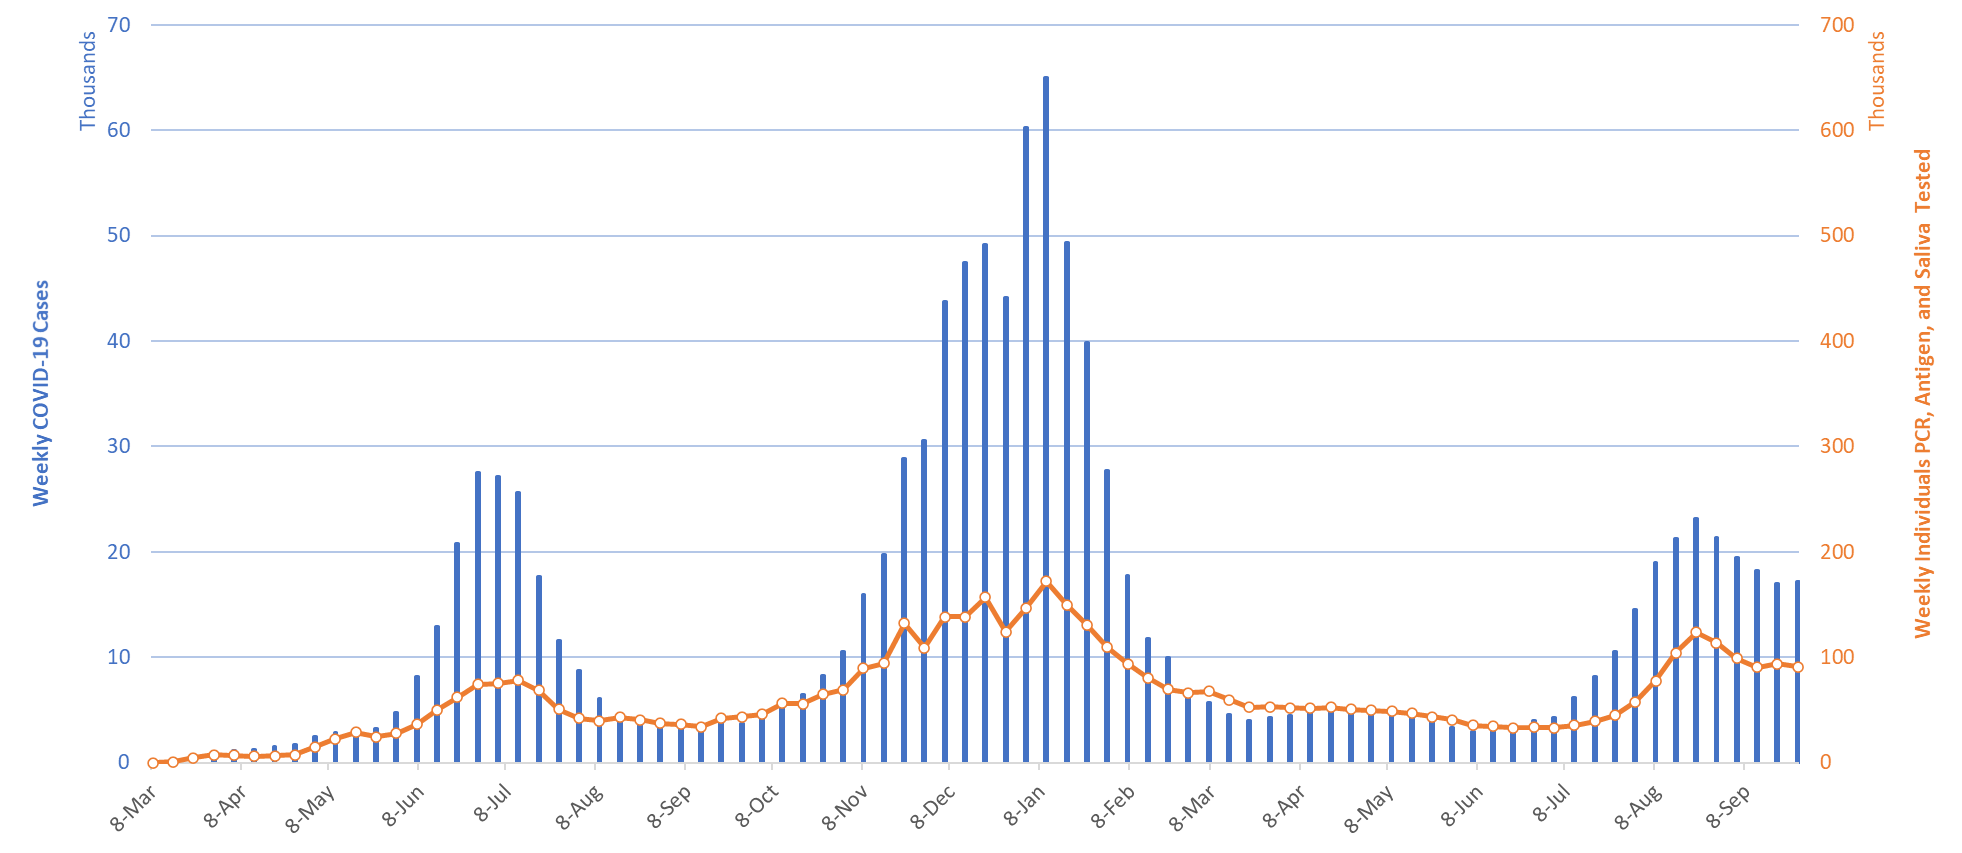
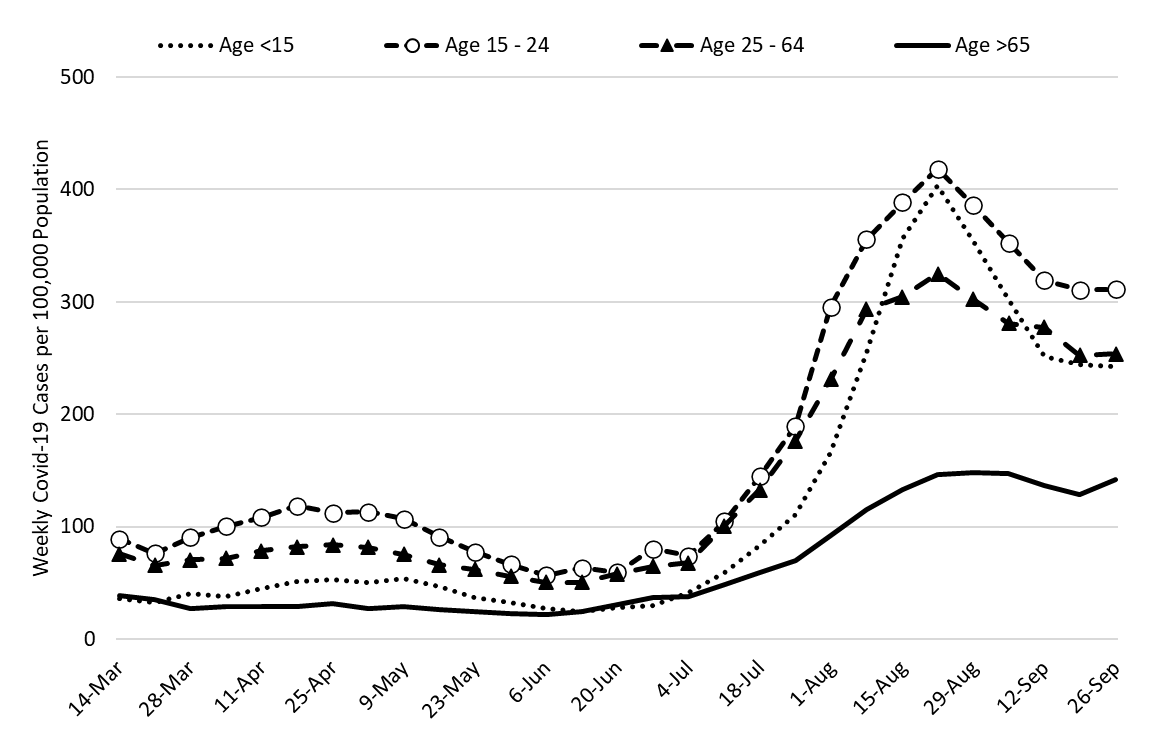
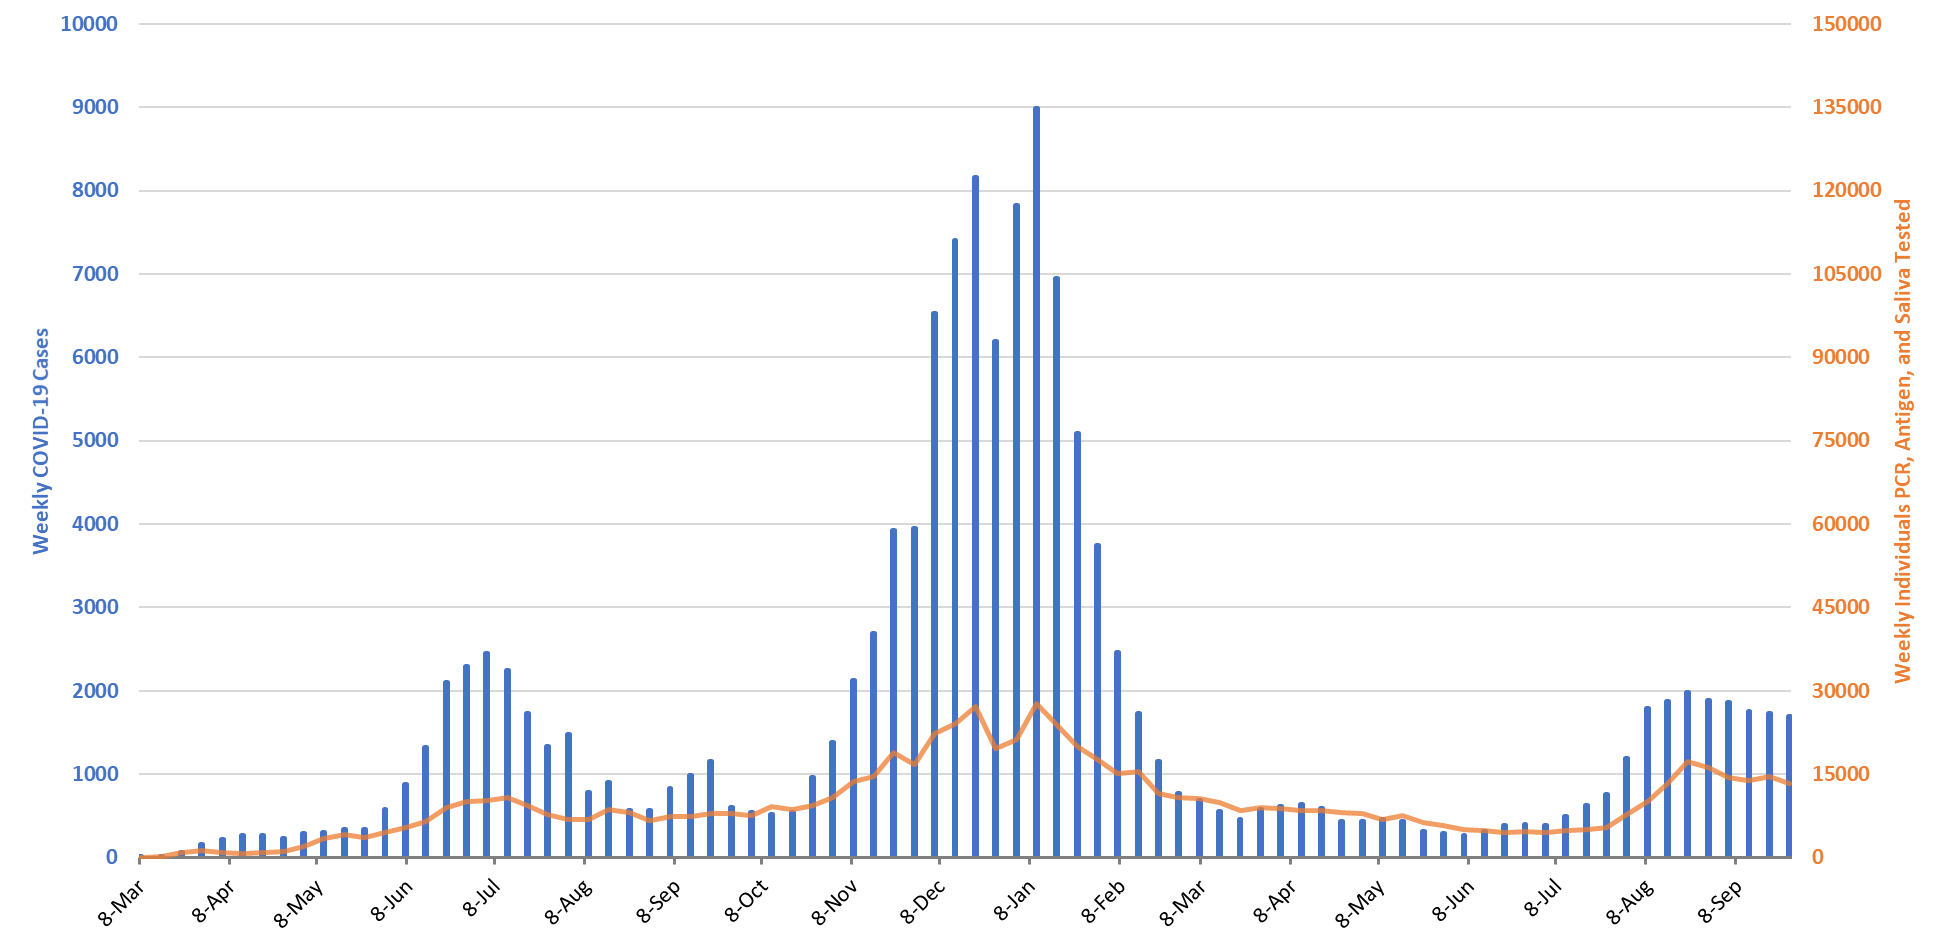
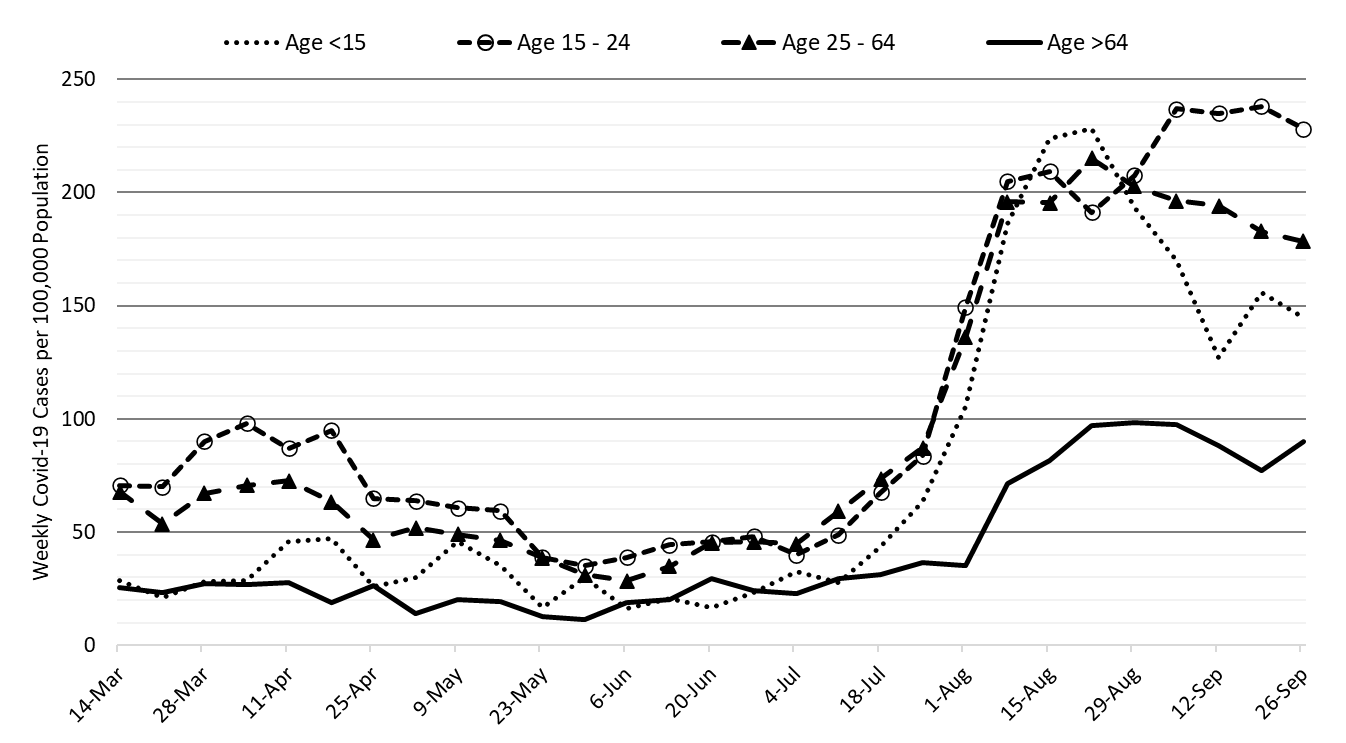
For the week ending September 26th, 17229 Arizonans were diagnosed with COVID-19, a 4% increase from last week’s initial tally of 16624 cases (Figure 1). The current rate, 237 cases per 100K residents per week, is increasing by 3 cases per 100K residents per week. Case rates remain highest among those 15 – 24 years and lowest among those >65 years, 311 versus 142 cases per 100K residents, respectively (Figure 2a bellow).
|
Figure 1. Weekly COVID-19 Cases in Arizona and Number of Individuals Undergoing COVID-19 Diagnostic Testing March 1, 2020 – September 26, 2021. |
Arizona continues to experience a high number of cases, hospitalizations, and deaths with conditions deteriorating in the short-term. The state continues to feed the remaining susceptible population into the COVID-19 grinder with no end in sight. With waning vaccine efficacy and a potentially short duration of acquired immunity, there is little reason to believe the unvaccinated can evade infection with the considerably higher risk of severe outcome it entails. While vaccination would offer greater individual and community benefit, Merck announced preliminary, promising results of a new antiviral that could reduce hospitalization and deaths by half.
Arizona’s national ranking is 27thnd out of 50 states with the nation’s leaders being Alaska (1157), West Virginia (640), Montana (565), Wyoming (562), and North Dakota (559). According to the CDC, 62% of Arizona’s adult population is fully vaccinated and another 10% have received one dose. The ADHS Vaccine Dashboard shows weekly doses delivered are holding steady at about 70K doses per week. So far, there is no clear data on uptake of third shot Pfizer boosters.
In a major development, an Arizona judge ruled that the legislature’s ban of mask mandates in K – 12 schools was unconstitutional. Arizona’s Supreme Court refused to approve a request to allow the legislation to take effect but did agree to directly consider the Legislature’s appeal. For now, K – 12 schools can continue to require students to wear face masks with a ruling from the Supreme Court expected as early as mid-November.
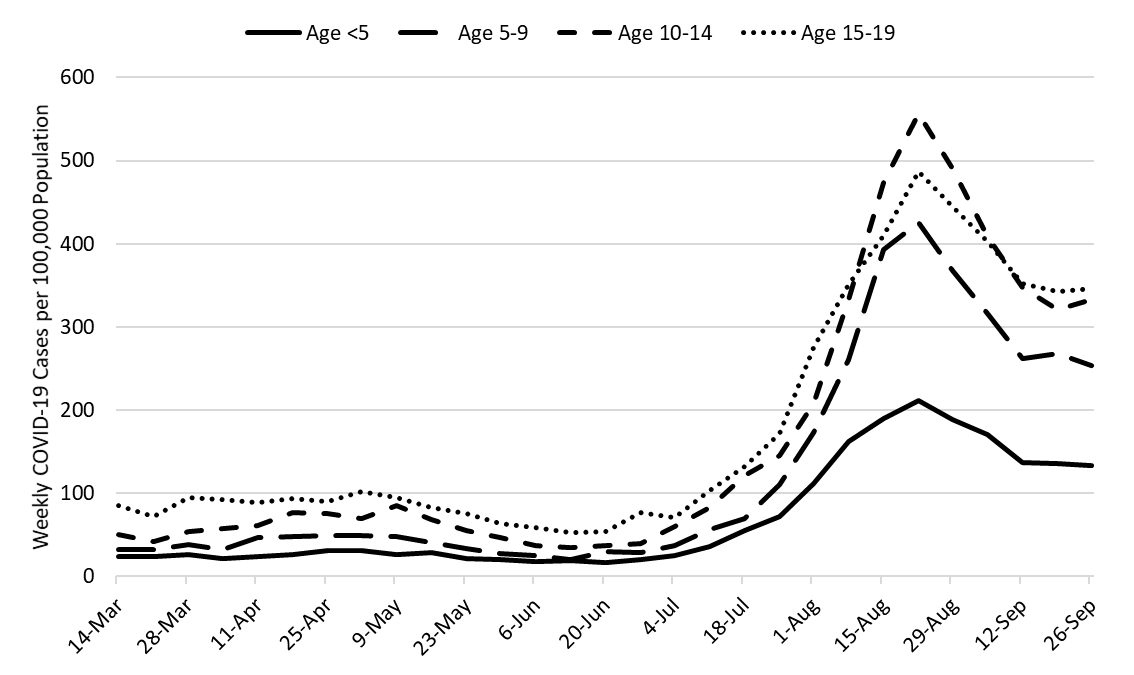
Figure 2a shows at least a temporary disruption in improvements among all age groups. Strong evidence supporting the effectiveness of K – 12 mask mandates was recently provided by ASU, MCDPH, and PCHD researchers. Arizona schools without a mask mandate have 3.5 times the odds of having a school outbreak (95%CI 1.8 – 6.9). These data are supported by similar conclusions from an analysis of county-level data in the US. Mask mandates are one important piece of a multi-dimensional response to slow transmission among school-age children 5 – 19 years (Figure 2b).
|
Figure 2a. COVID-19 Cases in Arizona by Age Group March 7 – September 26, 2021. |
|
Figure 2b. COVID-19 Cases in Arizona among Children by Age Group March 7 – September 26, 2021. |
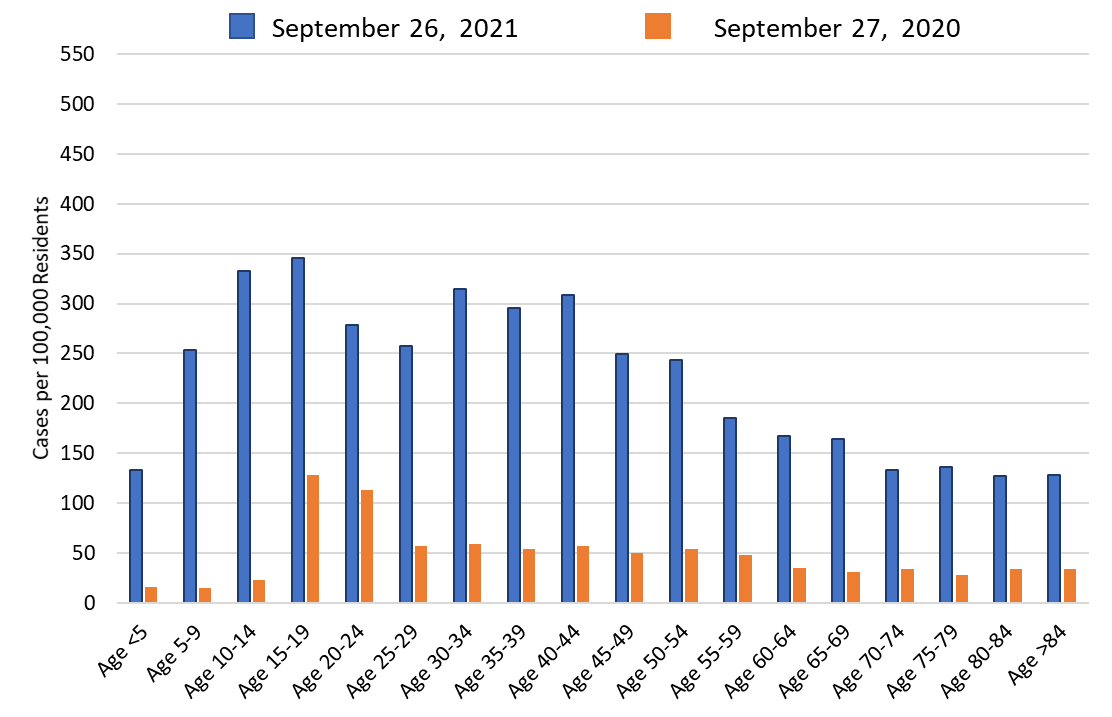
Comparing school reopening this year (in-person) with last year (virtual), levels of community transmission are much higher this year than last, particularly among those 15 years (Figure 2c). Higher transmission among those 15 – 24 years associated with university re-openings was beginning to wane this time last year (orange bars, ages 15 – 24). Campus outbreaks are less of an issue this year; this conclusion is supported by data reported on the UA COVID-19 Dashboard which indicates declining cases on campus.
|
Figure 2c. COVID-19 Cases in Arizona by Age Group Week Ending September 27, 2020 versus September 26, 2021. |
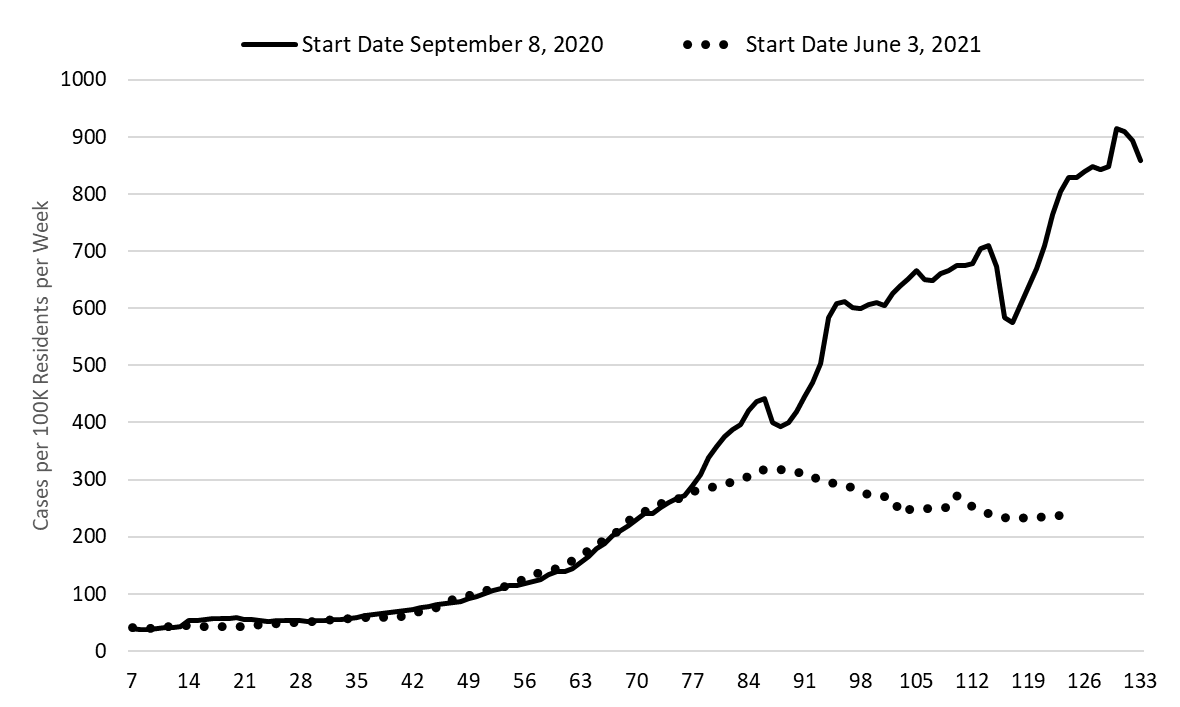
Over the 6 weeks, the trajectory of the current outbreak and that of the winter 2020/2021 outbreak have meaningfully diverged (Figure 2d). We are now experiencing a more permanent shift away from last year’s trajectory. Nevertheless, improvements from the peak are considerably slower this time than either of the last two peaks meaning the size (volume) of this wave could eventually exceed that of the summer 2020 wave.
|
Figure 2d. Fall 2020 and Fall 2021 COVID-19 Waves Superimposed (123 days). |
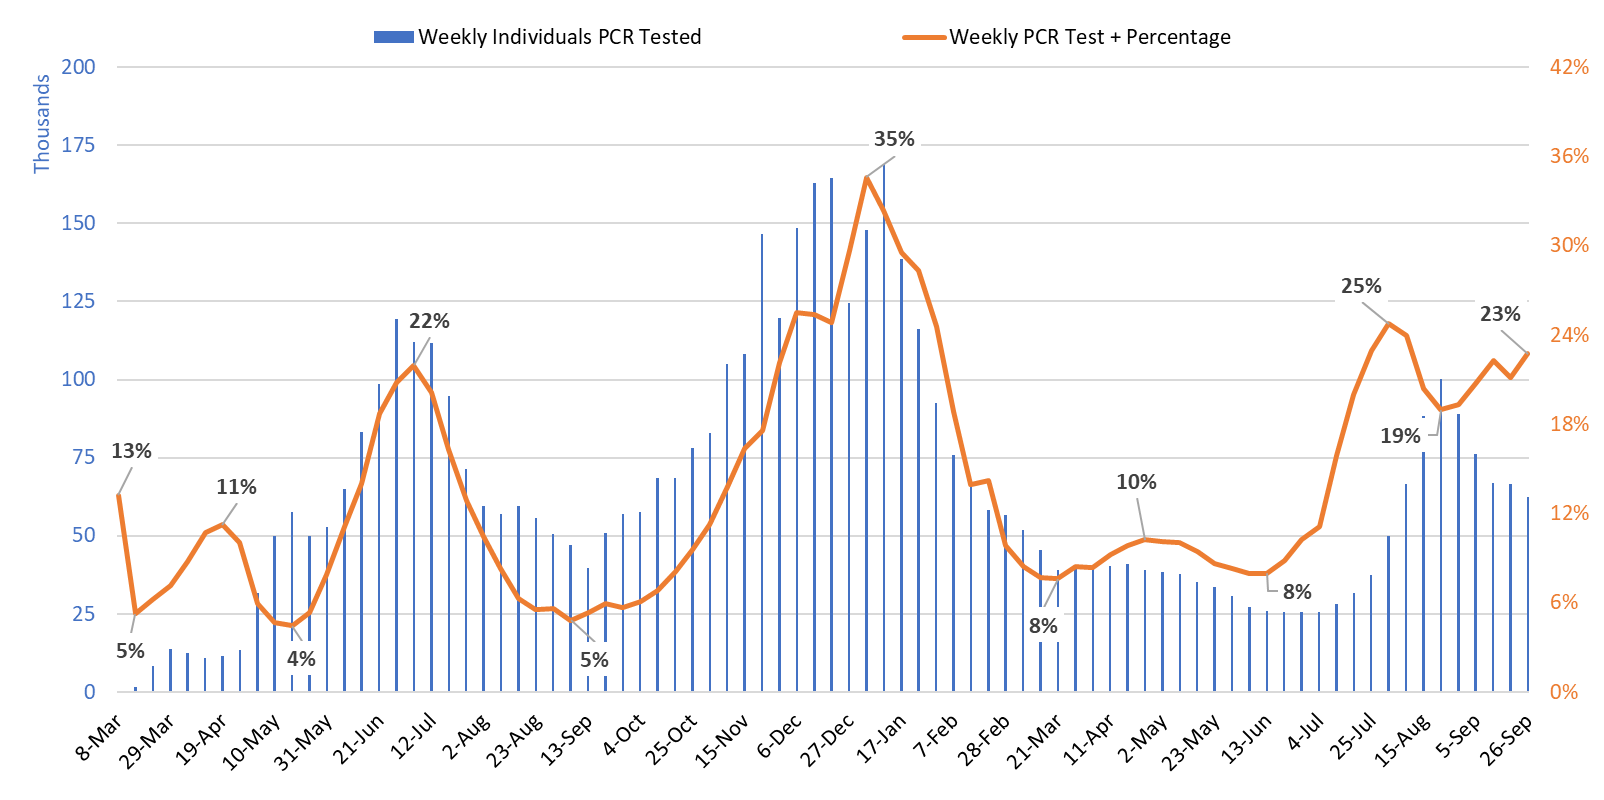
Test positivity continues to slowly rise, reaching 23% this week on a slightly smaller base of tests (Figure 3). Obviously, testing is woefully inadequate for public health practice and many cases are going undiagnosed. It is unclear how much of this traditional clinical testing is being supplanted by at-home testing. Even if at-home testing in increasing, test positivity in the clinical setting will remain an important barometer of COVID-19 as a cause of respiratory illness in the community.
|
Figure 3. Weekly Number of Patients Undergoing Traditional Nasopharyngeal PCR Testing and Associated Percent Positivity March 1, 2020 – September 26, 2021. |
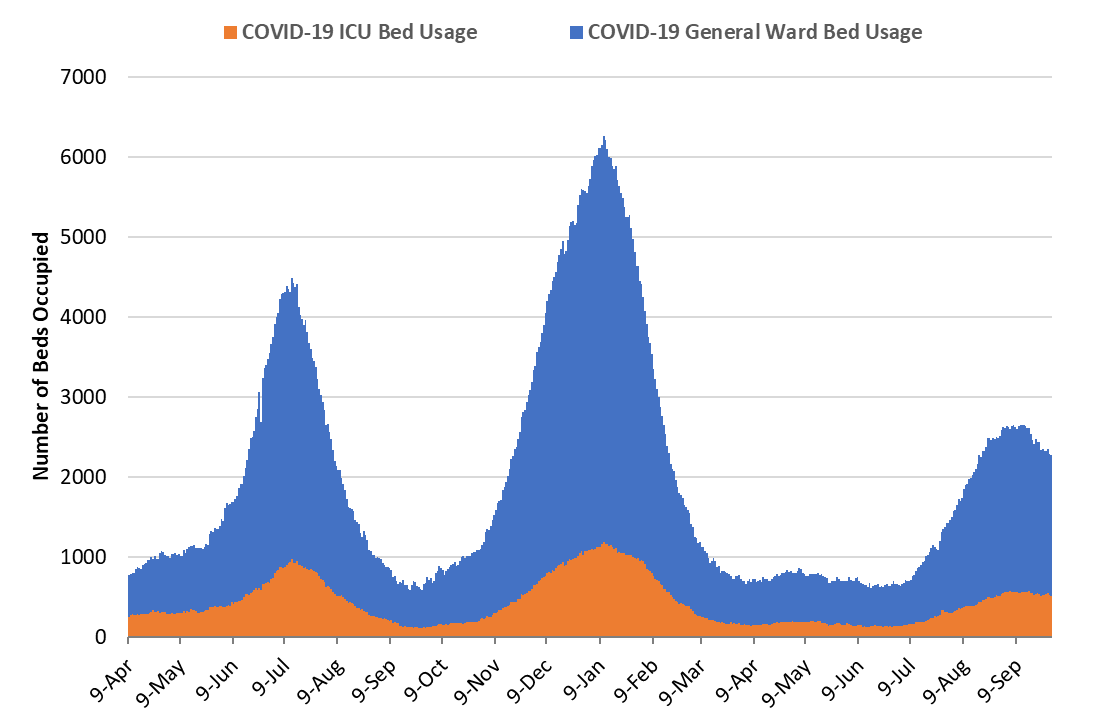
As of September 29th, 1768 (20%) of Arizona’s 8751 general ward beds were occupied by COVID-19 patients, a 7% decrease from last week’s 1893 occupied beds (Figure 4 and Figure 5 Panel A). Another 631 (7%) beds remained available for use. The number of available beds is fewer than last week’s 683 beds.
|
Figure 4. Arizona Daily COVID-19 General Ward and ICU Census April 9, 2020 – September 29, 2021. |
As of September 29th, 510 (29%) of Arizona’s 1760 ICU beds were occupied by COVID-19 patients, a 5% decrease from last week’s 539 occupied beds (Figure 4 and Figure 5 Panel B). An additional 138 (8%) ICU beds remained available for use, similar to last week’s 132 beds.
As a lagging indicator, hospital COVID-19 occupancy is now slowly declining in the general ward and ICU.
|
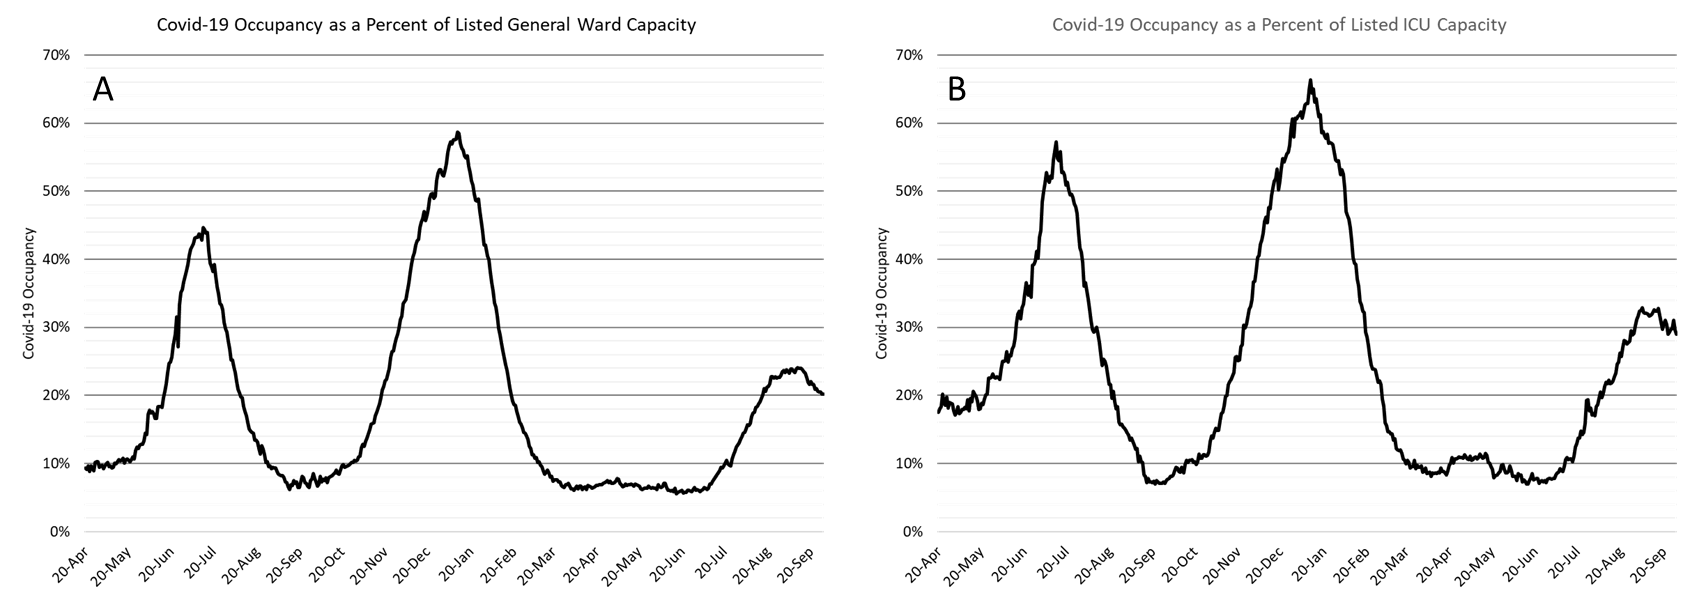
Figure 5. COVID-19 Occupancy as a Percent of Listed General Ward (A, left) and ICU (B, right) Capacity in Arizona April 20, 2020 – September 29, 2021. |
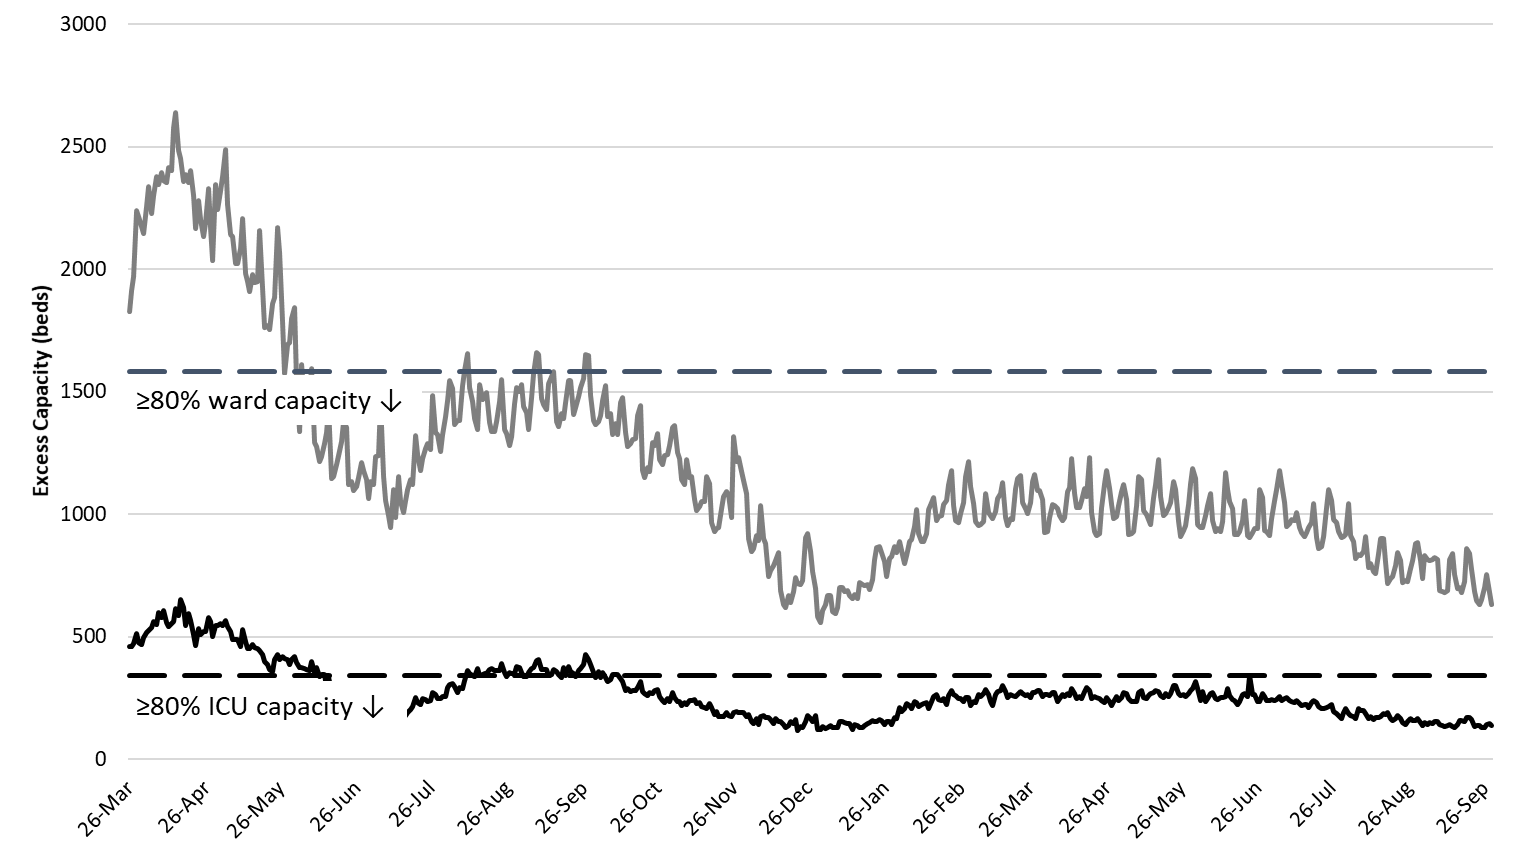
Arizona hospital occupancy remains above seasonal levels. Safety margins, as measured by excess available beds, remain quite low (Figure 6). Available excess capacity is nearly as low as it was at the worst of the winter 2020/2021 surge. Because occupancy is improving slowly in response to declining community transmission, hospitals should be prepared for >20% ward occupancy and >25% ICU occupancy for another week or two. Even if you are vaccinated, the tail of this COVID-19 surge will still impact your access to healthcare services should you become ill. Critical staffing shortages continue to plague inpatient and outpatient facilities. Accordingly, capacity is likely more constrained than these numbers reflect.
|
Figure 6. Observed Excess Non-Surge General Ward and ICU Capacity in Arizona March 26, 2020 – Sept 29, 2021. |
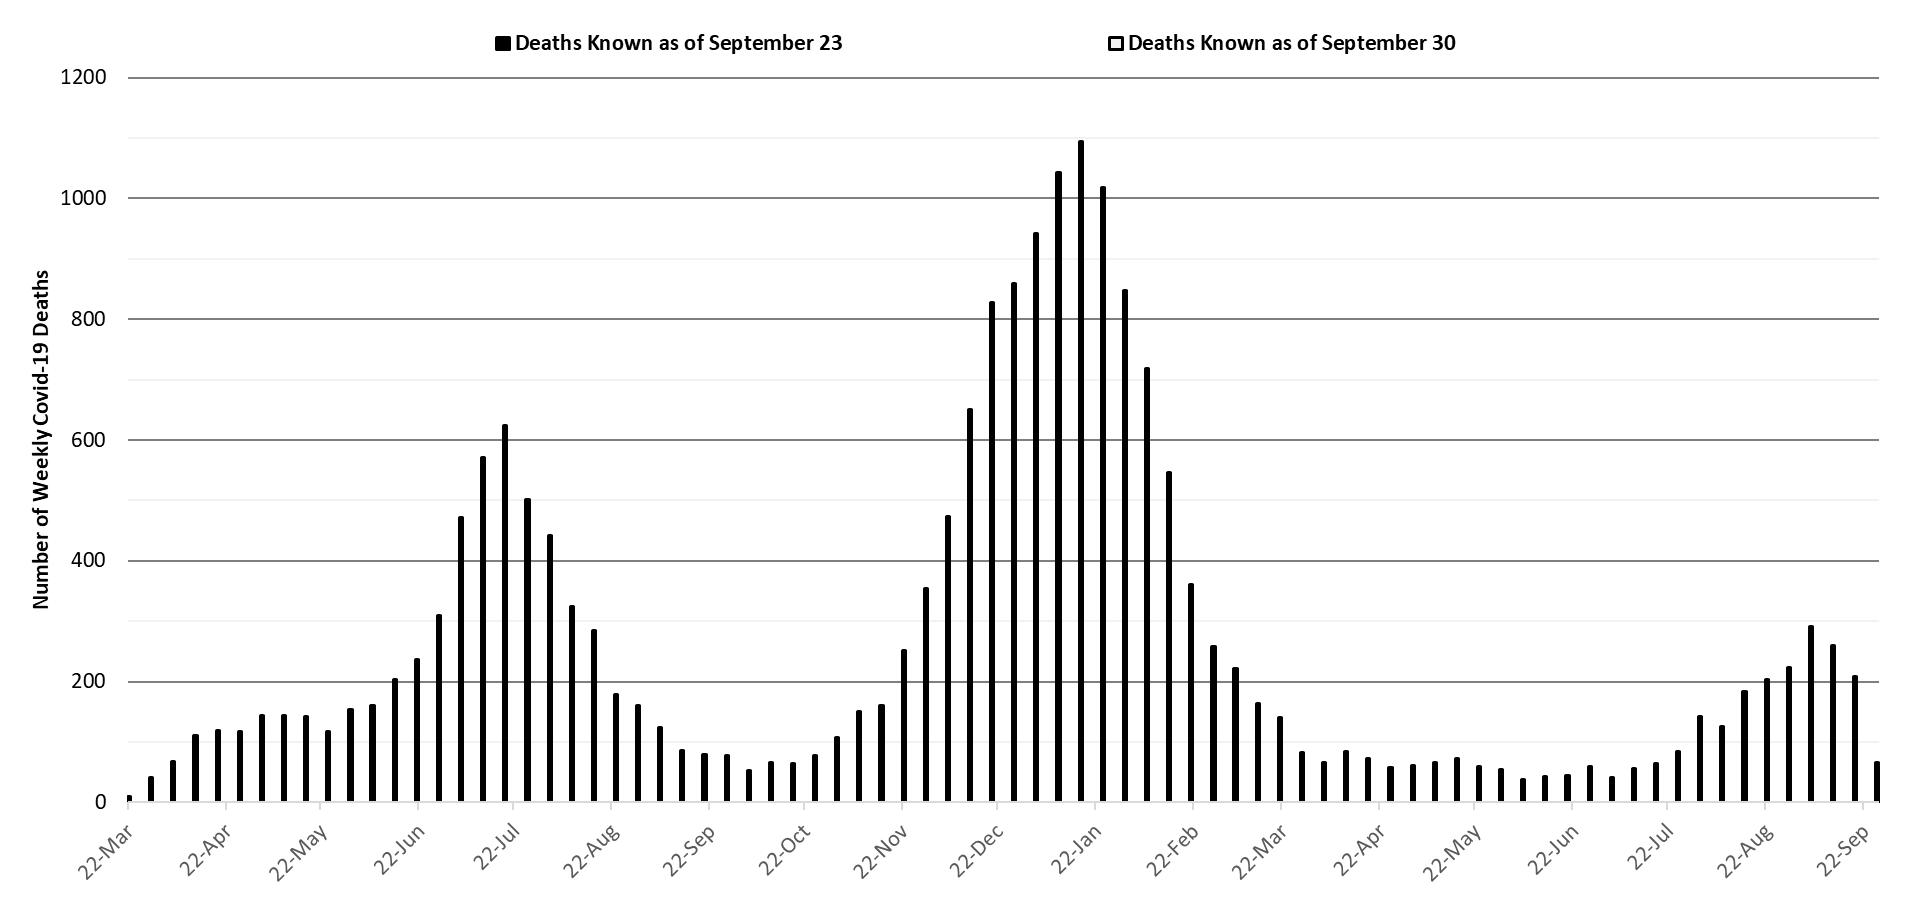
Arizona has experienced >200 COVID-19 deaths per week since August 22nd with the week ending September 5th has so far recorded 291 deaths (Figure 7). The week ending September 12th is close behind with 260 recorded deaths. It now almost certain that Arizona will reach 300 deaths per week for the weeks ending September 5th and/or the week ending September 12th with declines following soon thereafter.
|
Figure 7. Weekly Arizona COVID-19 Deaths March 16, 2020 – September 26, 2021. |
Pima County Outlook
For the week ending September 19th, 1701 Pima County residents were diagnosed with COVID-19 a 1% increase from last week’s initial tally (Figure 8).
|
Figure 8. Weekly COVID-19 Cases in Pima County and Number of Individuals Undergoing COVID-19 Diagnostic Testing March 1, 2020 – September 26, 2021. |
New cases are being diagnosed at a rate of 162 cases per 100K residents per week and is declining by 3 cases per 100K residents per week. Trends across the various age groups appear in Figure 9.
|
Figure 9. COVID-19 Cases in Pima County by Age Group March 7, 2020 – September 26, 2021. |
Summary
- Arizona continues to experience high levels of community transmission with case rates now clearly plateaued. Test positivity remains stubbornly high reminding us that test capacity, accessibility, and/or uptake is woefully inadequate to meet public health needs. Slowing improvements, particularly among older groups, serves as a warning that major behavioral shifts could result in future increases.
- As of September 26th, new cases were being diagnosed at a rate of 237 cases per 100K residents per week. The rate was increasing by 3 cases per 100K residents per week.
- With waning vaccine efficacy and a potentially short duration of acquired immunity, there is little reason to believe the unvaccinated can evade infection with the considerably higher risk of severe outcome it entails. https://www.thelancet.com/journals/lanmic/article/PIIS2666-5247(21)00219-6/fulltext. This trifecta means that persistently high levels of transmission, and more importantly hospitalizations, are possible for an extended time period until we’ve exhausted our supply of unvaccinated, previously uninfected adults.
- Importantly, schools may have to discontinue evidence-based mitigation practices (e.g., masking) on September 29th depending on an impending Supreme Court ruling https://www.usnews.com/news/best-states/arizona/articles/2021-10-01/arizona-high-court-to-consider-case-blocking-school-mask-ban.
- New data from ASU, MCDPH, and PCHD confirm mask mandates in schools work! https://www.cdc.gov/mmwr/volumes/70/wr/mm7039e1.htm?s_cid=mm7039e1_w.
- Other data on school mask mandates from 500+ US counties also shows they work https://www.cdc.gov/mmwr/volumes/70/wr/mm7039e3.htm?s_cid=mm7039e3_x.
- Vaccination remains the most important public health priority to reduce viral spread and severe illness in the long run; however, mask mandates, restrictions on indoor gatherings, and targeted business mitigations are still needed to more quickly reduce transmission and prevent a reversal in the short-term.
- For those contemplating a third dose booster, it looks like you can expect similar post-vaccination symptoms as that of the second shot. https://www.cdc.gov/mmwr/volumes/70/wr/mm7039e4.htm?s_cid=mm7039e4_w
- Additional data on long-term symptoms following COVID-19 infection indicate that they are common and more likely to occur than after influenza. It’s not just the flu!! https://journals.plos.org/plosmedicine/article?id=10.1371/journal.pmed.1003773
- COVID-19 hospital occupancy is slowly improving. Nevertheless, occupancy is likely to exceed 20% of all beds in the general ward and 25% of beds in the ICU for another week. Access to care will remain restricted even on the backside of waning COVID-19 case rates. Expect delays in elective procedures to persist especially given worsening staff shortages in inpatient and outpatient settings.
- Merck announced preliminary, promising results of a new antiviral that could reduce hospitalization and deaths by half. https://www.reuters.com/business/healthcare-pharmaceuticals/mercks-covid-19-pill-cuts-risk-death-hospitalization-by-50-study-2021-10-01/. If confirmed, this would be an important breakthrough.
- Weekly COVID-19 deaths now exceed 200 per week and will almost certainly reach 300 for the week ending September 5th and perhaps September 12th too before receding.
Forecast reports to date, available as PDFs
Download PDF to view additional charts of Arizona counties, available in appendix of report.
October 1
2020 Reports
Based on what we know now about this pandemic, we support guidelines for social distancing to slow the spread of the virus and urge everyone to follow the recommendations provided by the Centers for Disease Control and Prevention (CDC) to protect yourself, your family, your neighbors, and your employees. Please heed the recommendations as provided by the CDC.
COVID covid coronavirus virus covid19 corona forecast model