
Weekly Arizona COVID-19 Data Report – Dr. Joe Gerald, September 17
Note this forecast page is not the most recent forecast available.
View the most current forecast report
Researcher Analyzes Arizona COVID-19 Spread Models for Decision-Makers
The following information regarding the spread of COVID-19 in Arizona was prepared by Joe Gerald, MD, PhD, a researcher at the Mel and Enid Zuckerman College of Public Health (MEZCOPH) at the University of Arizona. This information has also been reviewed by other MEZCOPH faculty.
This data were obtained from the Arizona Department of Health Services COVID-19 webpage and reflect conditions in Arizona as of September 17, 2021.
This information is intended to help guide our response to the outbreak. It is not intended to predict how this pandemic will evolve. Rather, this model extrapolates what might occur if current conditions remain unchanged. As regional authorities and healthcare providers respond, their actions are expected to mitigate the worst consequences of this pandemic.

COVID-19 Disease Outbreak Forecast
Arizona State and Pima County
Updated September 17, 2021
Disclaimer: This information represents my personal views and not those of The University of Arizona, the Zuckerman College of Public Health, or any other government entity. Any opinions, forecasts, or recommendations should be considered in conjunction with other corroborating and conflicting data. Updates can be accessed at https://publichealth.arizona.edu/news/2021/covid-19-forecast-model.
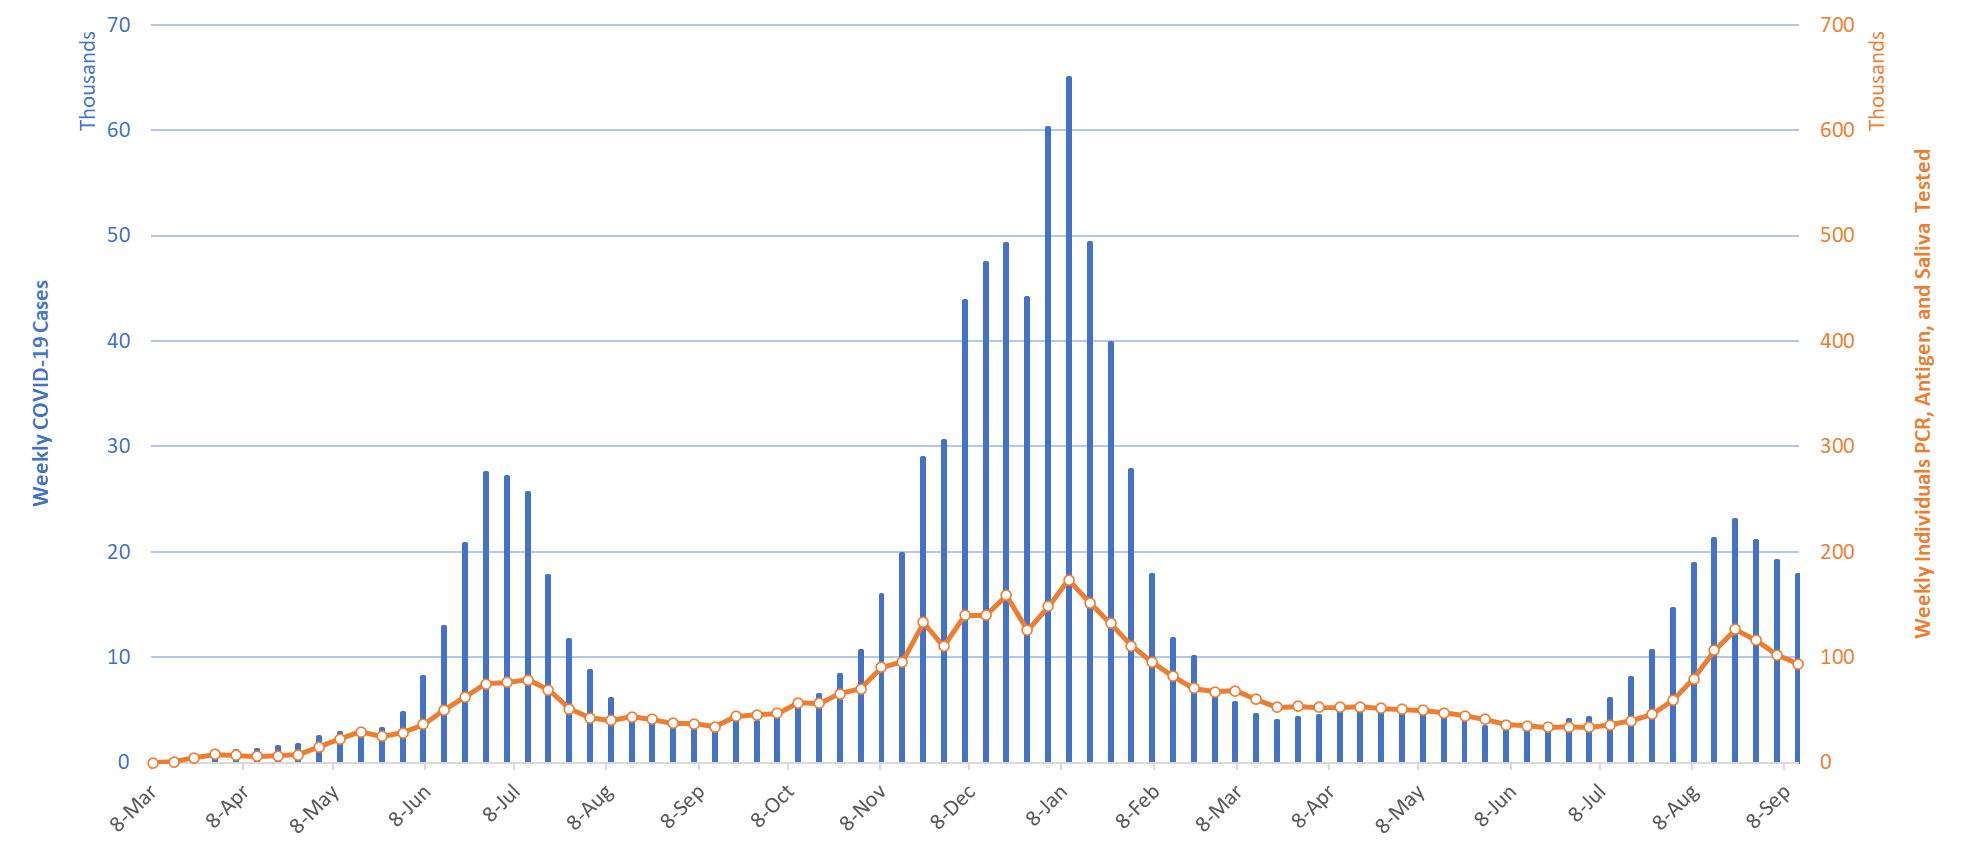
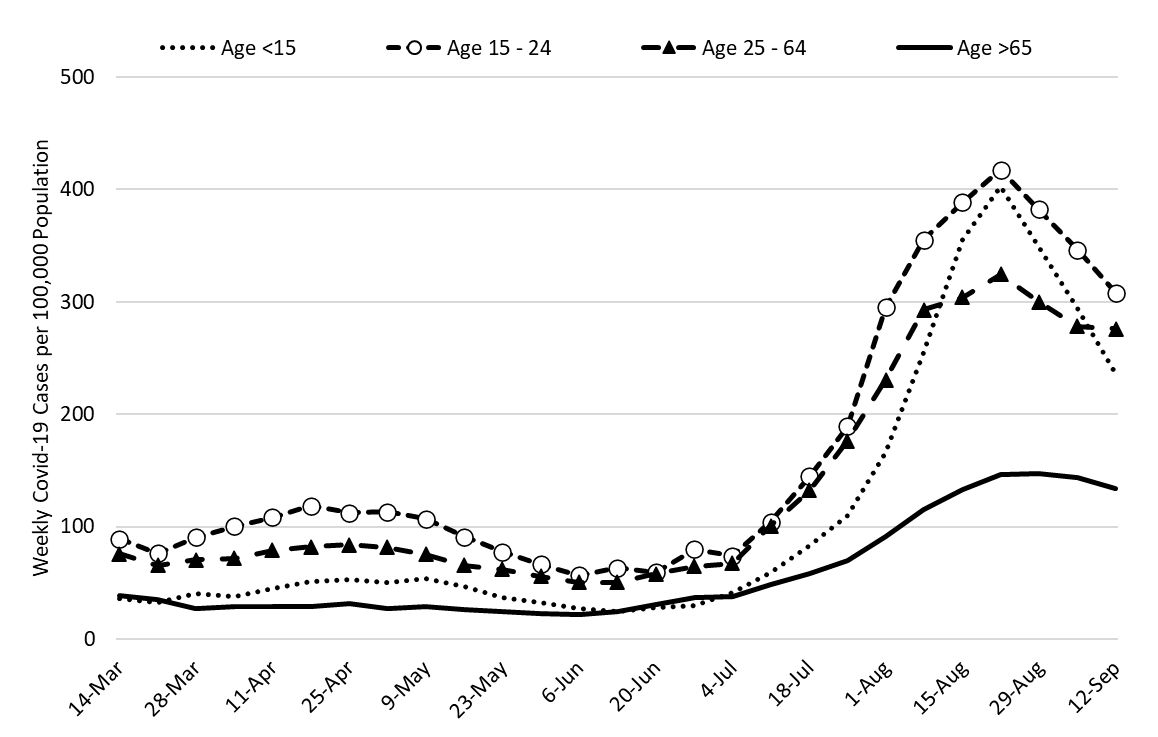
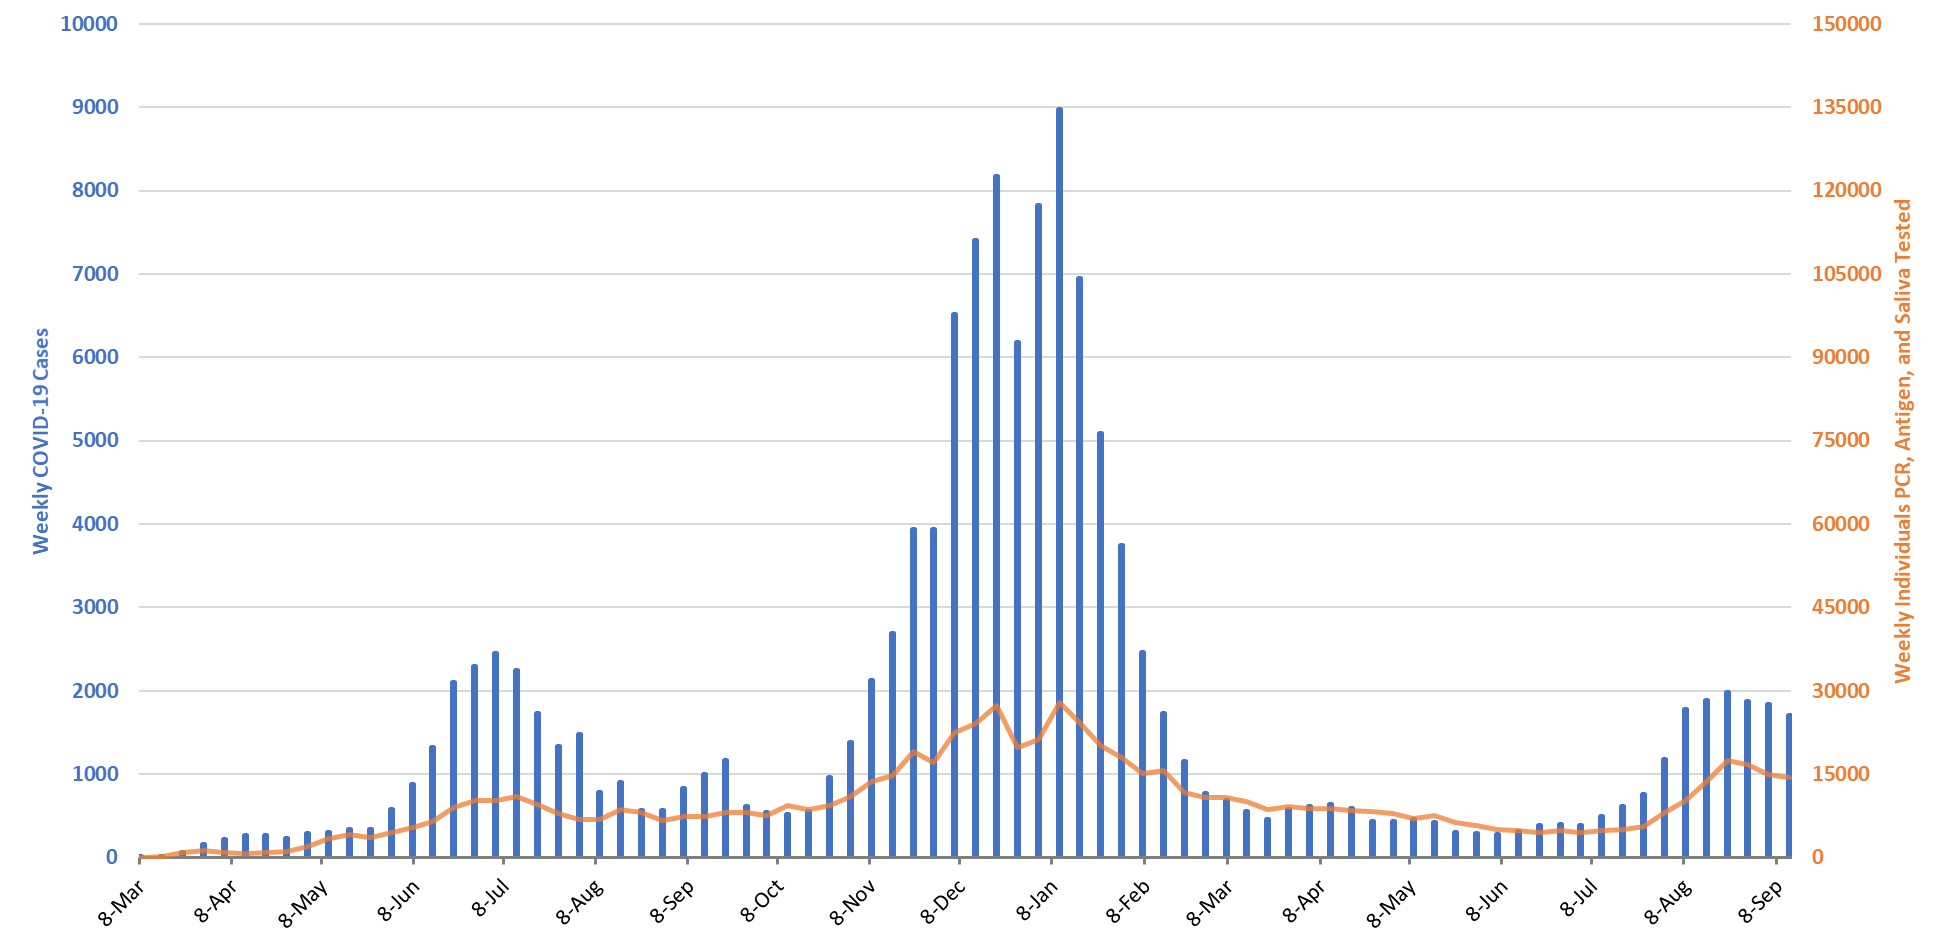
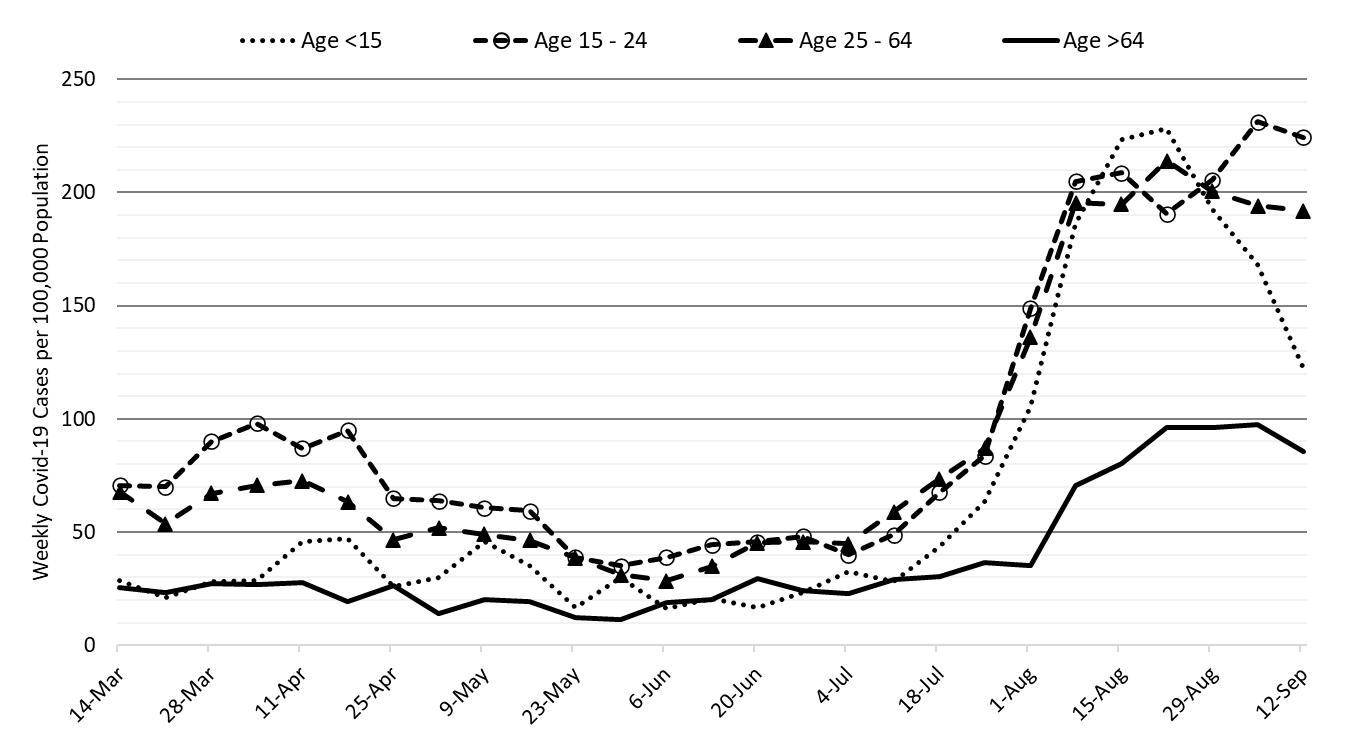
For the week ending September 12th, 17813 Arizonans were diagnosed with COVID-19, a 4% decrease from last week’s initial tally of 18565 cases (Figure 1). The current rate, 248 cases per 100K residents per week, is decreasing by 17 cases per 100K residents per week. Case rates remain highest among those 15 – 24 years and lowest among those >65 years, 308 versus 133 cases per 100K residents, respectively (Figure 2a bellow). Over the past 3 weeks, the largest improvements have been observed among children with rates declining 41% from their peak.
|
Figure 1. Weekly COVID-19 Cases in Arizona and Number of Individuals Undergoing COVID-19 Diagnostic Testing March 1, 2020 – September 12, 2021. |
While Arizona continues to experience a high number of cases, hospitalizations, and deaths, conditions are slowly improving except for a small number of counties like Greenlee County which is near its all-time high. Because behavioral dynamics are an important driver of community transmission and testing, the Labor Day holiday has at least temporarily disrupted testing and transmission trends. Arizona’s national ranking has dropped to 33rd out of 50 states with this week’s leaders being West Virginia (765), Tennessee (764), Alaska (664), and Wyoming (659).
According to the CDC, 61% of Arizona’s adult population is fully vaccinated and another 10% have received one dose. The ADHS Vaccine Dashboard shows weekly doses delivered are declining with 70K doses per being administered last week. Based on national serology data, the combination of natural and vaccine immunity likely exceeds 80% in most parts of the country and among most age groups. Nevertheless, non-pharmacologic interventions like mask mandates, limited gathering sizes, and targeted business mitigations will help speed resolution and ensure this wave does not reignite. In another major development, the FDA advisory panel on vaccines recommended Pfizer booster for those 65+ years of age.
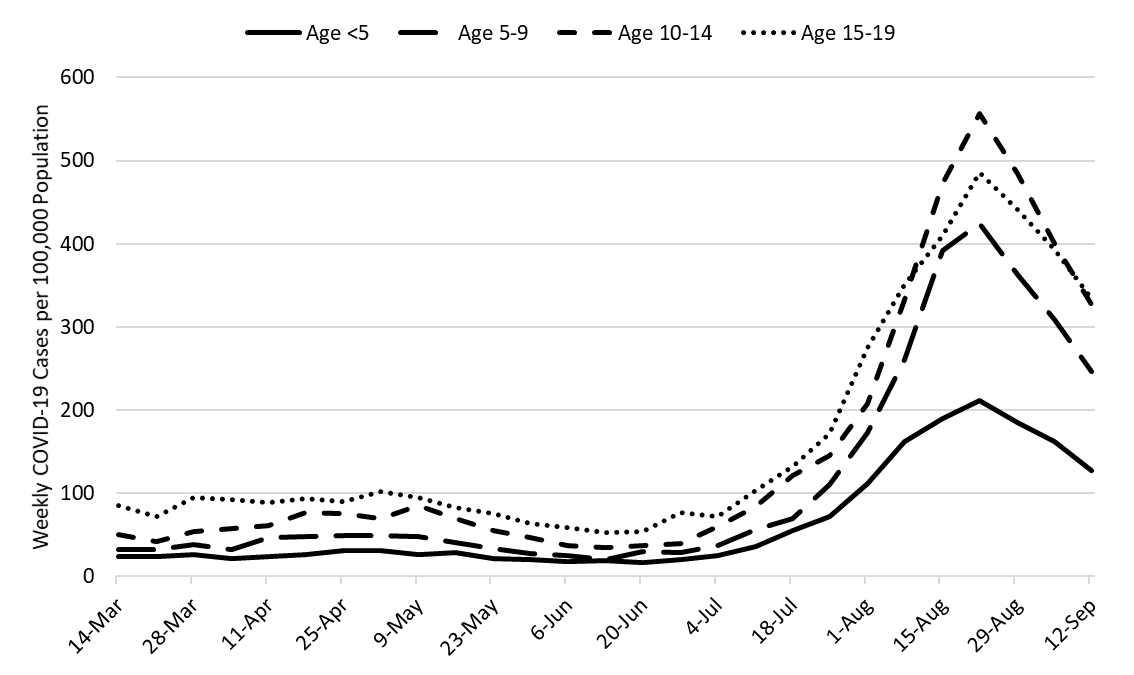
Figure 2a shows a sharp decline in transmission among children (dotted) over the past 3 weeks with the smallest gains being observed among the elderly (solid). While difficult to draw causal conclusions, recent mask mandates in certain districts, aggressive case identification, and limited classroom closures are likely helping as the steepest declines were among school-age children 5 – 19 years (Figure 2b). Rumor has it that an important outbreak analysis of schools with and without mask mandates is imminently expected in the MMWR. A judge presiding over the challenge to Arizona’s prohibition of school mask mandates intends to rule before the September 29th date the law will take effect. Slower declines among working-age and older adults is likely one factor contributing to stubbornly high COVID-19 hospital occupancy (see following sections).
|
Figure 2a. COVID-19 Cases in Arizona by Age Group March 7 – September 12, 2021. |
|
Figure 2b. COVID-19 Cases in Arizona among Children by Age Group March 7 – September 12, 2021. |
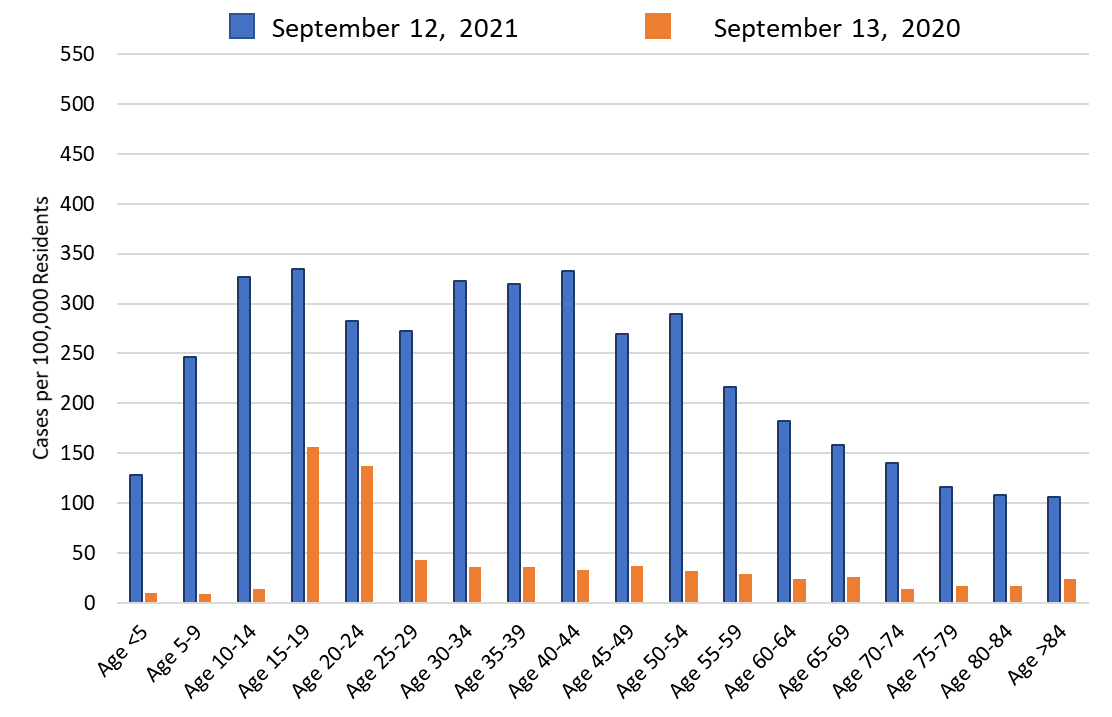
Comparing school reopening this year (in-person) with last year (virtual), levels of community transmission are much higher this year than last, particularly among those 15 years (Figure 2c). Higher transmission among those 15 – 24 years associated with university re-openings was first observed about this time last year (orange bars, ages 15 – 24). Transmission on campus is not an outlier this year which is consistent with the data reported on the UA COVID-19 Dashboard which indicates fewer reported cases on campus this year than last.
|
Figure 2c. COVID-19 Cases in Arizona by Age Group Week Ending September 13, 2020 versus September 12, 2021. |
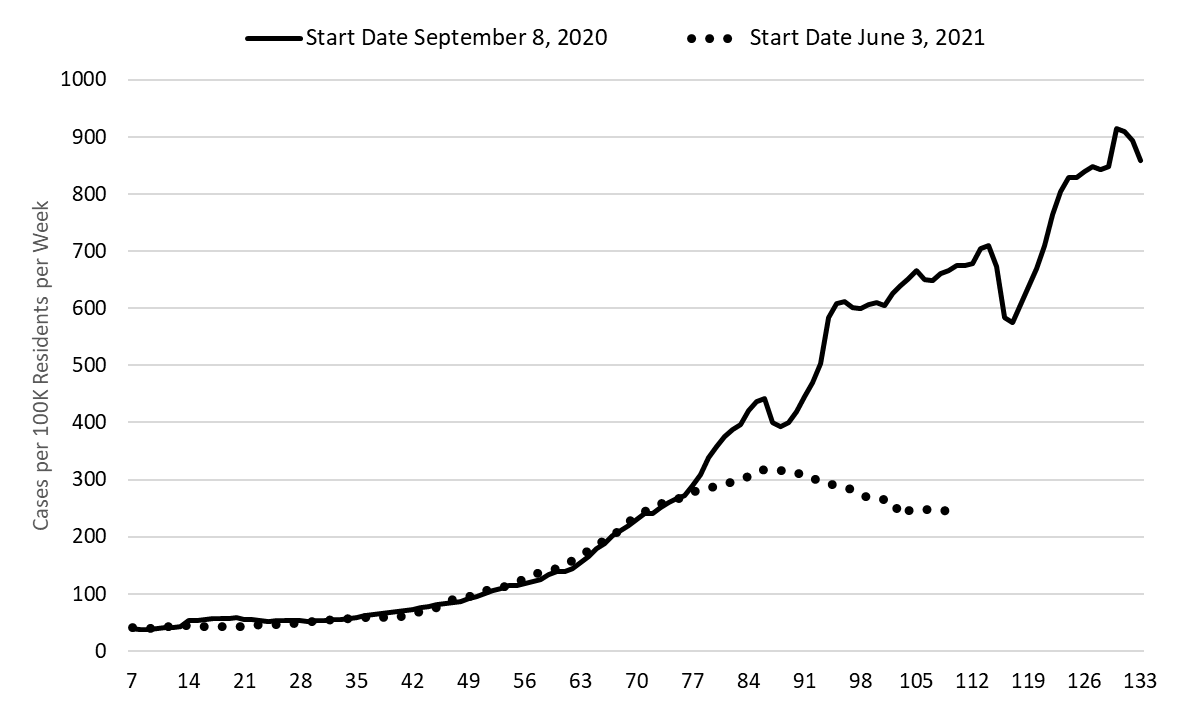
Over the past month, the trajectory of the current outbreak and that of the winter 2020/2021 outbreak have meaningfully diverged (Figure 2d). We are now experiencing a more permanent shift away from last year’s trajectory. Nevertheless, future continued improvements are less certain this week than last.
|
Figure 2d. Fall 2020 and Fall 2021 COVID-19 Waves Superimposed (109 days). |
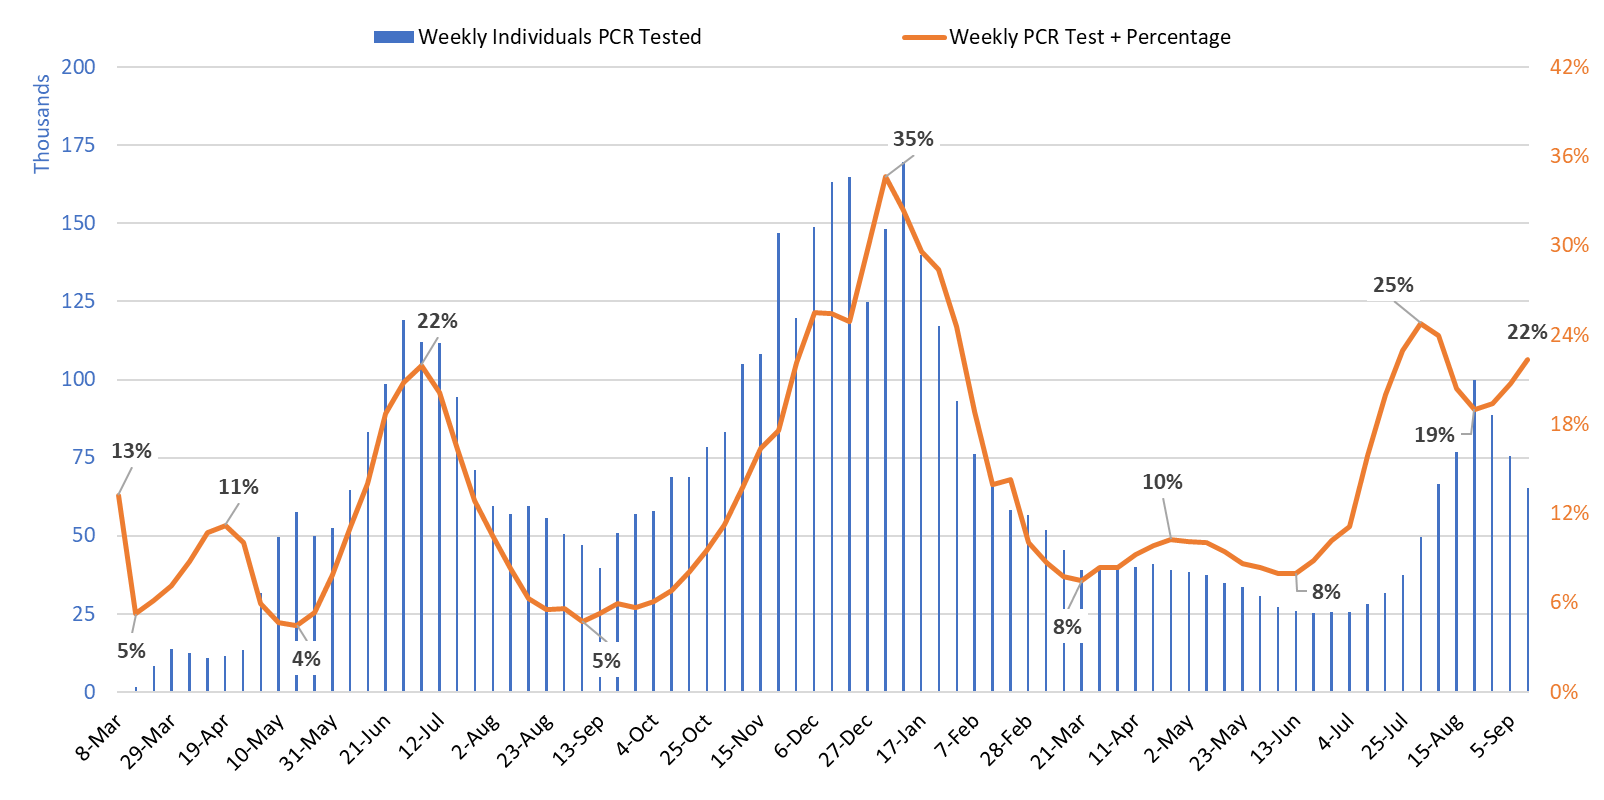
Test positivity among those undergoing traditional nasopharyngeal testing remain unexpectedly high at 22% (Figure 3). This level of positivity indicates that testing is negligently inadequate for public health practice and that many cases are going undiagnosed. Prior troughs in test positivity have preceded increasing transmission rates, so it is possible improvements could slow or reverse in response to Labor Day. Alternatively, fewer people may have been willing to test over the holiday raising the positivity rate but not necessarily transmission.
|
Figure 3. Weekly Number of Patients Undergoing Traditional Nasopharyngeal PCR Testing and Associated Percent Positivity March 1, 2020 – September 12, 2021. |
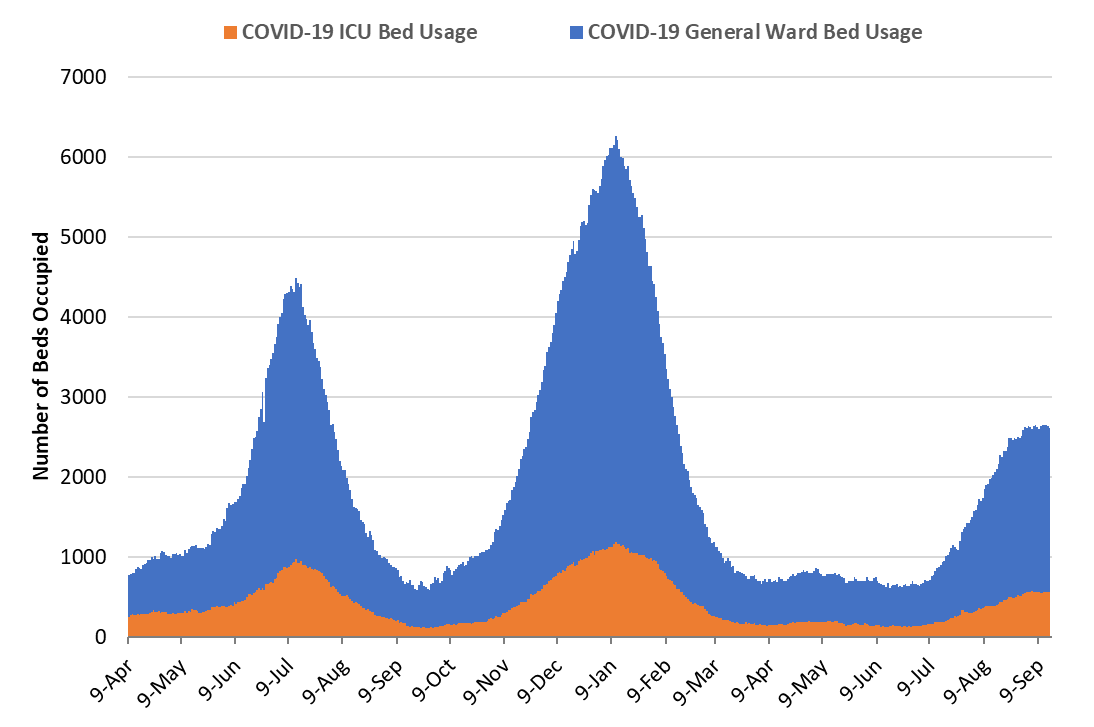
As of September 15th, 2050 (23%) of Arizona’s 8747 general ward beds were occupied by COVID-19 patients, a 1% decrease from last week’s 2061 occupied beds (Figure 4 and Figure 5 Panel A). Another 695 (8%) beds remained available for use. The number of available beds is similar to last week’s 689 beds.
|
Figure 4. Arizona Daily COVID-19 General Ward and ICU Census April 9, 2020 – September 15, 2021. |
As of September 15th, 565 (32%) of Arizona’s 1743 ICU beds were occupied by COVID-19 patients, a 1% increase from last week’s 561 occupied beds (Figure 4 and Figure 5 Panel B). An additional 143 (8%) ICU beds remained available for use, the same as last week’s 143 beds.
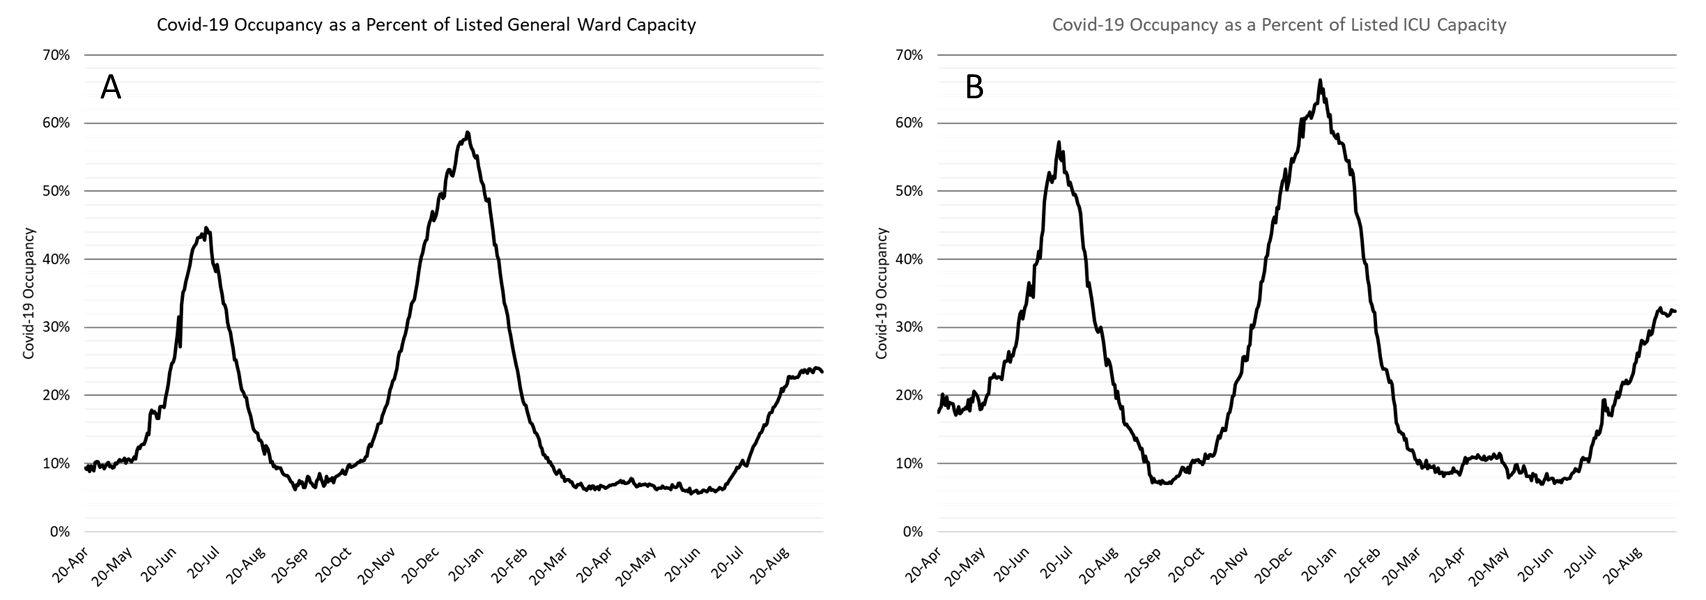
As a lagging indicator, hospital occupancy is plateauing but not declining as expected. This may be attributable to persistently high transmission among high-risk groups and/or longer length of stay among younger patients.
|
Figure 5. COVID-19 Occupancy as a Percent of Listed General Ward (A, left) and ICU (B, right) Capacity in Arizona April 20, 2020 – September 15, 2021. |
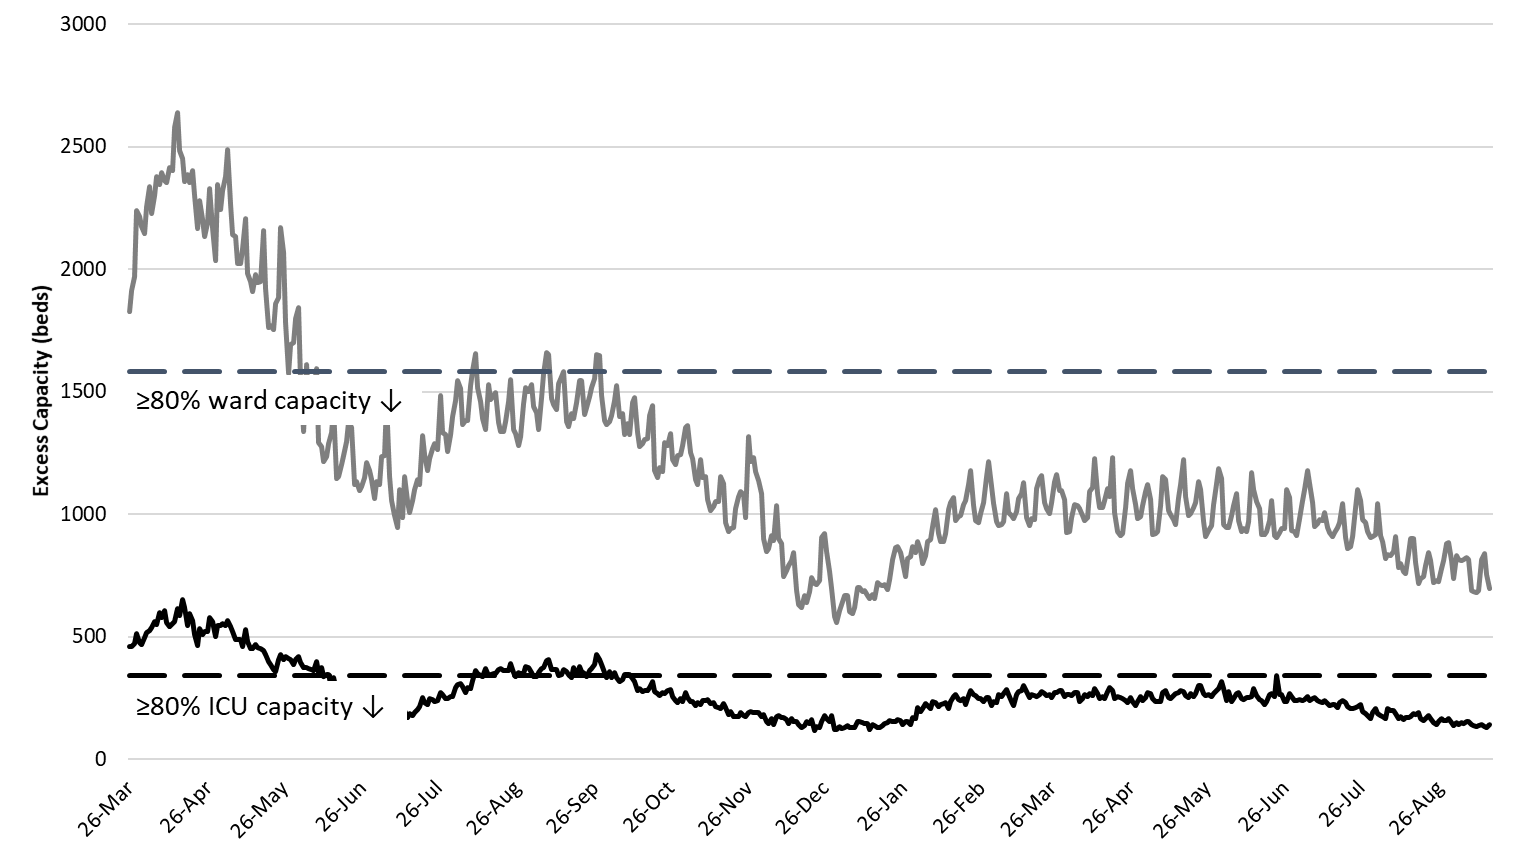
Arizona hospital occupancy remains above seasonal levels. Safety margins, as measured by excess available beds, remain quite low (Figure 6). Available excess capacity is nearly as low as it was at the worst of the winter 2020/2021 surge. Because occupancy is not improving in response to declining community transmission, hospitals should be prepared for >20% ward occupancy and >25% ICU occupancy for several more weeks. Even if you are vaccinated, the tail of this COVID-19 surge will still impact your access to healthcare services should you become ill.
|
Figure 6. Observed Excess Non-Surge General Ward and ICU Capacity in Arizona March 26, 2020 – Sept 15, 2021. |
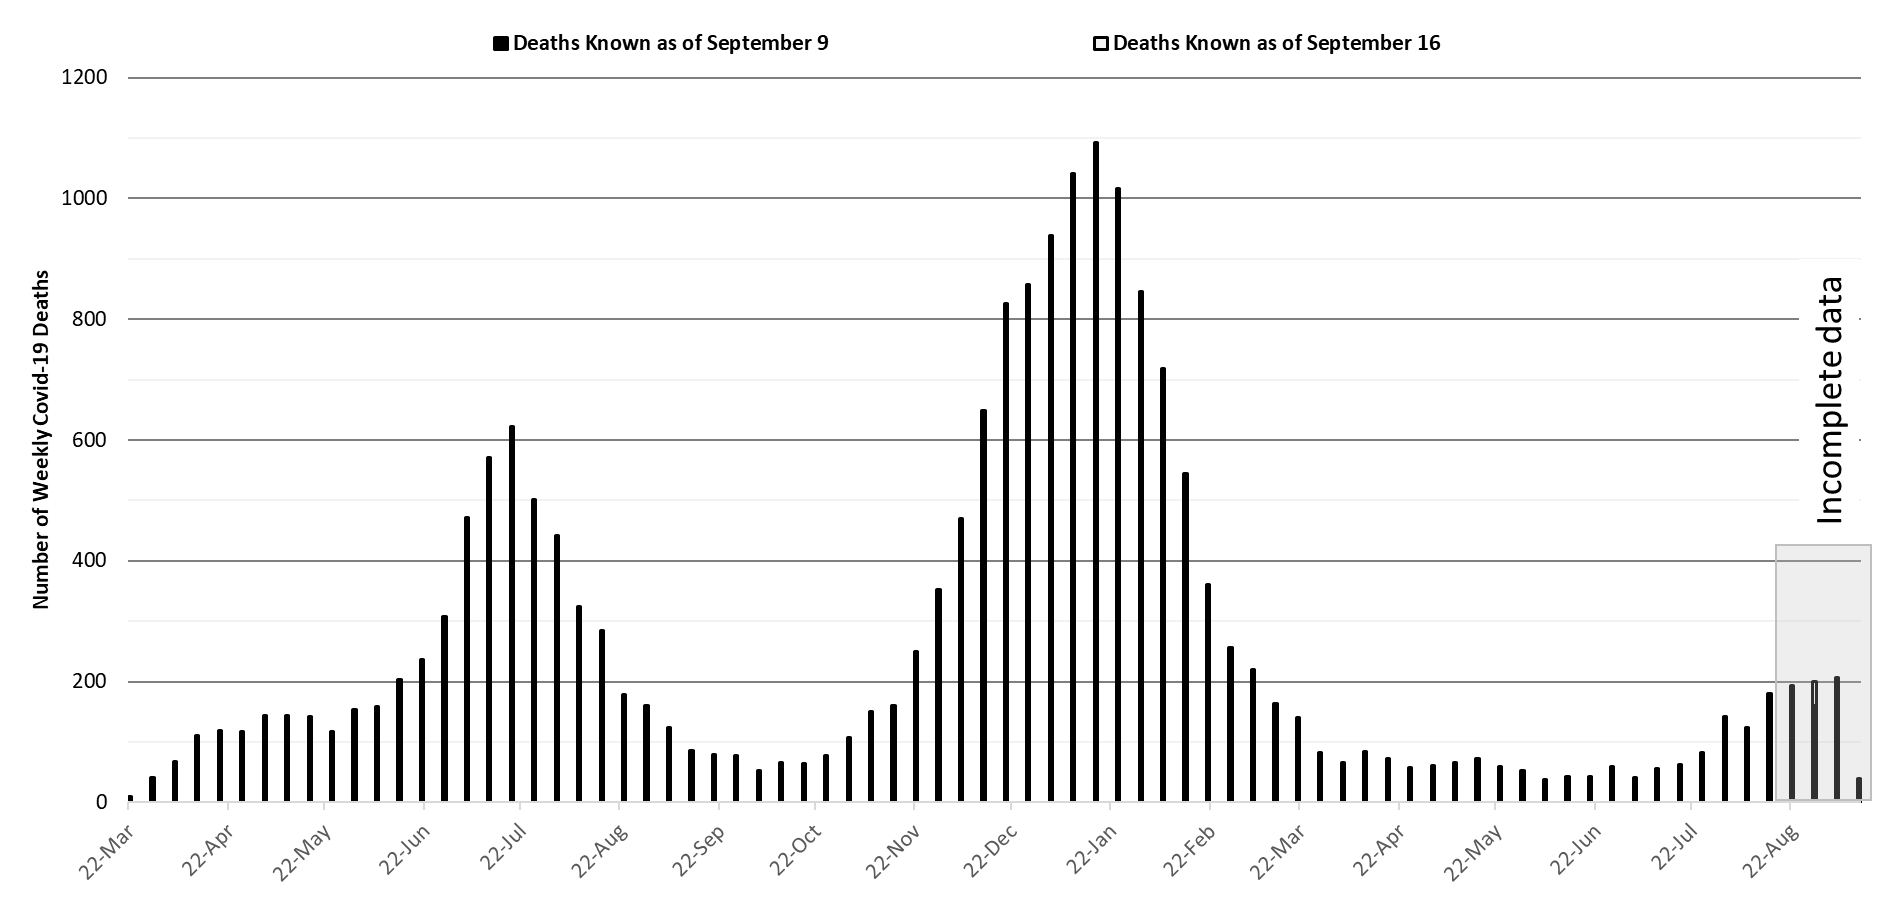
Arizona continues to experience >100 COVID-19 deaths per week (Figure 7). The week ending September 5th has recorded 180 deaths so far with the week ending August 22nd close behind with 178 deaths. Even so, the rise in the number of deaths is more muted than expected given the rise in cases. It now appears unlikely that Arizona will reach 300 deaths per week. Instead, the peak should occur at 200 deaths or a bit more per week.
|
Figure 7. Weekly Arizona COVID-19 Deaths March 16, 2020 – September 12, 2021. |
Pima County Outlook
For the week ending September 12th, 1712 Pima County residents were diagnosed with COVID-19 a 4% decline from last week’s initial tally (Figure 8). This marks the 3rd week of declining case counts although the decline is more modest than the state trend.
|
Figure 8. Weekly COVID-19 Cases in Pima County and Number of Individuals Undergoing COVID-19 Diagnostic Testing March 1, 2020 – September 12, 2021. |
New cases are being diagnosed at a rate of 165 cases per 100K residents per week and is declining by 13 cases per 100K residents per week. Trends across the various age groups appear in Figure 9. A sharp, sustained drop among children, but not others, is readily apparent.
|
Figure 9. COVID-19 Cases in Pima County by Age Group March 7, 2020 – September 12, 2021. |
Summary
- Arizona continues to experience high levels of community transmission, but case rates are slowly declining. Test positivity remains stubbornly high reminding us that test capacity, accessibility, and/or uptake is woefully inadequate to meet public health needs. Slow improvements, particularly among older groups, serves as a warning that major behavioral shifts could result in future increases.
- As of September 12th, new cases were being diagnosed at a rate of 248 cases per 100K residents per week. The rate was decreasing by 17 cases per 100K residents per week. While most counties are seeing improvement, a few like Greenlee are experiencing worsening outbreaks.
- Transmission among children continues to decline faster than transmission among other age groups. Importantly, schools may have to discontinue evidence-based mitigation practices (e.g., masking) on September 29th depending on an impending court ruling.
- Further evidence that adults making good decisions (e.g., getting vaccinated) benefit children https://www.cdc.gov/mmwr/volumes/70/wr/mm7036e1.htm.
- Relying on high-tech, costly treatments (e.g., convalescent plasma) instead of vaccination also doesn’t work https://www.nature.com/articles/s41591-021-01488-2.
- Vaccination remains the most important public health priority to reduce viral spread and severe illness in the long run; however, mask mandates, restrictions on indoor gatherings, and targeted business mitigations are still needed to reduce transmission and prevent a reversal in the short-term.
- The FDA advisory panel on vaccines recently recommended Pfizer booster for those 65+ years of age and those at high risk https://www.cnn.com/2021/09/17/health/fda-advisers-booster-five-things/index.html. A recent Lancet article lays out concerns some scientists have with widespread approval https://www.thelancet.com/journals/lancet/article/PIIS0140-6736(21)02046-8/fulltext.
- A recent MMWR report compares vaccine effectiveness against hospitalizations through August https://www.cdc.gov/mmwr/volumes/70/wr/mm7038e1.htm. Short story, Moderna appears to confer a small advantage but Pfizer and J&J work well too.
- Two more MMWR articles with similar conclusions regarding high vaccine efficacy against ED visits and hospitalizations https://www.cdc.gov/mmwr/volumes/70/wr/mm7037e2.htm https://www.cdc.gov/mmwr/volumes/70/wr/mm7037e1.htm.
- A recent NEJM article shows Pfizer vaccine efficacy to be safe and effective at 6 months https://www.nejm.org/doi/full/10.1056/NEJMoa2110345.
- A recent NEJM article shows Pfizer vaccine to be safe with a small increase in myocarditis risk, but the risk of this outcome and others was substantially higher following COVID-19 infection https://www.nejm.org/doi/full/10.1056/NEJMoa2110475.
- A recent NEJM article shows higher neutralization titers following 3rd dose of Pfizer vaccine https://www.nejm.org/doi/full/10.1056/NEJMc2113468.
- Another NEJM articles shows potential additional protection among those 60+ with a 3rd dose of Pfizer vaccine https://www.nejm.org/doi/full/10.1056/NEJMoa2114255.
- COVID-19 hospital occupancy is holding steady and is likely to exceed 20% of all beds in the general ward and 25% of beds in the ICU for weeks to come. Access to care will remain restricted even on the backside of waning COVID-19 case rates. Expect delays in elective procedures to persist.
- Although weekly deaths approaching 300 are now improbable, totals reaching low 200s will persist for the end of August – early September.
Forecast reports to date, available as PDFs
Download PDF to view additional charts of Arizona counties, available in appendix of report.
2020 Reports
Based on what we know now about this pandemic, we support guidelines for social distancing to slow the spread of the virus and urge everyone to follow the recommendations provided by the Centers for Disease Control and Prevention (CDC) to protect yourself, your family, your neighbors, and your employees. Please heed the recommendations as provided by the CDC.
COVID covid coronavirus virus covid19 corona forecast model