
Weekly Arizona COVID-19 Data Report – February 11
Note this forecast page is not the most recent forecast available.
View the most current forecast report
Researcher Analyzes Arizona COVID-19 Spread Models for Decision-Makers
The following information regarding the spread of COVID-19 in Arizona was prepared by Joe Gerald, MD, PhD, a researcher at the Mel and Enid Zuckerman College of Public Health (MEZCOPH) at the University of Arizona. This information has also been reviewed by other MEZCOPH faculty.
This data were obtained from the Arizona Department of Health Services COVID-19 webpage and reflect conditions in Arizona as of February 4, 2022.
This information is intended to help guide our response to the outbreak. It is not intended to predict how this pandemic will evolve. Rather, this model extrapolates what might occur if current conditions remain unchanged. As regional authorities and healthcare providers respond, their actions are expected to mitigate the worst consequences of this pandemic.

COVID-19 Disease Outbreak Forecast
Arizona State and Pima County
Updated February 11, 2022
Disclaimer: This information represents my personal views and not those of The University of Arizona, the Zuckerman College of Public Health, or any other government entity. Any opinions, forecasts, or recommendations should be considered in conjunction with other corroborating and conflicting data. Updates can be accessed at https://publichealth.arizona.edu/news/2021/covid-19-forecast-model.
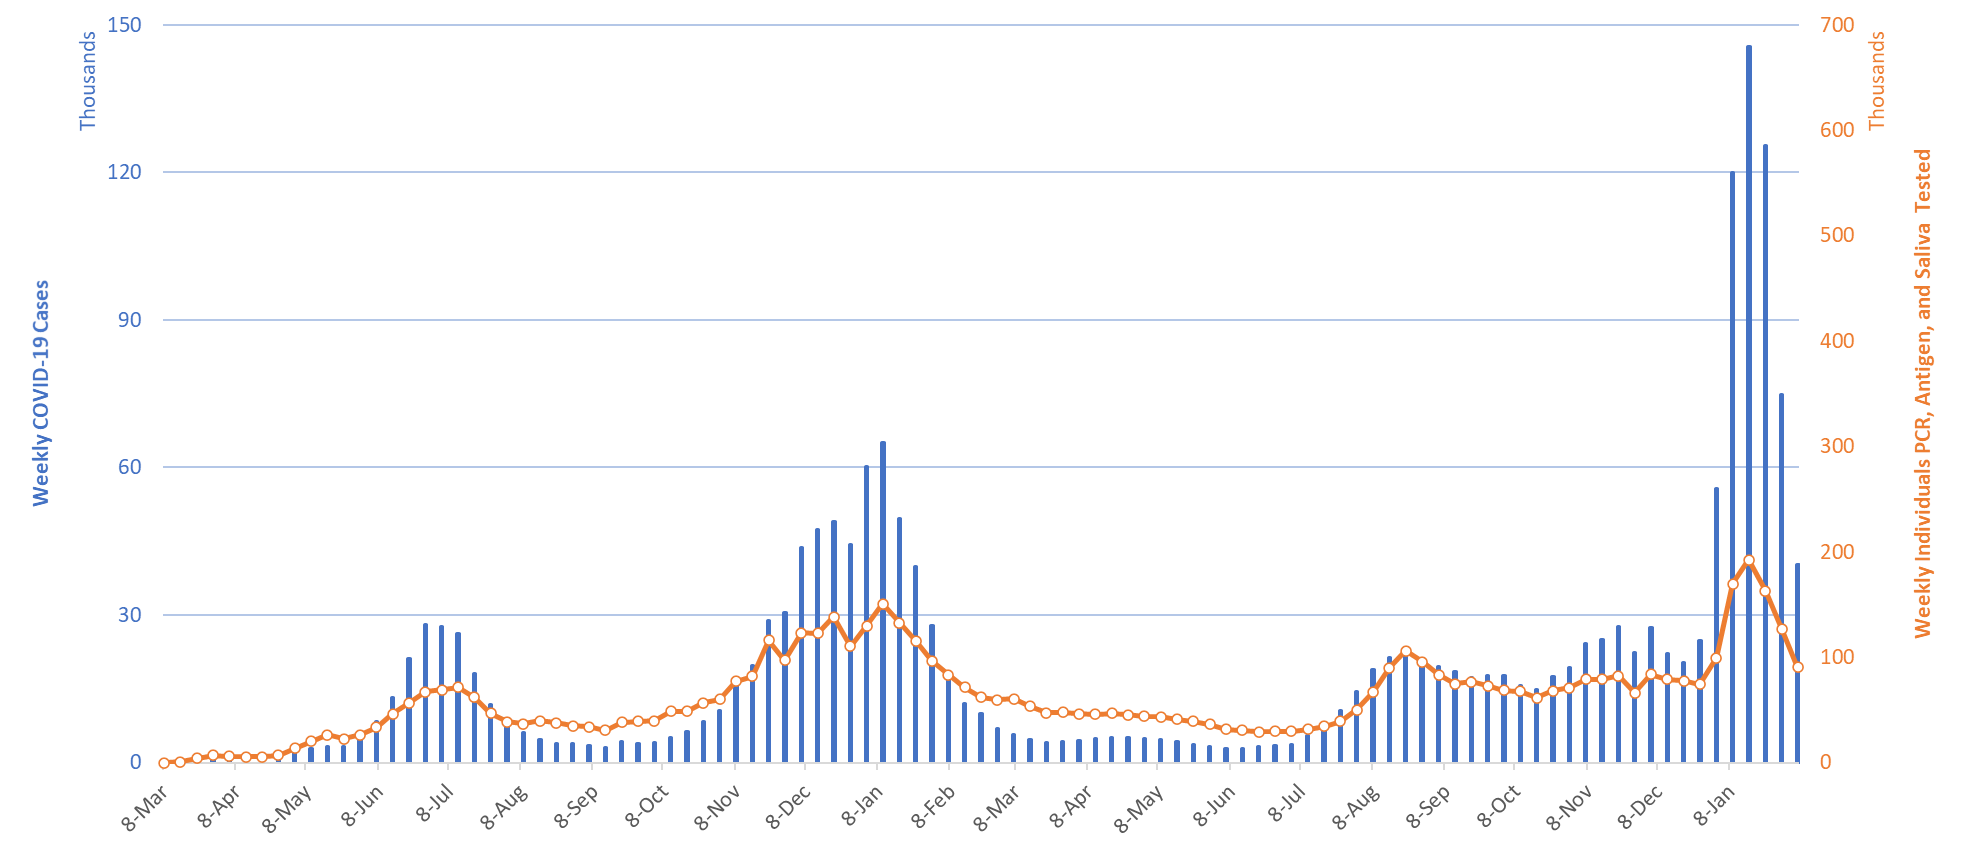
Figure 1. Weekly COVID-19 Cases in Arizona and Number of Individuals Undergoing COVID-19 Diagnostic Testing March 1, 2020 – February 6, 2022.
For the week ending February 6th, at least 40267 Arizonans were diagnosed with COVID-19, a 45% decrease from the 73828 cases reported the prior week (Figure 1). This week’s tally is smaller than the January 2021 peak (65094 cases) but it is higher than the June 2020 peak (28009 cases). The risk of contracting Omicron remains extremely high. It is still too soon for institutions and/or individuals to safely relax their mitigation practices as the level of transmission is more important than the direction of change.
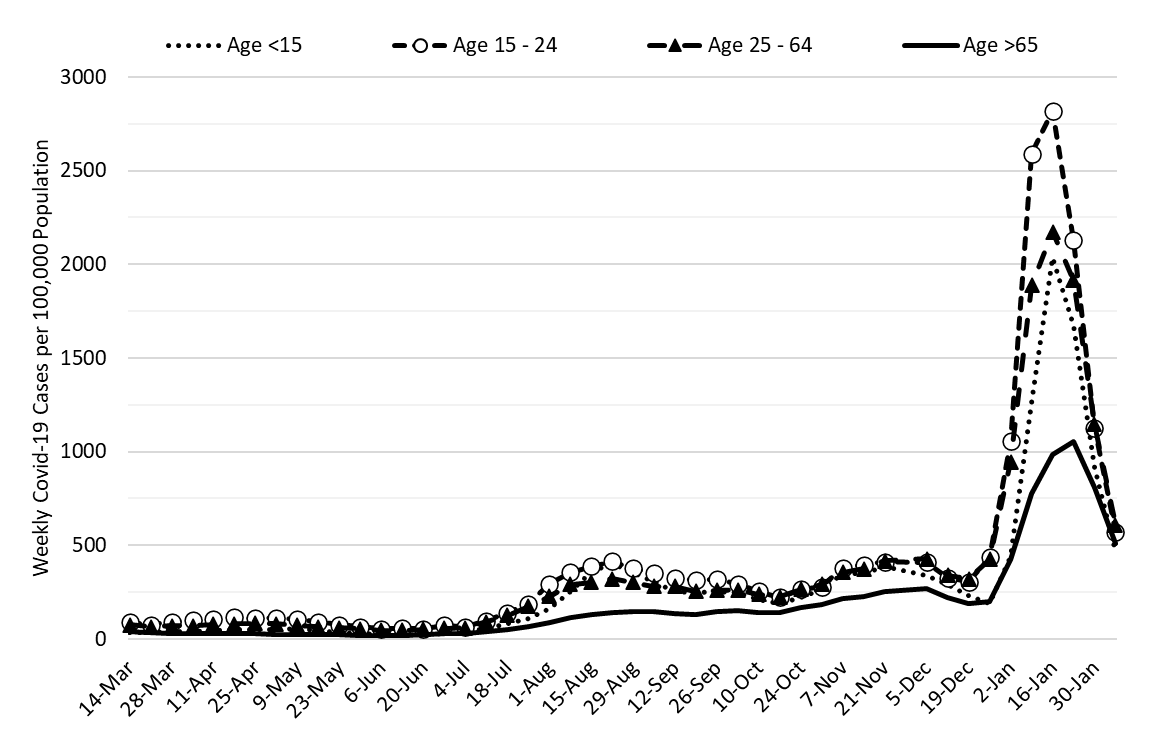
Figure 2a. COVID-19 Cases in Arizona by Age Group March 7, 2021 – February 6, 2022 (Data from week ending November 28 suppressed).
Figure 2a shows transmission among all age groups is decreasing with much less separation by age than during the peak.
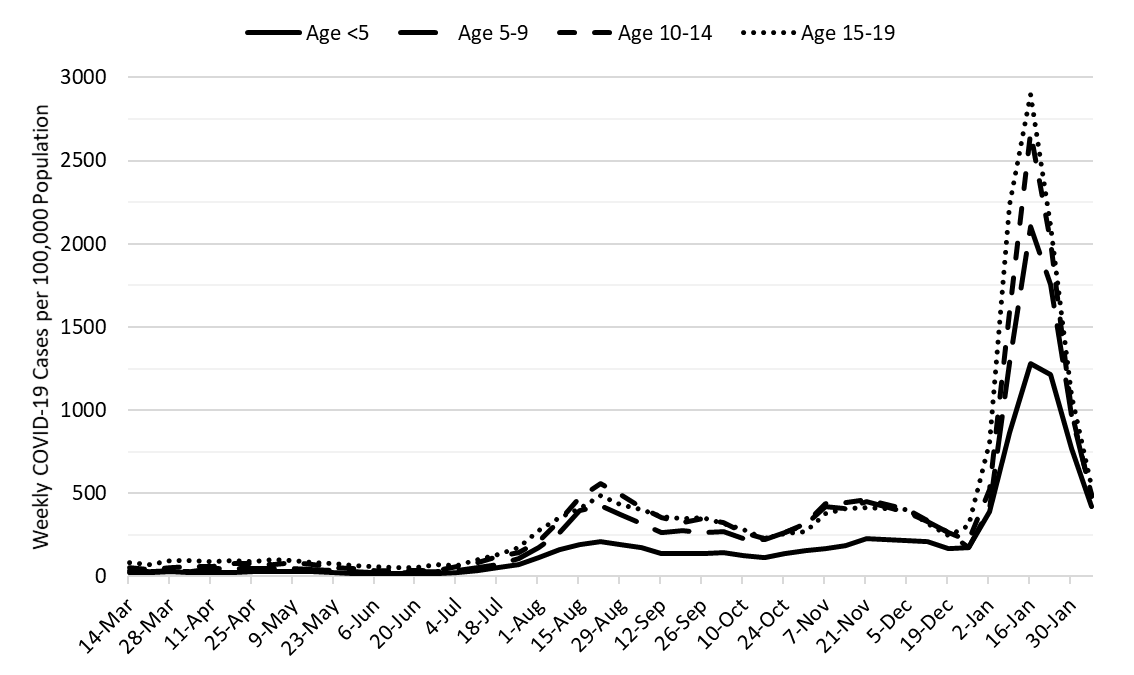
Figure 2b. COVID-19 Weekly Incidence in Arizona among children March 7, 2021 – February 6, 2022.
Figure 2b shows that transmission among children is also declining across all age groups.
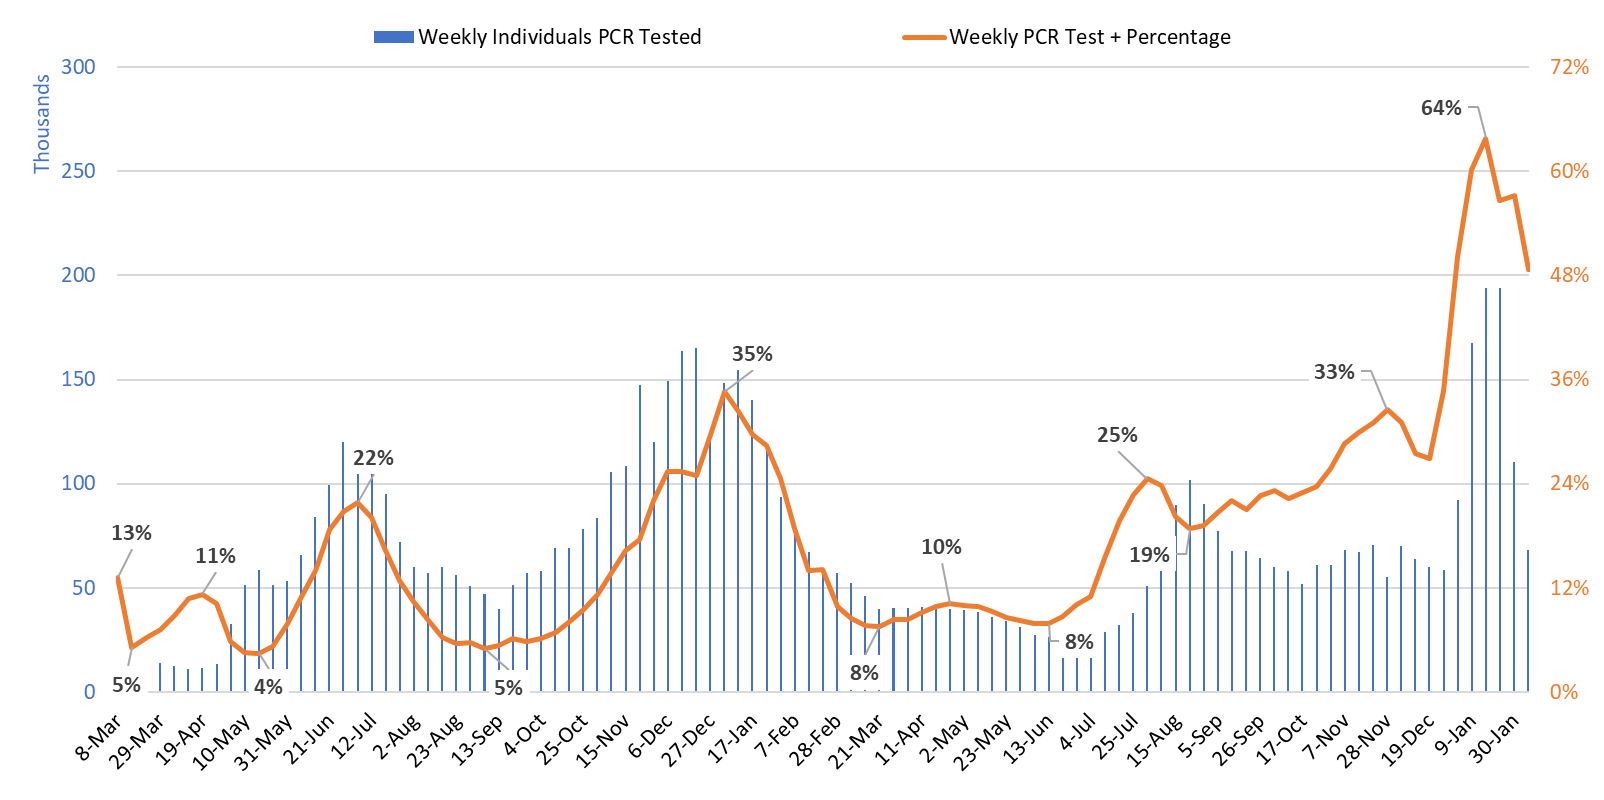
Figure 3. Weekly Number of Patients Undergoing Traditional Nasopharyngeal PCR Testing and Associated Percent Positivity March 1, 2020 – February 6, 2022.
Test positivity fell this week but remains quite high at 49% (Figure 3).
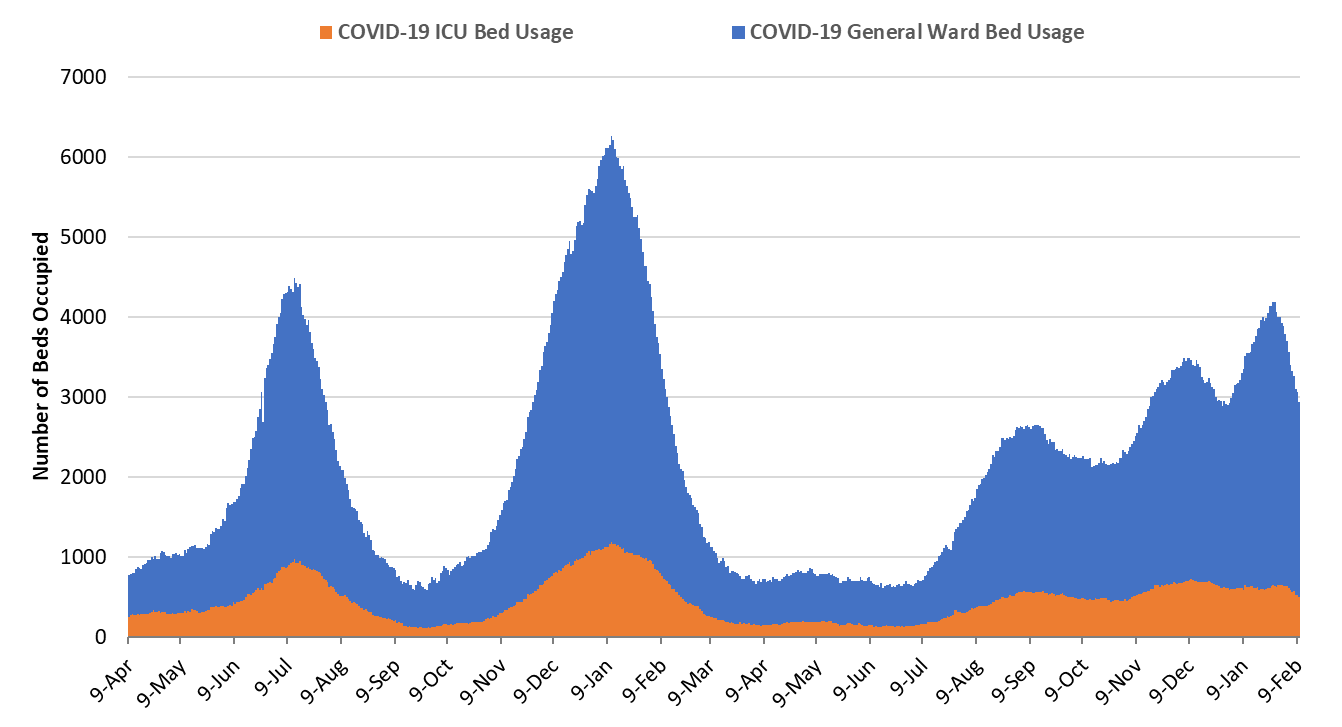
Figure 4. Arizona Daily COVID-19 General Ward and ICU Census April 9, 2020 – February 10, 2022.
As of February 10th, 2436 (28%) of Arizona’s 8743 general ward beds were occupied by COVID-19 patients, a 20% decrease from last week’s 3064 occupied beds (Figure 4 and Figure 5 Panel A below). Another 604 (7%) beds remained available for use which is higher than last week’s 526 available beds. Four-hundred ninety-nine (499, 31%) of Arizona’s 1642 ICU beds were occupied by COVID-19 patients, a 21% decrease from last week’s 632 occupied beds (Figure 4 and Figure 5 Panel B below). An additional 137 (8%) ICU beds remained available for use which is higher than last week’s 117 beds.
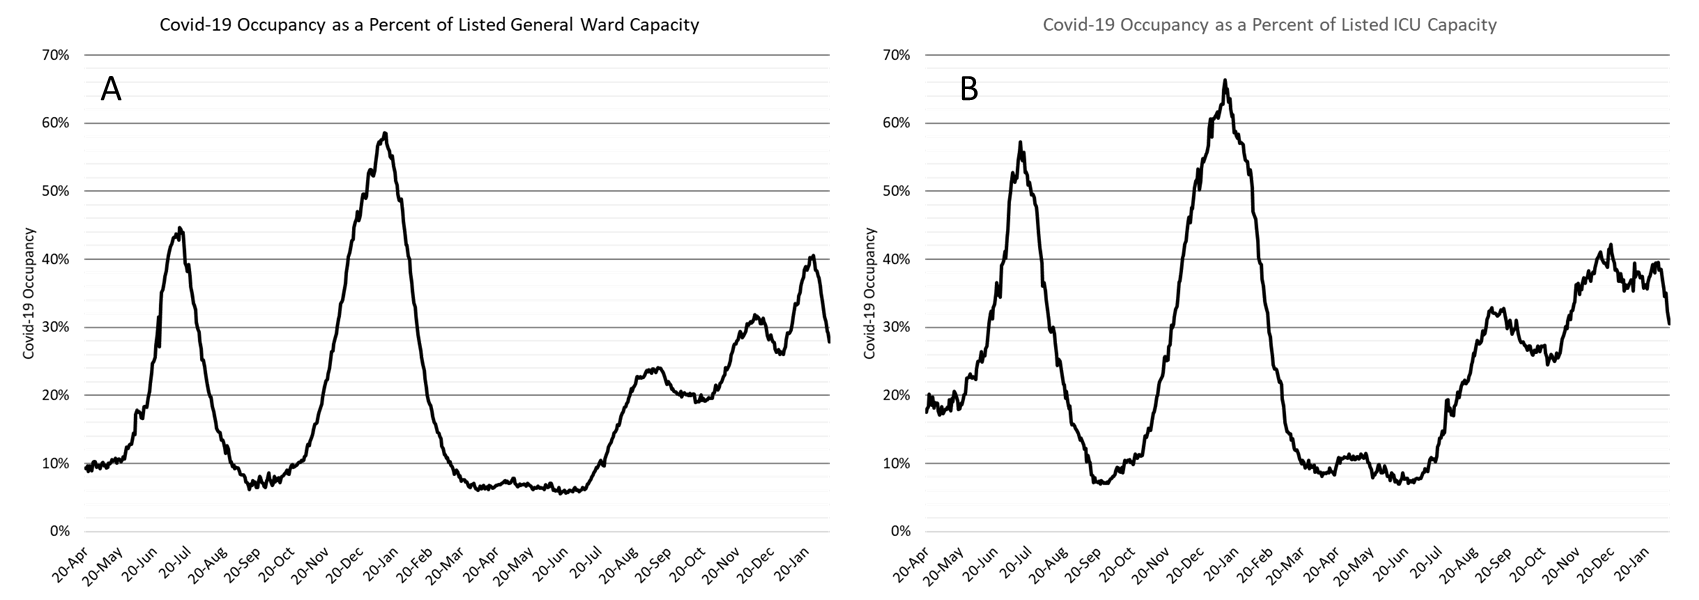
Figure 5. COVID-19 Occupancy as a Percent of Listed General Ward (A, left) and ICU (B, right) Capacity in Arizona April 20, 2020 – February 10, 2022.
In a sign of relief, we fell below 3000 combined occupancy this week. Nevertheless, hospitals remain very busy. They have now experienced 181 consecutive days with a combined occupancy >2000 patients whereas the summer 2020 and winter 2021 saw 57 and 98 days, respectively. We experienced 75 days with >3000 combined occupancy with the Delta/Omicron waves whereas the summer 2020 and winter 2021 waves saw 35 and 78 days, respectively.
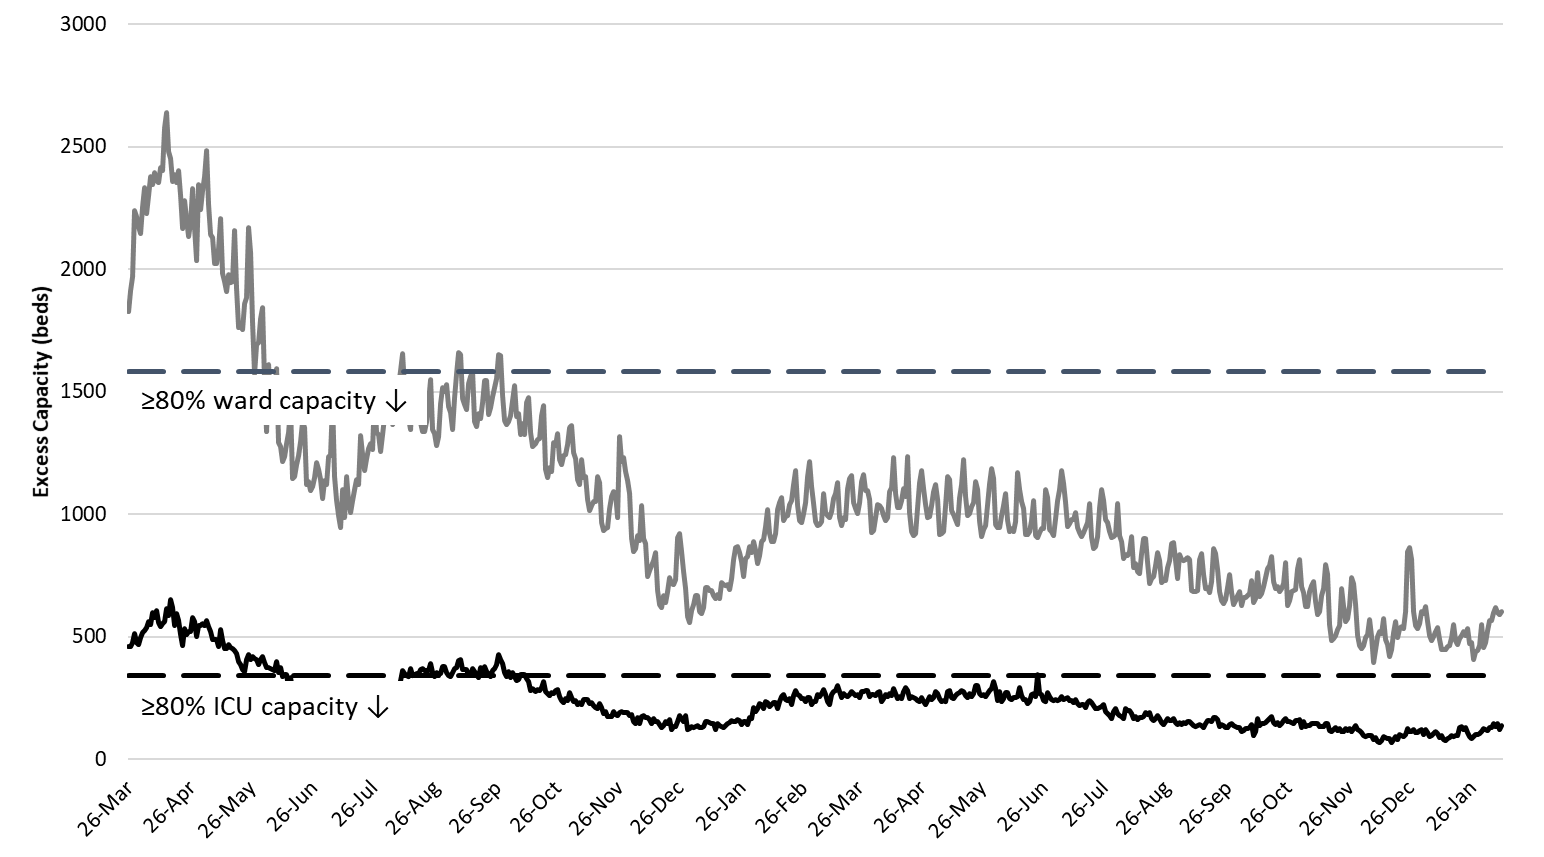
Figure 6. Observed Excess Non-Surge General Ward and ICU Capacity in Arizona Mar 26, 2020 – Feb 10, 2022.
Hospital occupancy remains far above seasonal levels with safety margins, as measured by available beds, remaining near historical lows (Figure 6).
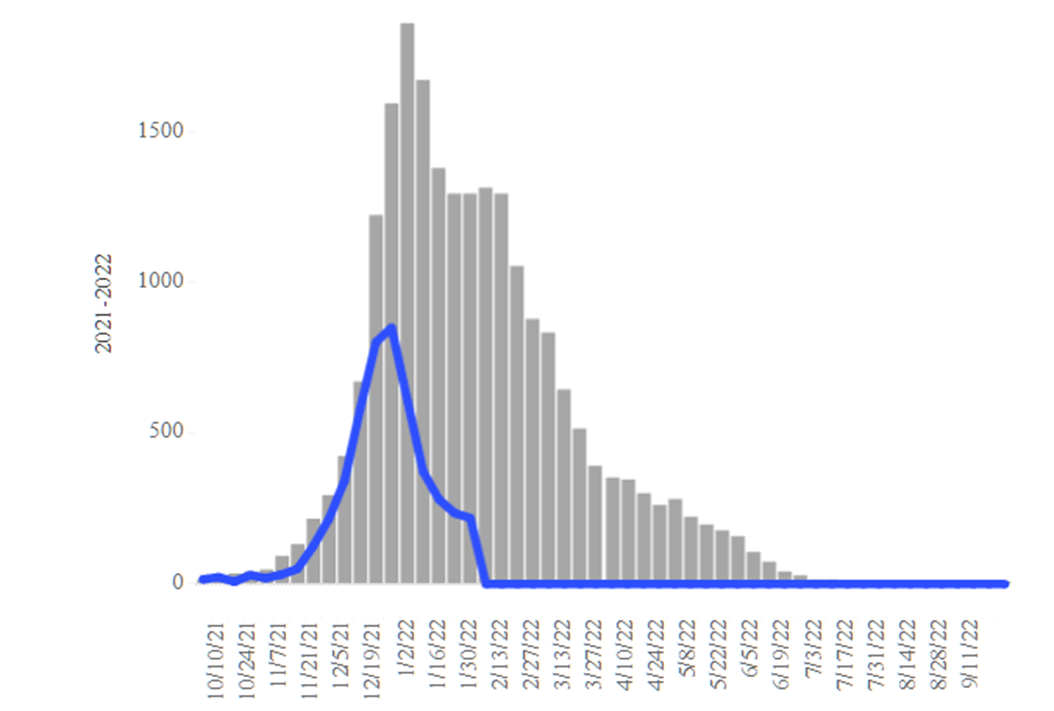
Figure 7. Arizona Influenza Cases in 2021 (blue) versus 5-Year Historical Average (grey)
Seasonal influenza cases in Arizona (blue line) has fizzled, at least as compared to the state’s 5-year historical average (grey bars, Figure 7). COVID-19 mitigation efforts may have slowed influenza transmission. Hospitals should get further relief from fewer COVID-19 and fewer influenza cases over the coming weeks.
Pima County Outlook
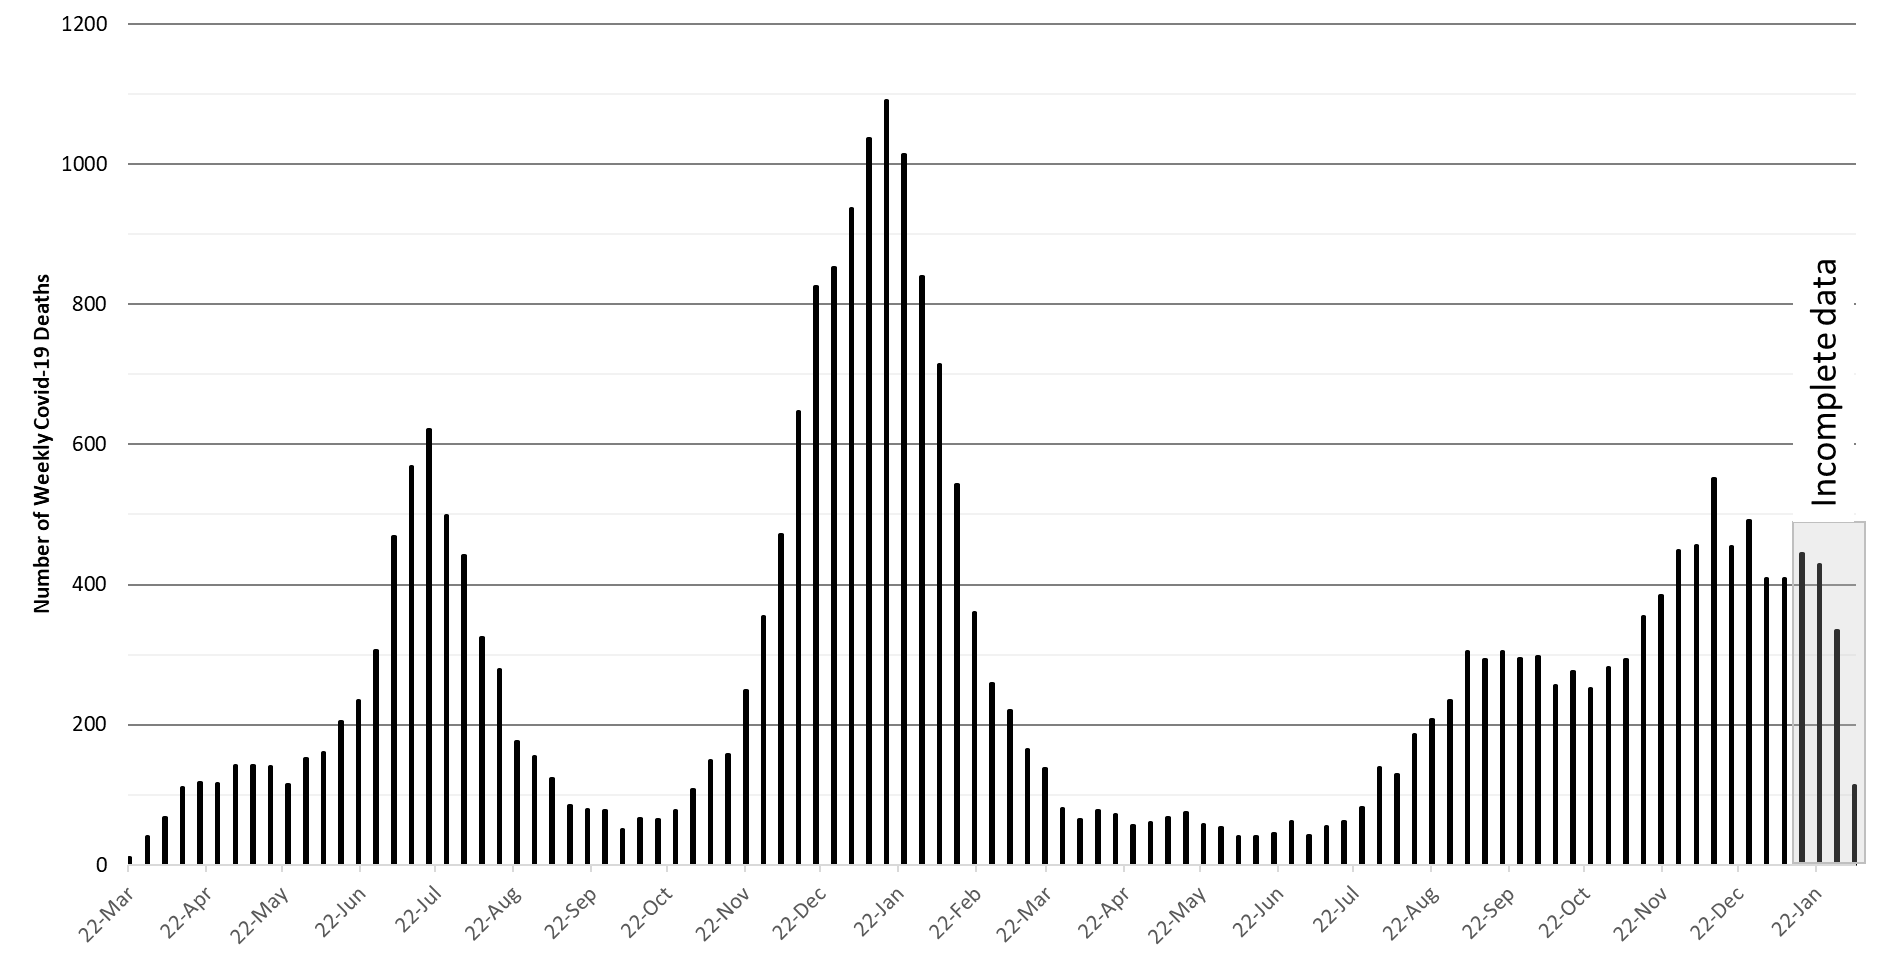
Figure 8. Weekly Arizona COVID-19 Deaths March 16, 2020 – February 6, 2022.
The week ending December 12th has now recorded 552 deaths to date. Hopefully, this will be the only week this happens during the Delta - Omicron waves (Figure 8). At least 27073 Arizonans have lost their lives to COVID-19. A mortality report from the AzPHA indicates that official statistics undercount actual deaths.
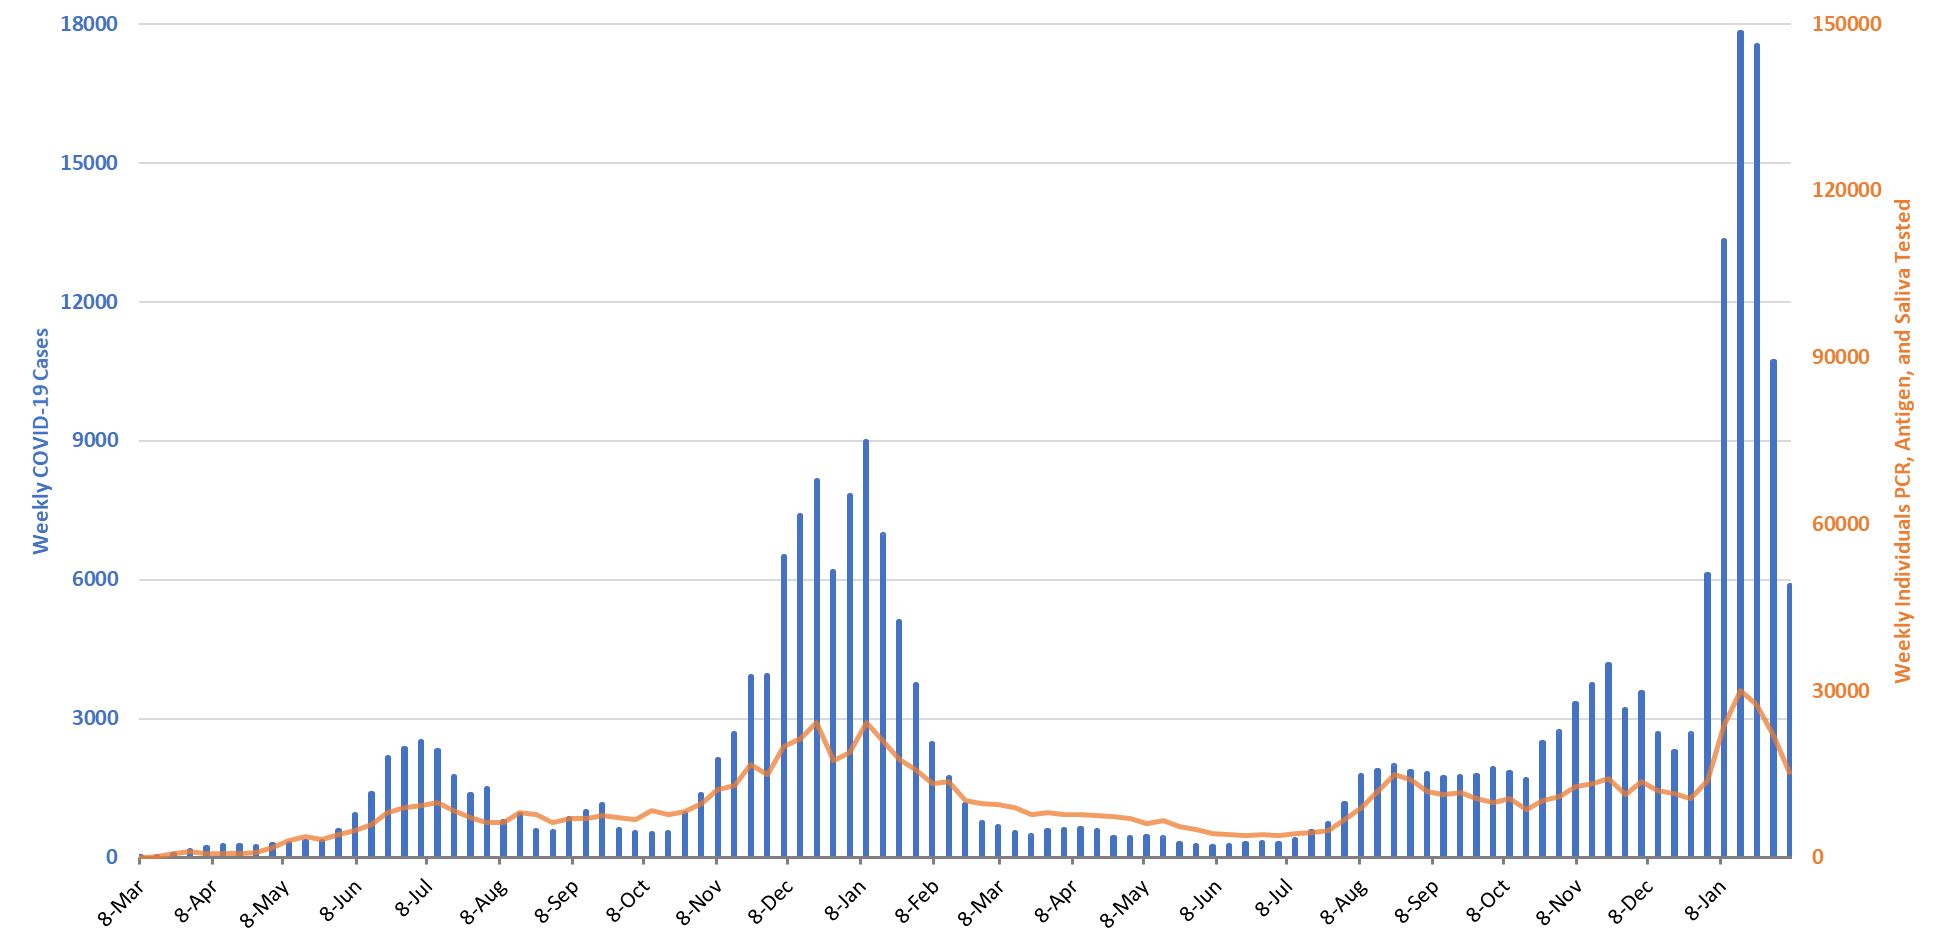
Figure 9. Weekly COVID-19 Cases in Pima County and Number of Individuals Undergoing COVID-19 Diagnostic Testing March 1, 2020 – February 6, 2022.
For the week ending January 30th, 5882 Pima County residents were diagnosed with COVID-19, a 44% decrease from the initial tally of 10507 cases last week (Figure 9). Transmission by age group is shown in Figure 10.
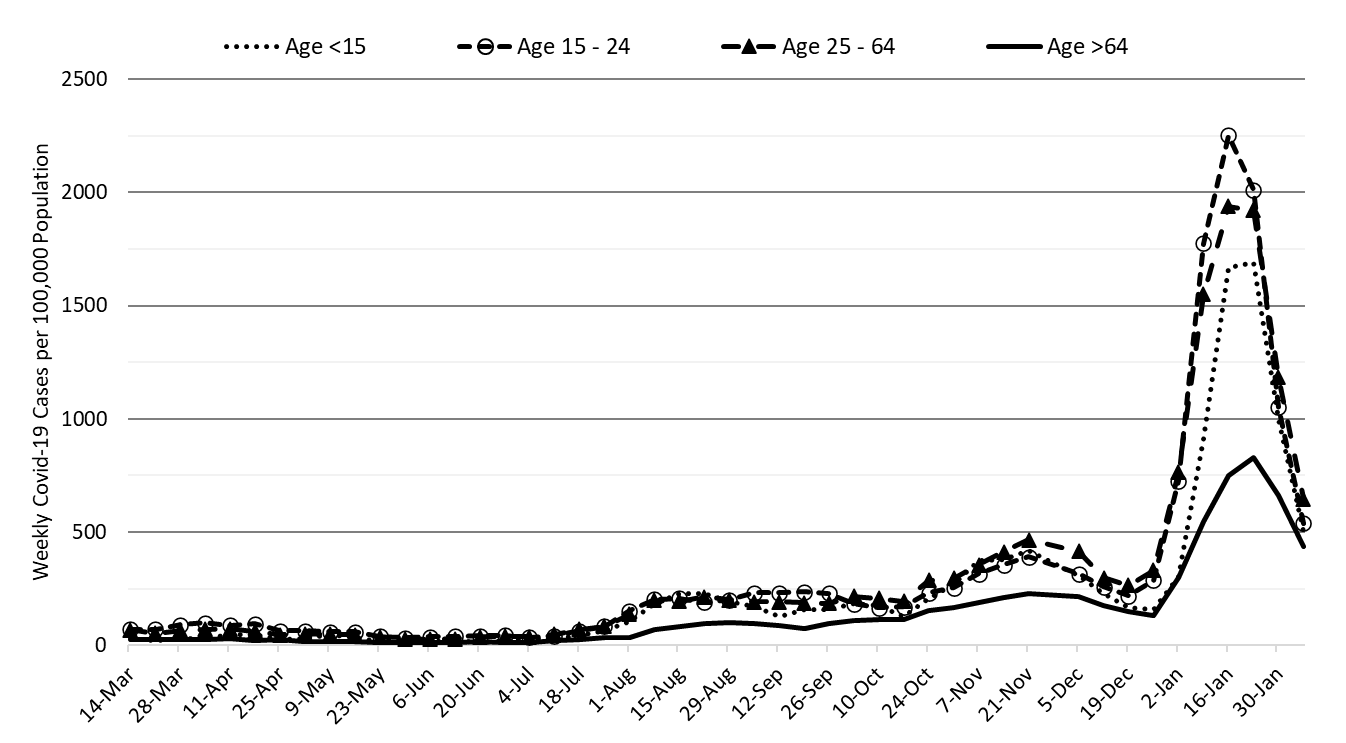
Figure 10. COVID-19 Weekly Incidence in Pima County by Age Group January 10, 2021 versus February 6, 2022.
Transmission by age group is shown in Figure 10.
Summary
- Arizona continues to experience very high levels of community transmission. Test positivity remains high reminding us that test capacity, accessibility, and/or uptake is wholly inadequate. Arizona, like much of the United States, is emerging from its most recent pandemic wave. Transmission (cases) has peaked but risk of infection remains high.
- As of February 6th, new cases were being diagnosed at a rate of 560 cases per 100K residents per week. Rates peaked on or about January 15th at 2017 cases per 100K residents per week, somewhat lower than other states, perhaps due to less testing.
- The risk of Omicron infection will remain high for the remainder of February. Remember, the CDC defines high community transmission as levels >100 cases per 100K residents per week. We’re a far cry from that!
- COVID-19 hospital occupancy in both the wards and ICUs are decompressing. Even so, access to care continues to be constrained by both COVID-19 occupancy and staff shortages owing to infections among healthcare workers.
- Weekly COVID-19 deaths peaked at 552 deaths the week ending December 12th. However, weekly totals in the low-400s are likely for another couple of weeks. So far, at least 27073 Arizonans have lost their lives to COVID-19.
- What does the future of COVID-19 look like? The UK’s Scientific Advisory Group for Emergencies has something to say about it. I tend to agree with their Central Optimistic and Central Pessimistic scenarios; I’m hoping for the former, but we should prepare for the latter.
- What’s going on with the UK and BA.2? Well, here is the latest UK Technical Briefing. One of the more interesting factoids (page 21) is that the median serial interval for BA.2 is 2.7 days (lightening fast) compared to 3.3 days for BA.1 (thunder fast). The other factoid is the adjusted risk of ICU admission for Omicron is 0.5 (0.2 – 1.2) – which is consistent with the clinical picture – Omicron less severe.
- Is BA.2 here in Arizona? It is present, but in low numbers (5%). However, we should expect it to become the dominant variant over the coming months (not weeks like BA.1). The implication is that it will be a bit more difficult to push down transmission rates. https://pathogen.tgen.org/covidseq-tracker/
Appendix Images
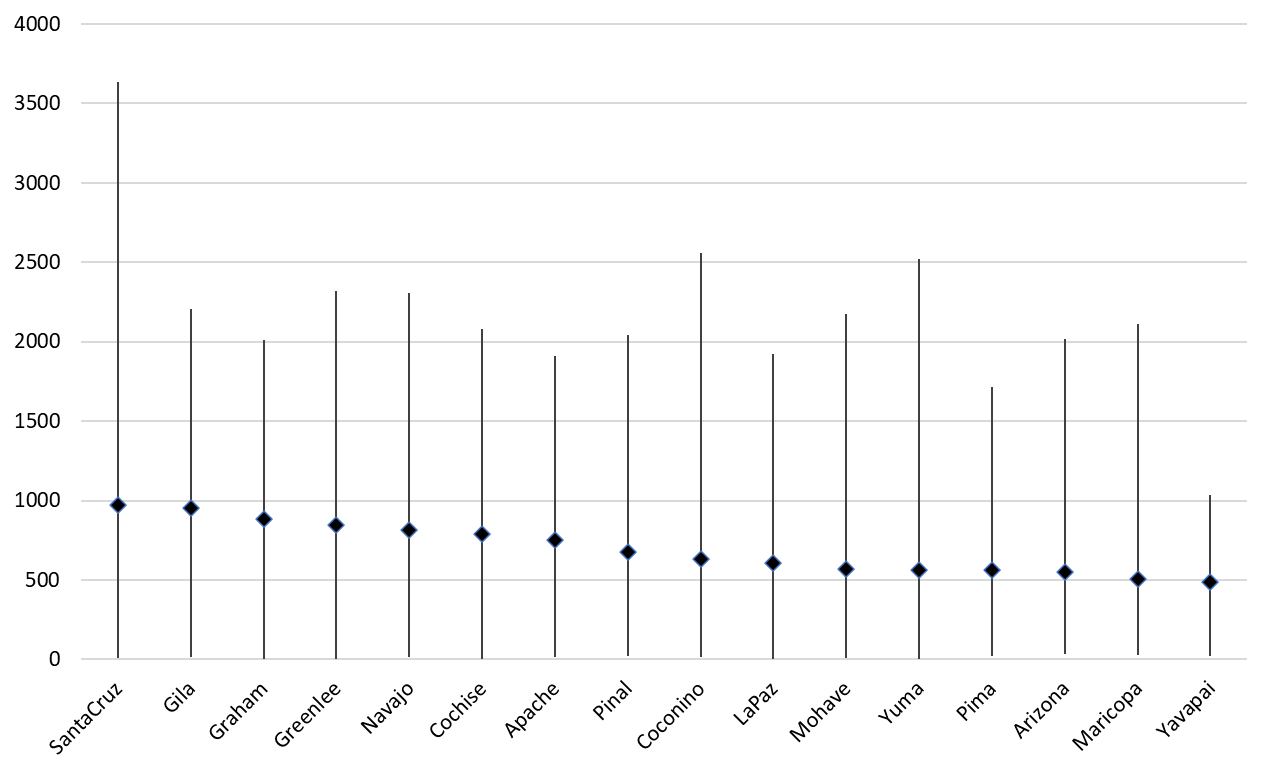
APPENDIX Figure 1. Minimum, Maximum and Current COVID-19 Cases Rates per 100K Residents per Week by County April 1, 2020 – February 6, 2022.

APPENDIX Figure 2. COVID-19 Age-Standardized Case Fatality Rate March 22, 2020 – January 2, 2022 (October 25, 2020 case distribution).
Forecast reports to date, available as PDFs
Download PDF to view additional charts of Arizona counties, available in appendix of report.
2021 Reports
Based on what we know now about this pandemic, we support guidelines for social distancing to slow the spread of the virus and urge everyone to follow the recommendations provided by the Centers for Disease Control and Prevention (CDC) to protect yourself, your family, your neighbors, and your employees. Please heed the recommendations as provided by the CDC.
COVID covid coronavirus virus covid19 corona forecast model