
Weekly Arizona COVID-19 Data Report – February 4
Note this forecast page is not the most recent forecast available.
View the most current forecast report
Researcher Analyzes Arizona COVID-19 Spread Models for Decision-Makers
The following information regarding the spread of COVID-19 in Arizona was prepared by Joe Gerald, MD, PhD, a researcher at the Mel and Enid Zuckerman College of Public Health (MEZCOPH) at the University of Arizona. This information has also been reviewed by other MEZCOPH faculty.
This data were obtained from the Arizona Department of Health Services COVID-19 webpage and reflect conditions in Arizona as of February 4, 2022.
This information is intended to help guide our response to the outbreak. It is not intended to predict how this pandemic will evolve. Rather, this model extrapolates what might occur if current conditions remain unchanged. As regional authorities and healthcare providers respond, their actions are expected to mitigate the worst consequences of this pandemic.

COVID-19 Disease Outbreak Forecast
Arizona State and Pima County
Updated February 4, 2022
Disclaimer: This information represents my personal views and not those of The University of Arizona, the Zuckerman College of Public Health, or any other government entity. Any opinions, forecasts, or recommendations should be considered in conjunction with other corroborating and conflicting data. Updates can be accessed at https://publichealth.arizona.edu/news/2021/covid-19-forecast-model.
|
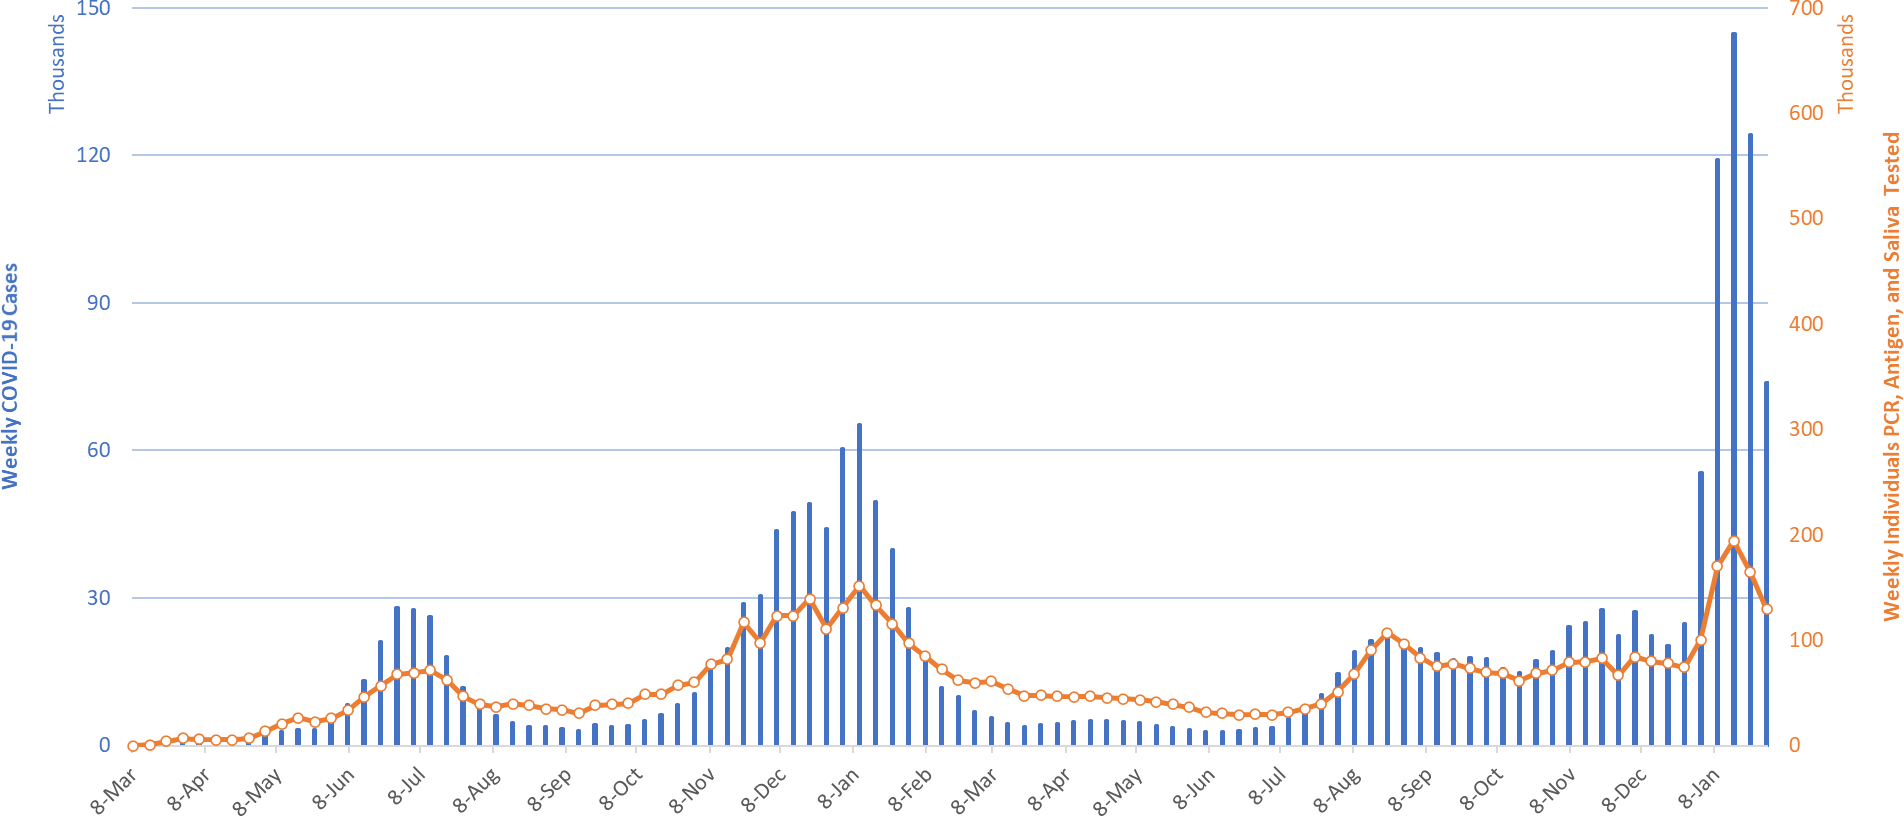
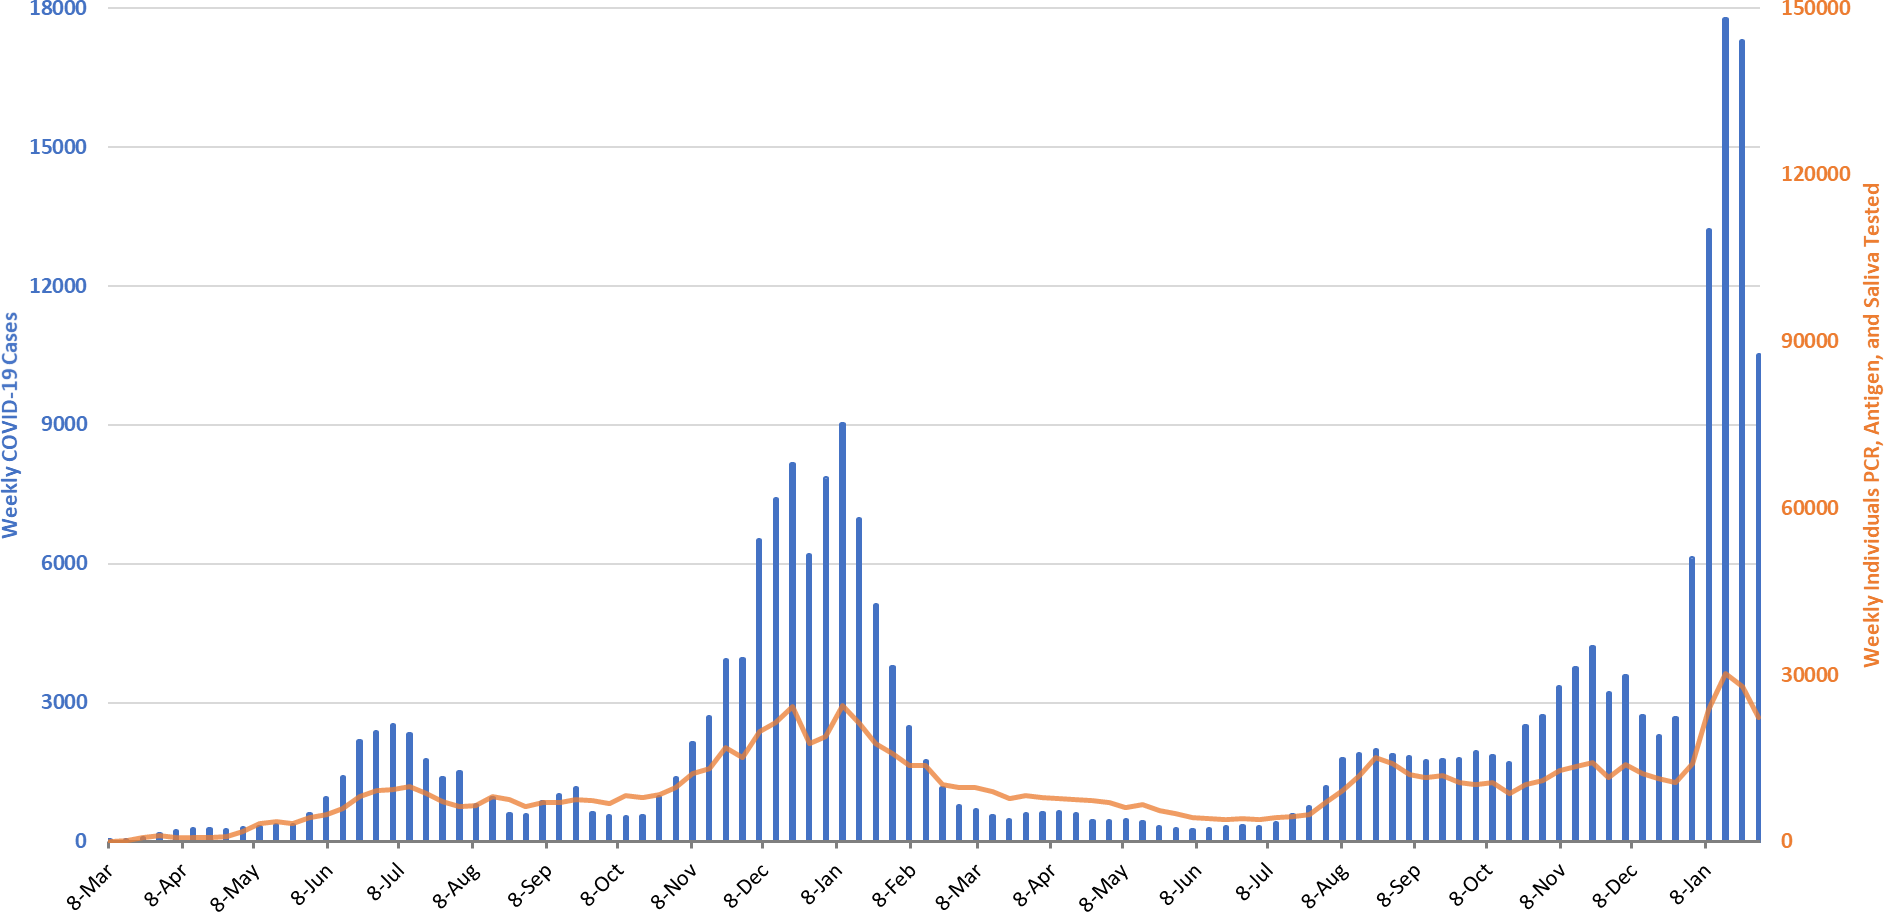
Figure 1. Weekly COVID-19 Cases in Arizona and Number of Individuals Undergoing COVID-19 Diagnostic Testing March 1, 2020 – January 30, 2022. |
For the week ending January 30th, at least 73828 Arizonans were diagnosed with COVID-19, a 40% decrease from the 122559 cases reported the prior week (Figure 1). Last week’s initial tally has been updated to 124255 cases (+1696, +1%), indicating turn-around time for test results is returning to baseline. It is important to recognize that this week’s tally is still higher than the January 2021 peak! Therefore, the risk of contracting Omicron remains extremely high. It is still too soon for institutions and/or individuals to safely relax their mitigation practices as the level of transmission is more important than the direction of change.
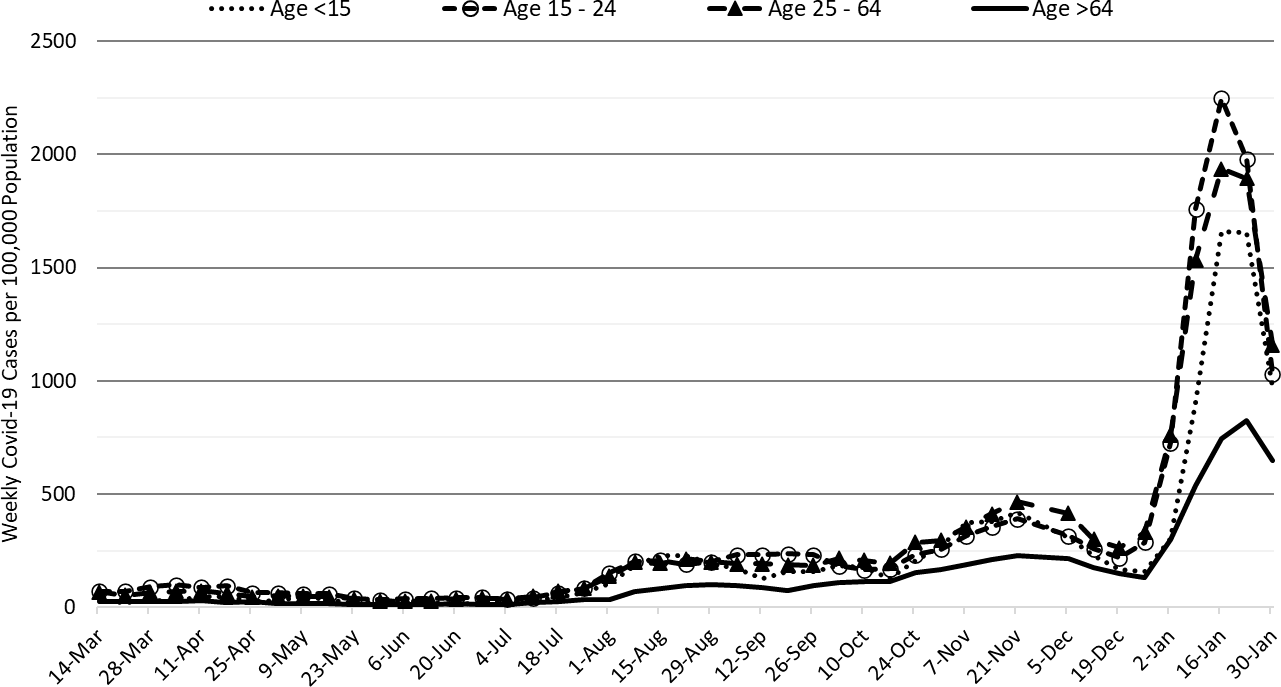
Cases are currently being diagnosed at a rate of at 1014 cases per 100K residents per week. Omicron peaked statewide about January 15th at 2004 cases per 100K residents per week. Rates are highest among those 25 - 64 years and lowest among those ≥65 years, 1131 and 801 cases per 100K residents, respectively (Figure 2a following page). Arizona’s remains stuck in 7th place with the nation’s new case leaders being Alaska (1921), North Dakota (1303), Washington (1281), West Virginia (1278), and Wyoming (1260). Given how little we are trying, I’m not sure why we aren’t winning. It may well be limited testing capacity and accessibility. On the bright side, no one can accuse us of being “try-hards.”
According to the CDC, 41% of Arizona adults and 57% of its seniors have obtained a third dose booster. The ADHS Vaccine Dashboard shows weekly doses delivered fell under 100K doses for the first time since September 2021. Our slow, plodding progress is becoming ploddier. The CDC recommends everyone ≥12 years who received Pfizer primary sequence should receive a booster; ≥18 years if they received the Moderna primary sequence.
|
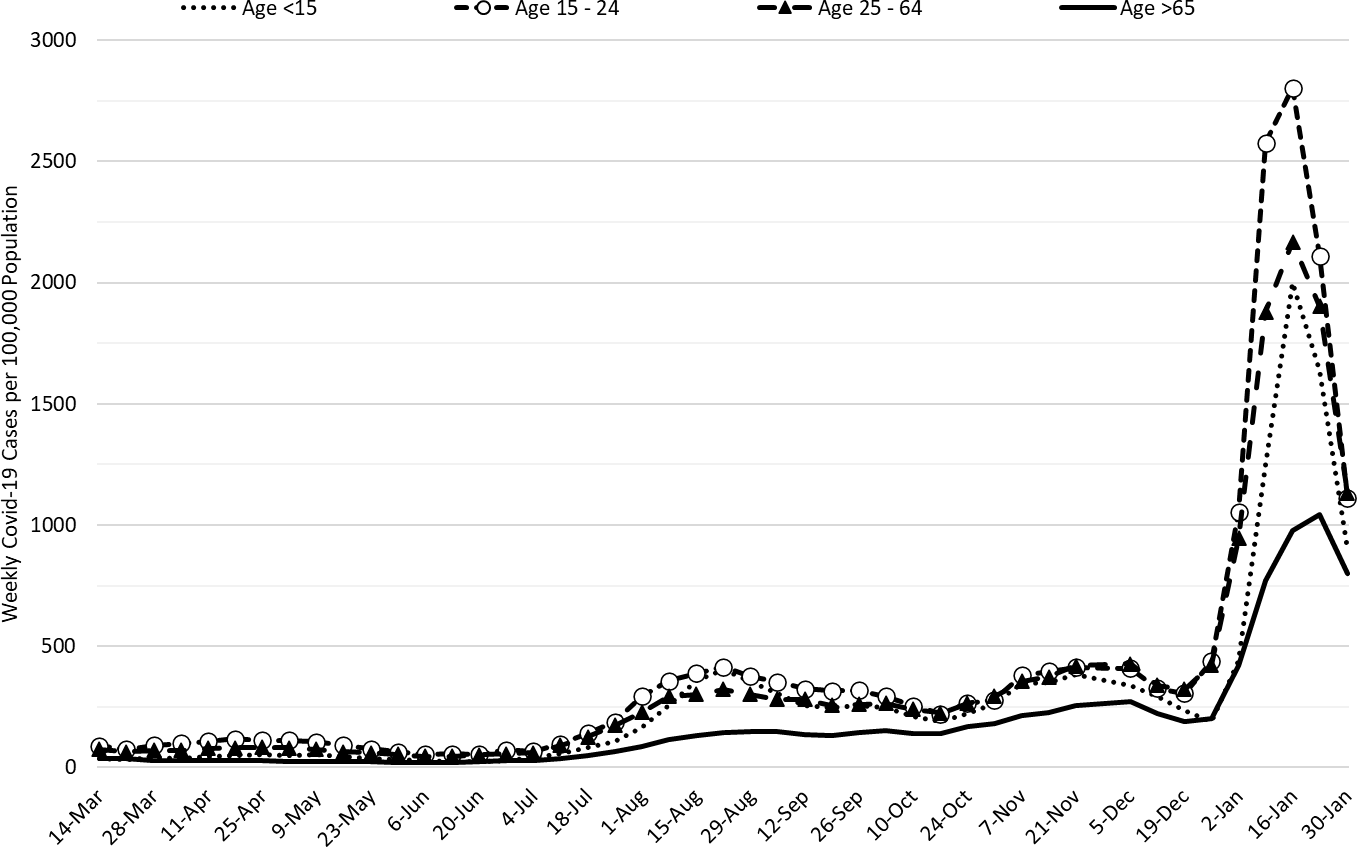
Figure 2a. COVID-19 Cases in Arizona by Age Group March 7, 2021 – January 30, 2022 (Data from week ending November 28 suppressed). |
|
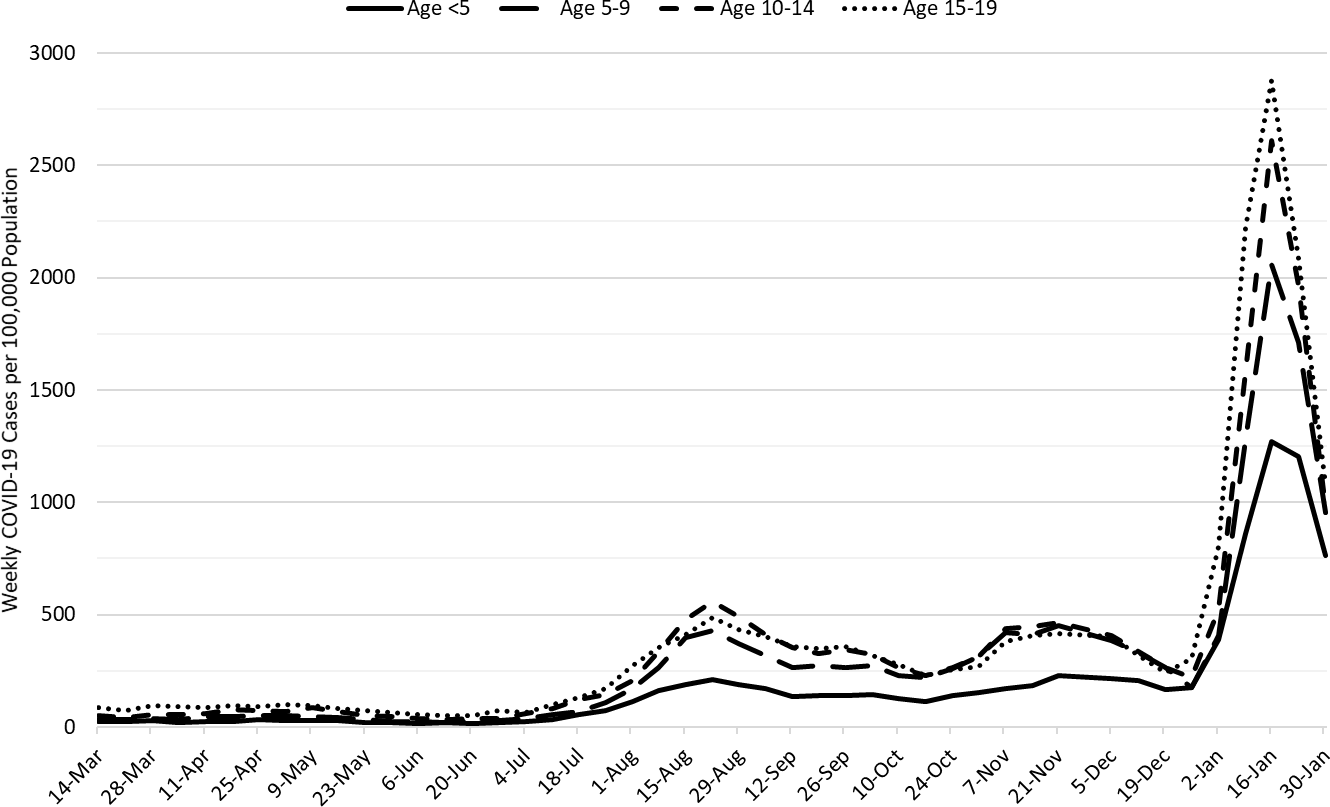
Figure 2b. COVID-19 Weekly Incidence in Arizona among children March 7, 2021 – January 30, 2022. |
Figure 2a shows transmission among all age groups is decreasing with much less separation by age than during the peak. Figure 2b shows that transmission among children is also declining across all age groups. A quick shout-out to all of Arizona’s K – 12 educators, staff, and administrators for taking one on the chin last month. Student and staff absenteeism should be waning. February will still be a difficult month but at least there is a light at the end of the tunnel, and it’s probably not the train.
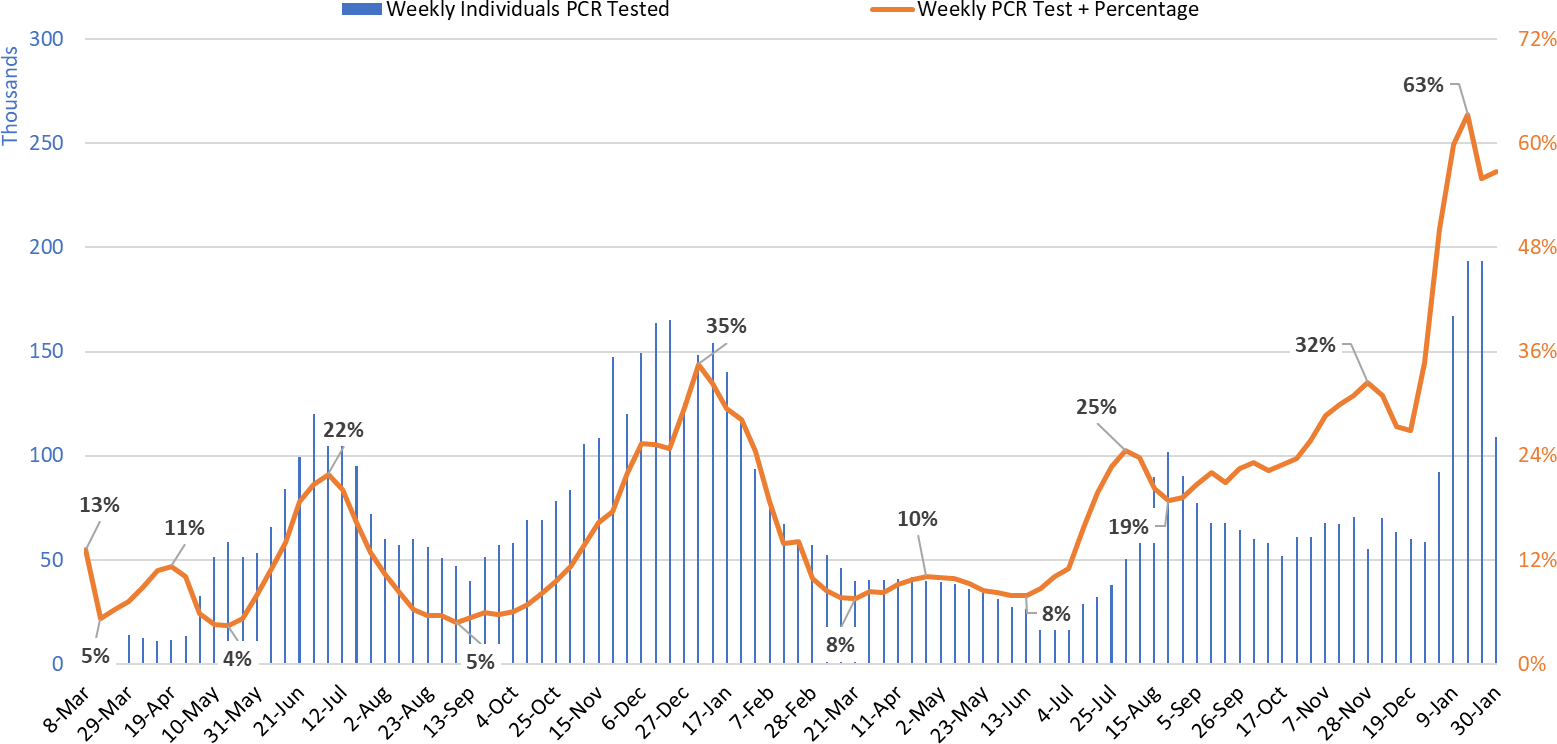
Test positivity showed un unexpected blip with positivity increasing ever so slightly to 56% (Figure 3). There is a hitch in our data that we couldn’t run down this week, so I’m a bit skeptical of that this week’s positivity is correct. It’s high, but probably not this high. Will resolve before next week’s update.
|
Figure 3. Weekly Number of Patients Undergoing Traditional Nasopharyngeal PCR Testing and Associated Percent Positivity March 1, 2020 – January 30, 2022. |
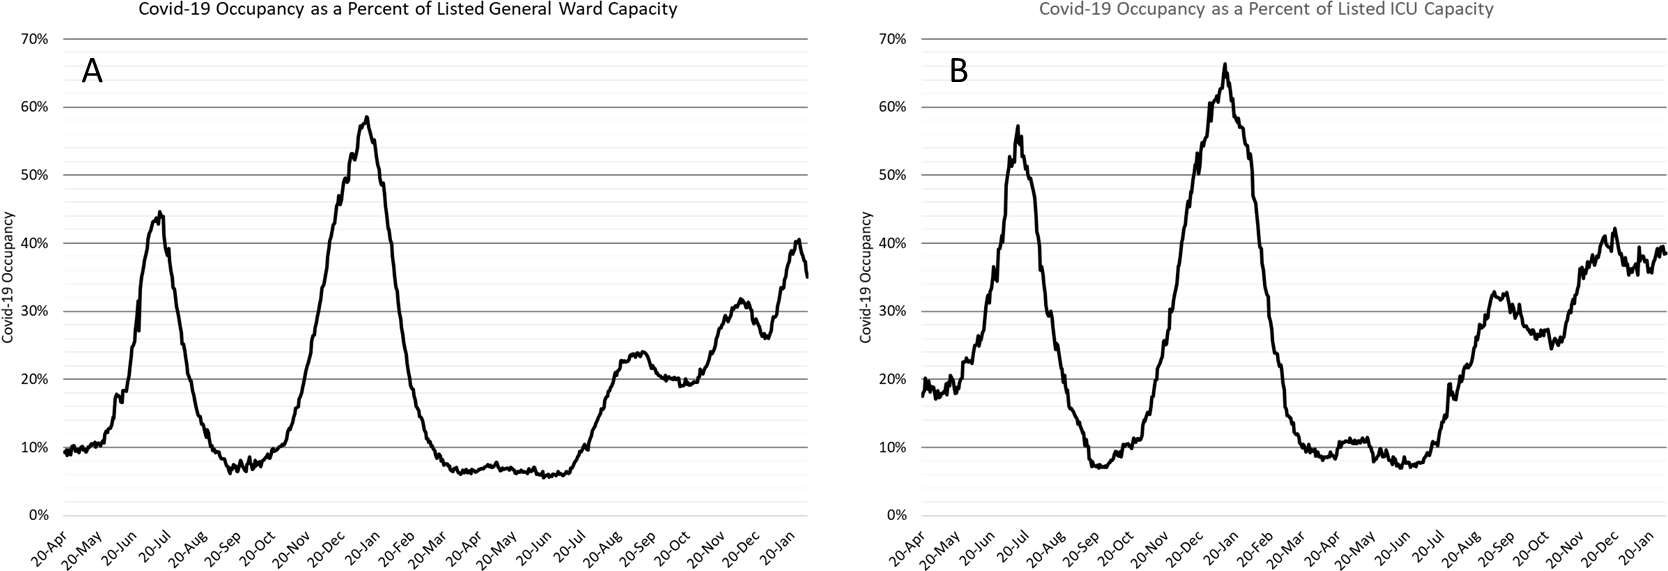
As of February 3rd, 3064 (35%) of Arizona’s 8746 general ward beds were occupied by COVID-19 patients, a 14% decrease from last week’s 3559 occupied beds (Figure 4 and Figure 5 Panel A). Another 526 (6%) beds remained available for use which is higher than last week’s 405 available beds. Six-hundred thirty-two (632, 39%) of Arizona’s 1642 ICU beds were occupied by COVID-19 patients, unchanged from last week’s 636 occupied beds (Figure 4 and Figure 5 Panel B). An additional 117 (7%) ICU beds remained available for use which is higher than last week’s 92 beds.
|
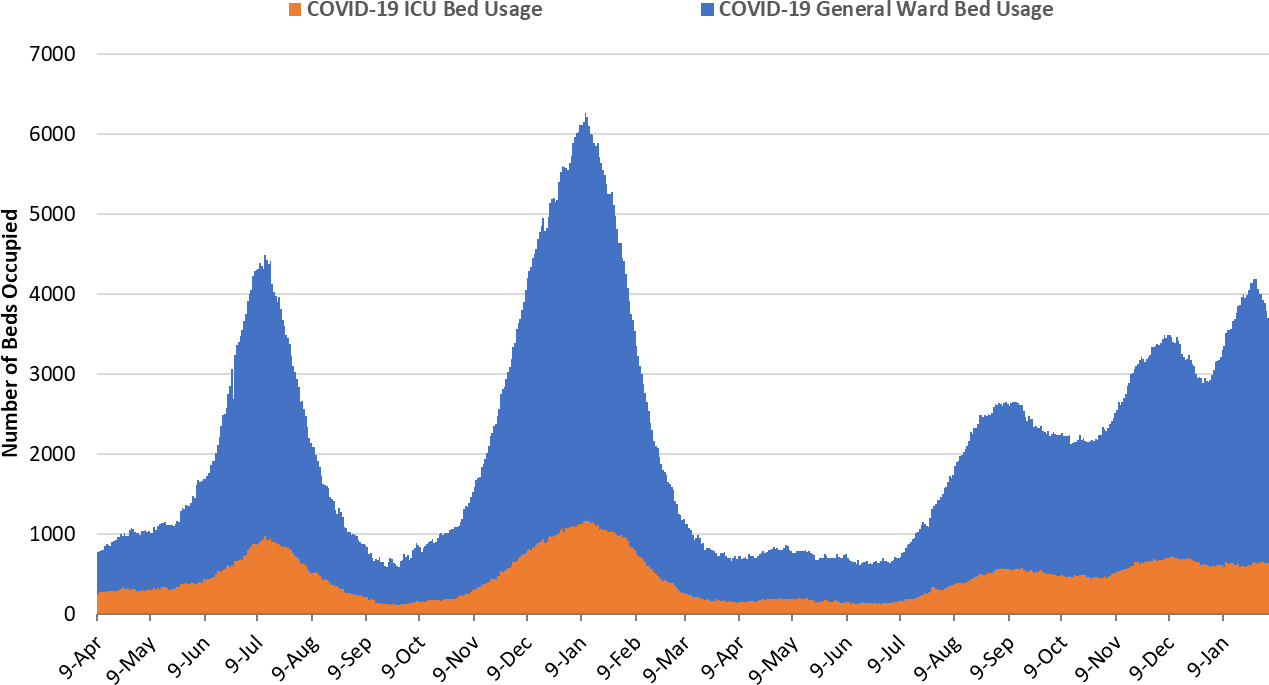
Figure 4. Arizona Daily COVID-19 General Ward and ICU Census April 9, 2020 – February 3, 2022. |
In a sign of relief, we fell below 4000 combined occupancy this week. Nevertheless, hospitals remain very, very busy. They have now experienced 174 consecutive days with a combined occupancy >2000 patients whereas the summer 2020 and winter 2021 saw 57 and 98 days, respectively. We have now experienced 69 days with >3000 combined occupancy whereas the summer 2020 and winter 2021 waves saw 35 and 78 days, respectively.
|
Figure 5. COVID-19 Occupancy as a Percent of Listed General Ward (A, left) and ICU (B, right) Capacity in Arizona April 20, 2020 – February 3, 2022. |
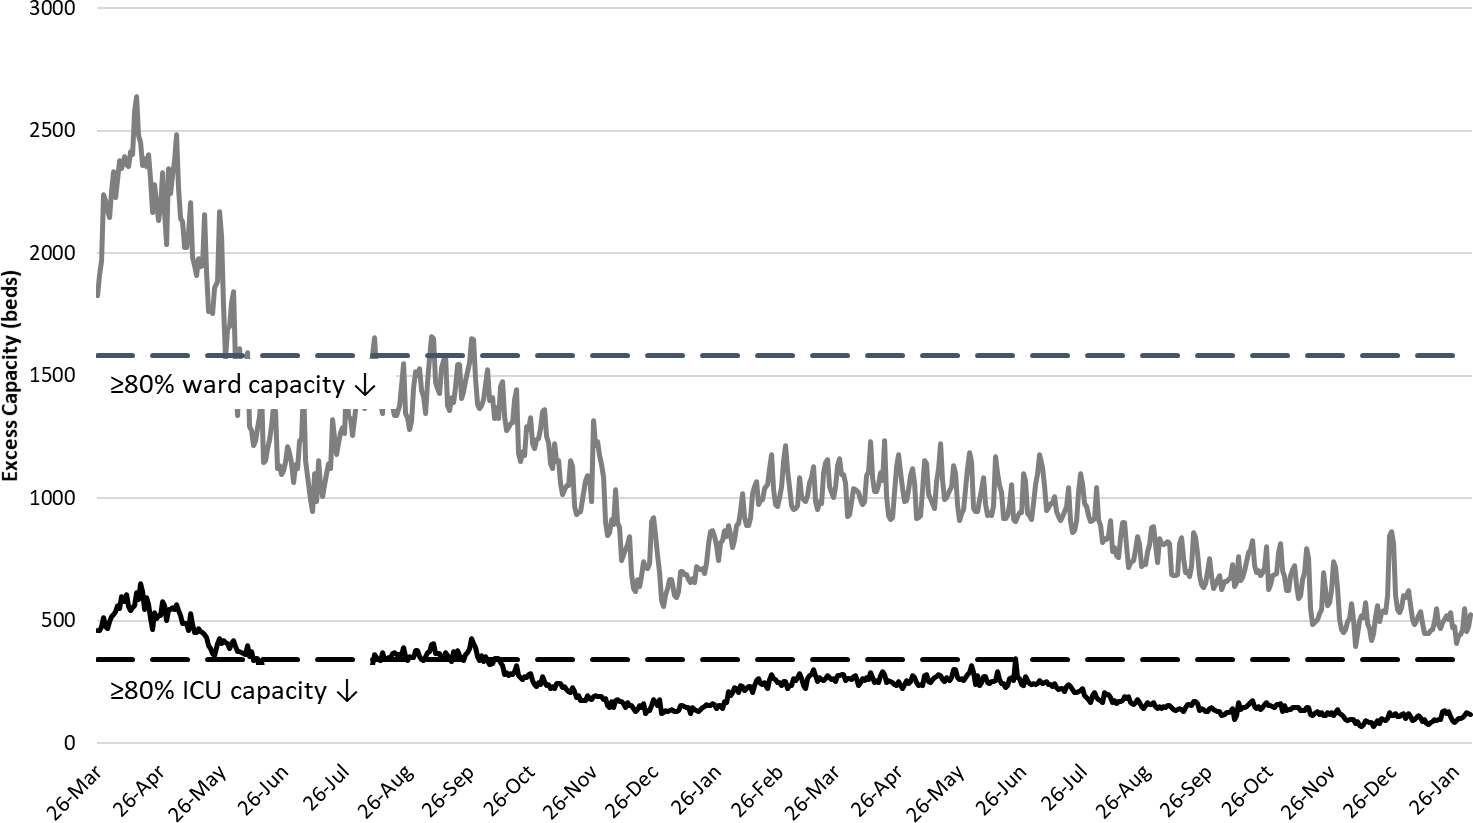
Hospital occupancy remains far above seasonal levels with safety margins, as measured by available beds, remaining near historical lows (Figure 6). Hospitals should prepare for >30% ward occupancy and ICU occupancy through mid-late February.
|
Figure 6. Observed Excess Non-Surge General Ward and ICU Capacity in Arizona Mar 26, 2020 – Feb 3, 2022. |
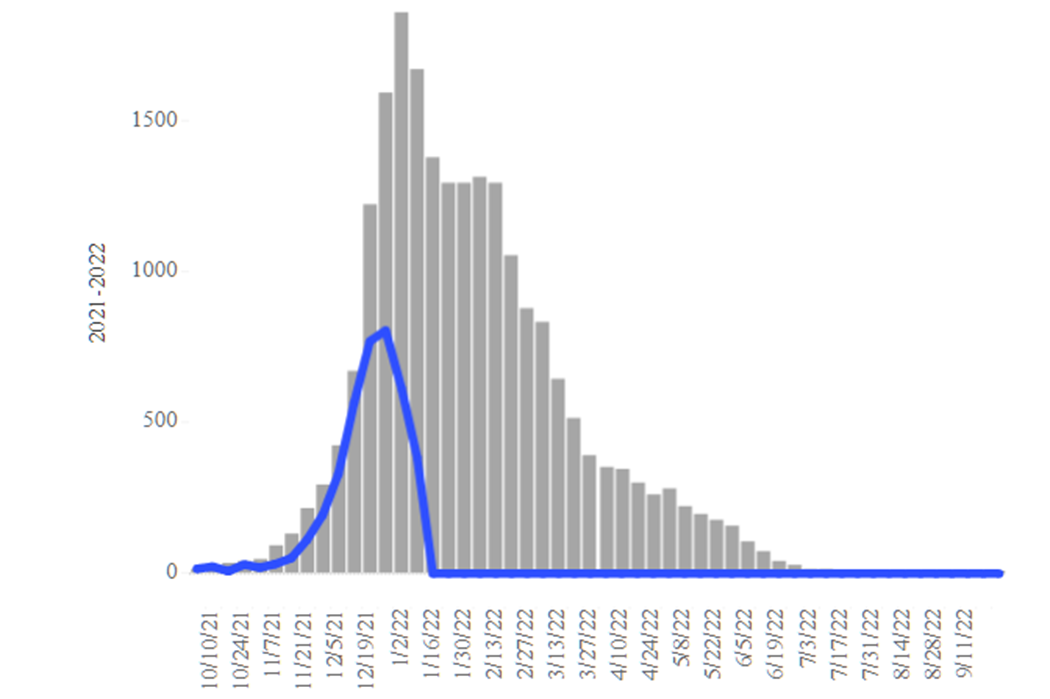
Seasonal influenza cases in Arizona (blue line) has fizzled, at least as compared to the state’s 5-year historical average (grey bars, Figure 7). COVID-19 mitigation efforts may have slowed influenza transmission. Hospitals should begin to get relief from fewer COVID-19 and fewer influenza cases over the coming weeks.
|
Figure 7. Arizona Influenza Cases in 2021 (blue) versus 5-Year Historical Average (grey) |
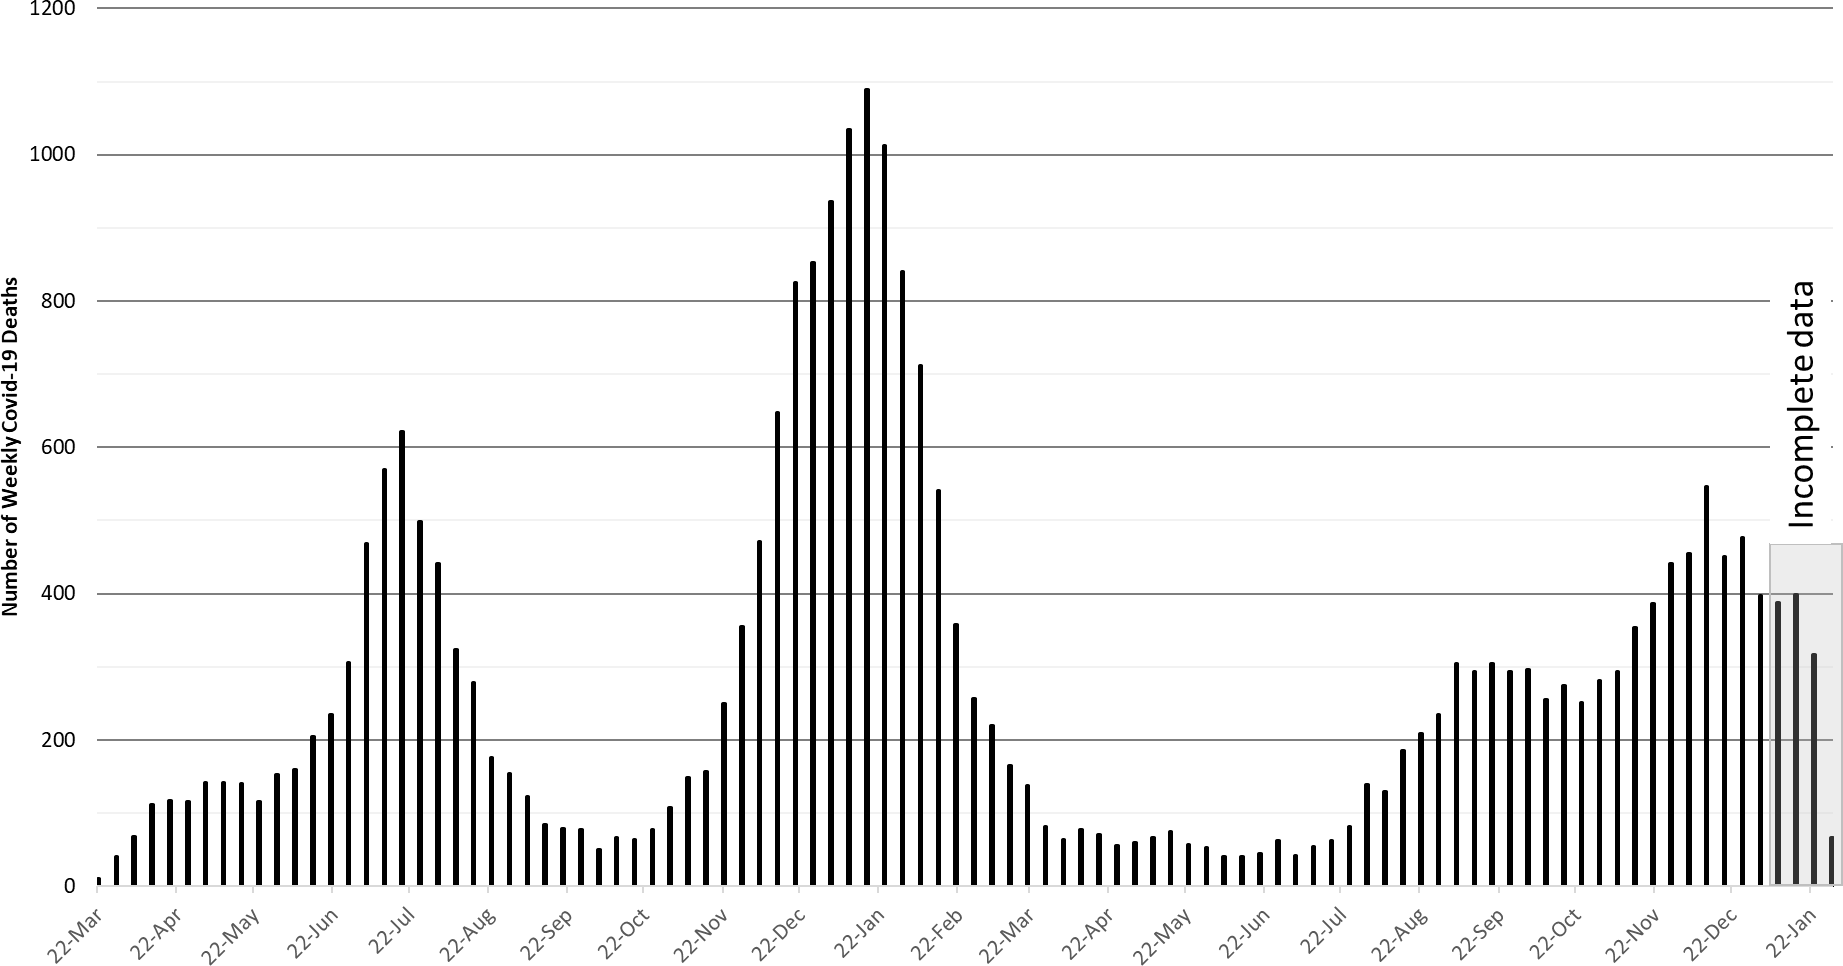
The week ending December 12th has now recorded 547 deaths to date. Hopefully, this will be the only week this happens during the Delta - Omicron waves (Figure 8). At least 26530 Arizonans have lost their lives to COVID-19. A mortality report from the AzPHA indicates that official statistics undercount actual deaths.
|
Figure 8. Weekly Arizona COVID-19 Deaths March 16, 2020 – January 30, 2022. |
Pima County Outlook
|
Figure 9. Weekly COVID-19 Cases in Pima County and Number of Individuals Undergoing COVID-19 Diagnostic Testing March 1, 2020 – January 30, 2022. |
|
Figure 10. COVID-19 Weekly Incidence in Pima County by Age Group January 10, 2021 versus January 30, 2022. |
For the week ending January 30th, 10507 Pima County residents were diagnosed with COVID-19, a 38% decrease from the initial tally of 17055 cases last week (Figure 9). Transmission by age group is shown in Figure 10.
Summary
 Arizona continues to experience historic levels of community transmission attributable to the dominant Omicron variant. Test positivity is insanely high reminding us that test capacity, accessibility, and/or uptake is wholly inadequate. Arizona, like much of the United States, is emerging from its most recent pandemic wave. Transmission (cases) has peaked but risk of infection remains high as shown in the box plot of the distribution of the 7-day moving average for each day since the pandemic began in March 2020. Current rates are represented by the red dot.
- As of January 30th, new cases were being diagnosed at a rate of 1014 cases per 100K residents per week. Rates peaked on or about January 15th at 2004 cases per 100K residents week, somewhat lower than other states, perhaps due to less testing.
- The risk of Omicron infection will remain extremely high for many weeks. Remember, the CDC defines high community transmission as levels >100 cases per 100K residents per week. We’re a far cry from that!
- Even if Arizona is moving down the backside of the wave, it is still important that all adults who previously completed the 2-dose primary sequence to obtain a booster, particularly those 50+ years of age.
- COVID-19 hospital occupancy in the wards is now moderating and hopefully the ICUs will begin to decompress soon. Hospitals will be burdened by >30% occupancy in general wards and in the ICU for several weeks yet. Access to care continues to be restricted by both COVID-19 occupancy and staff shortages owing to infections among healthcare workers.
- Weekly COVID-19 deaths likely peaked at 547 deaths the week ending December 12th. However, weekly totals in the mid-400s are likely for several more weeks. So far, at least 26530 Arizonans have lost their lives to COVID-19.
Forecast reports to date, available as PDFs
Download PDF to view additional charts of Arizona counties, available in appendix of report.
February 4
2021 Reports
Based on what we know now about this pandemic, we support guidelines for social distancing to slow the spread of the virus and urge everyone to follow the recommendations provided by the Centers for Disease Control and Prevention (CDC) to protect yourself, your family, your neighbors, and your employees. Please heed the recommendations as provided by the CDC.
COVID covid coronavirus virus covid19 corona forecast model