
Weekly Arizona COVID-19 Data Report – January 21
Note this forecast page is not the most recent forecast available.
View the most current forecast report
Researcher Analyzes Arizona COVID-19 Spread Models for Decision-Makers
The following information regarding the spread of COVID-19 in Arizona was prepared by Joe Gerald, MD, PhD, a researcher at the Mel and Enid Zuckerman College of Public Health (MEZCOPH) at the University of Arizona. This information has also been reviewed by other MEZCOPH faculty.
This data were obtained from the Arizona Department of Health Services COVID-19 webpage and reflect conditions in Arizona as of January 21, 2022.
This information is intended to help guide our response to the outbreak. It is not intended to predict how this pandemic will evolve. Rather, this model extrapolates what might occur if current conditions remain unchanged. As regional authorities and healthcare providers respond, their actions are expected to mitigate the worst consequences of this pandemic.

COVID-19 Disease Outbreak Forecast
Arizona State and Pima County
Updated January 21, 2022
Disclaimer: This information represents my personal views and not those of The University of Arizona, the Zuckerman College of Public Health, or any other government entity. Any opinions, forecasts, or recommendations should be considered in conjunction with other corroborating and conflicting data. Updates can be accessed at https://publichealth.arizona.edu/news/2021/covid-19-forecast-model.
|
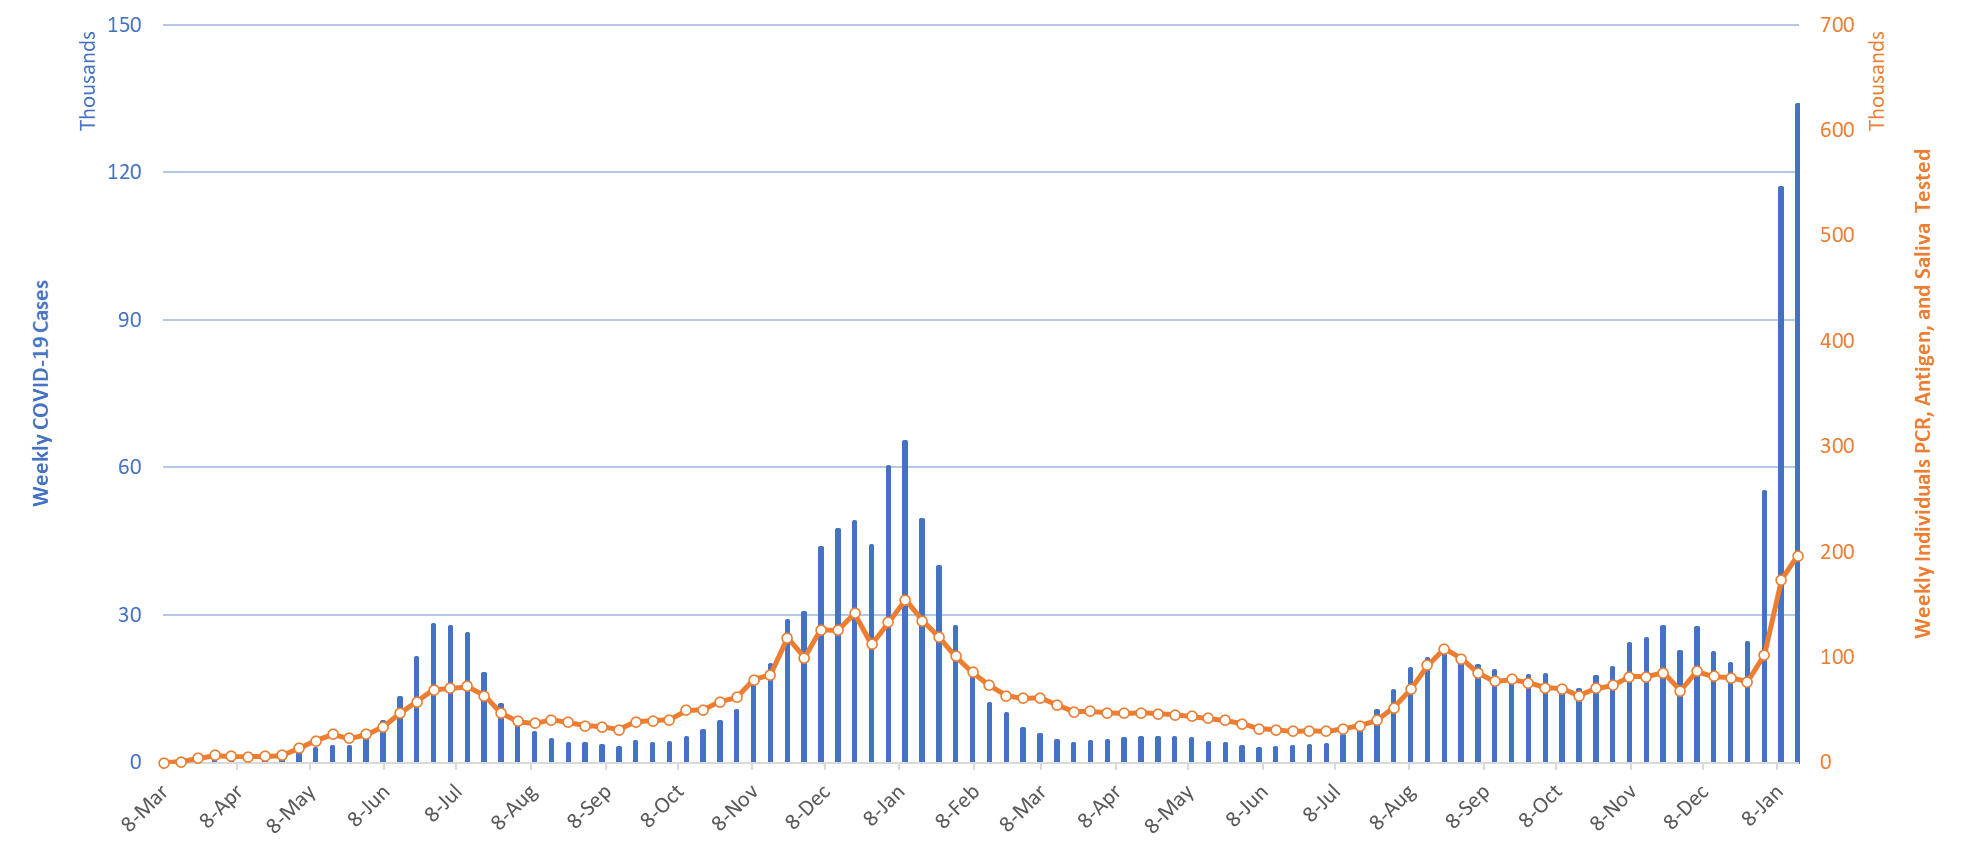
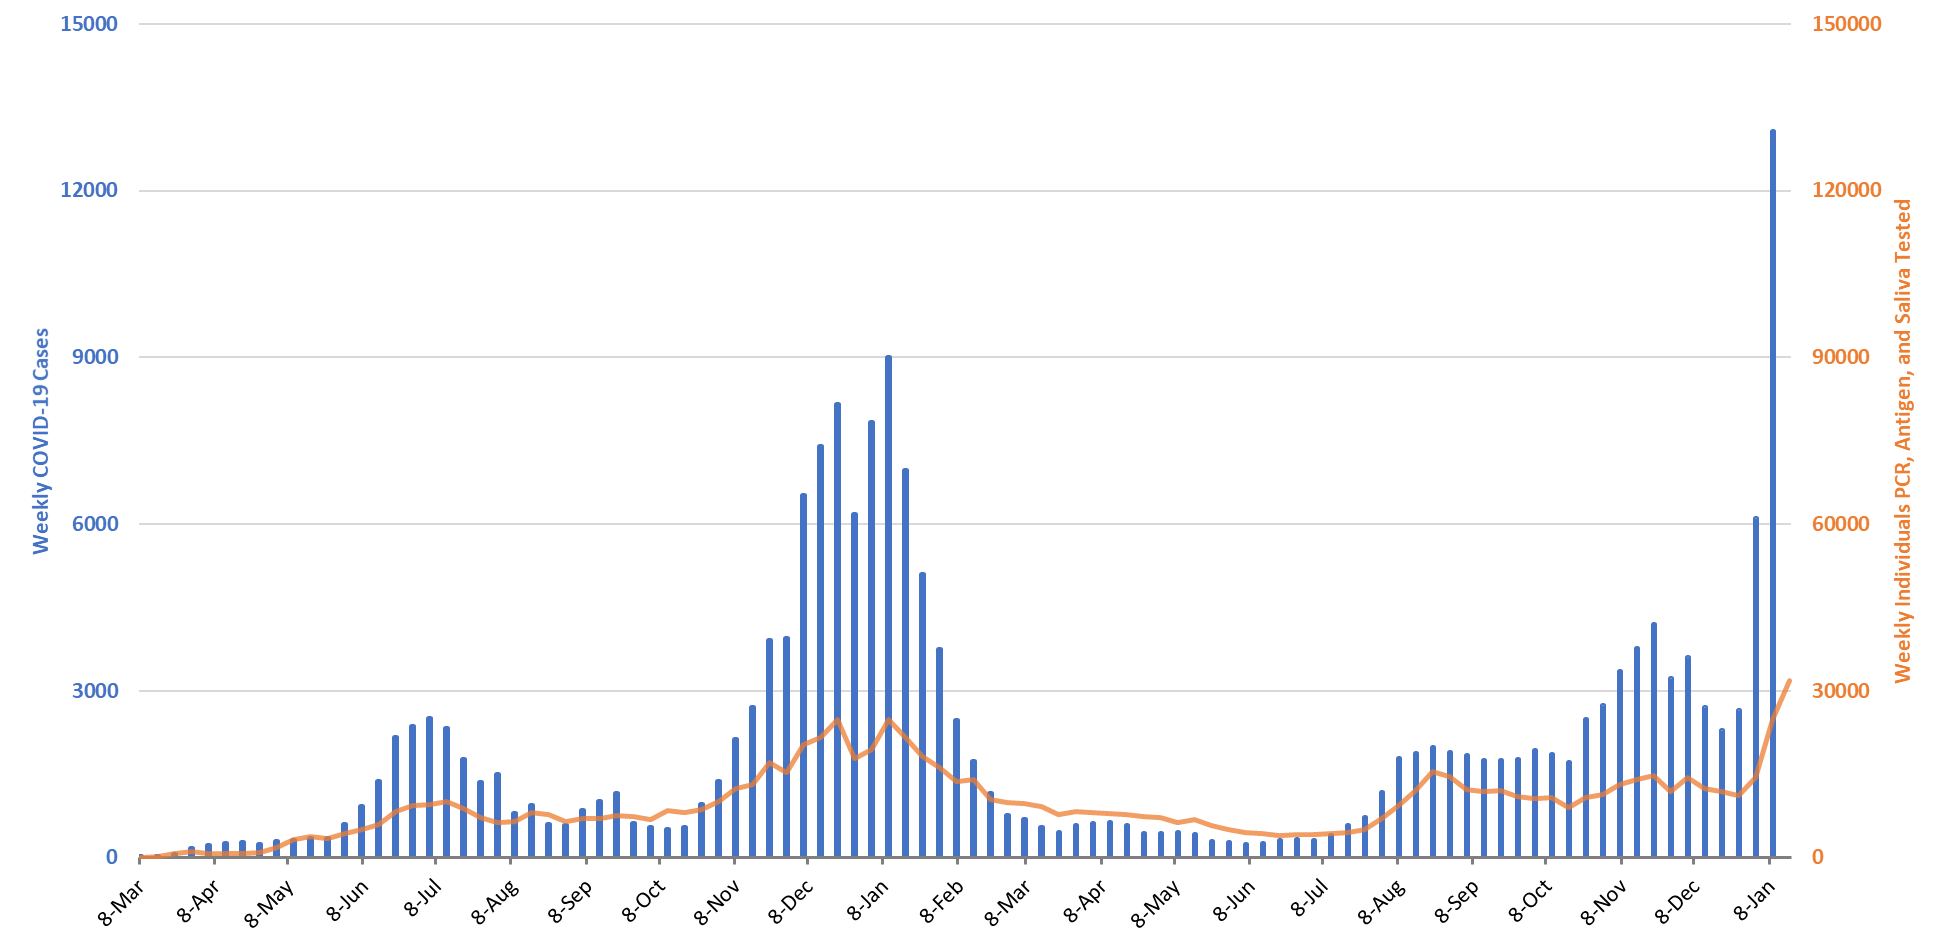
Figure 1. Weekly COVID-19 Cases in Arizona and Number of Individuals Undergoing COVID-19 Diagnostic Testing March 1, 2020 – January 16, 2022. |
For the week ending January 16th, at least 133806 Arizonans were diagnosed with COVID-19, a 23% increase from the 108783 cases reported during the prior week (Figure 1). Last week’s initial tally has since been updated to 116868 (+8085, +7%) cases. Given the marked slowing in week-to-week totals, Omicron has likely peaked in Arizona as you read this. While achieving peak rates would be a welcomed milestone, the risk of contracting Omicron will remain extremely on the backside of the peak. It is too soon for institutions and/or individuals to safely relax their mitigation practices. The level of transmission is a more important determinant of risk than the direction of change.
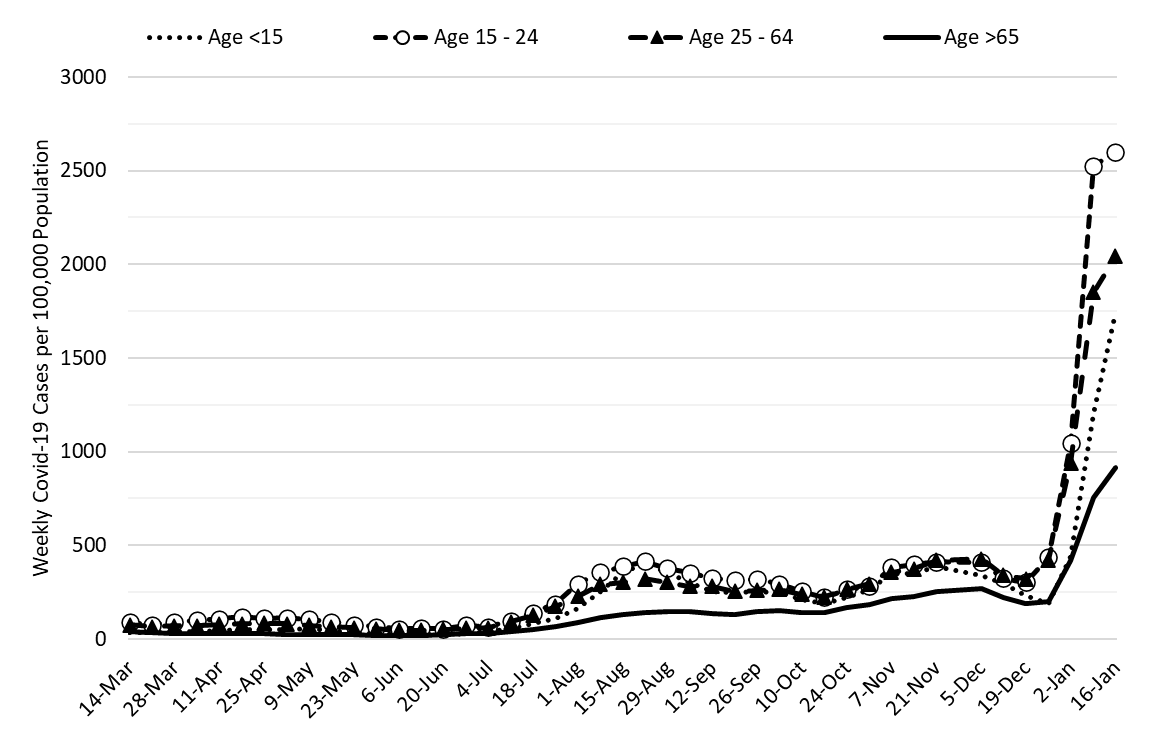
Cases are currently being diagnosed at a rate of 1896 cases per 100K residents per week. Once the tally is complete, peak Omicron will likely reach ~2000 cases per 100K residents. Of course, the actual toll will be much higher owing to substantial undercounting of cases. Rates remain highest among those 15 – 24 years and lowest among those ≥65 years, 2598 and 914 cases per 100K residents, respectively (Figure 2a below).
While Arizona’s new case ranking has risen to 12th, we still fall short of the rates seen among the nation’s leaders: Wisconsin (2786), Rhode Island (2752), Utah (2388), South Carolina (2260), and Hawaii (2181). Given our test positivity is insanely high, inadequate testing could explain why our rates seem a bit better in comparison.
According to the CDC, 38% of Arizona adults and 56% of its seniors have obtained a third dose booster. Fortunately, the primary 2-dose Pfizer sequence retains 70% protection against hospitalization from Omicron. The ADHS Vaccine Dashboard shows weekly doses delivered fell just shy of 150K doses. So, we continue to make slow, plodding progress. The CDC recommends everyone ≥12 years who received Pfizer primary sequence should receive a booster; ≥18 years if they received the Moderna primary sequence.
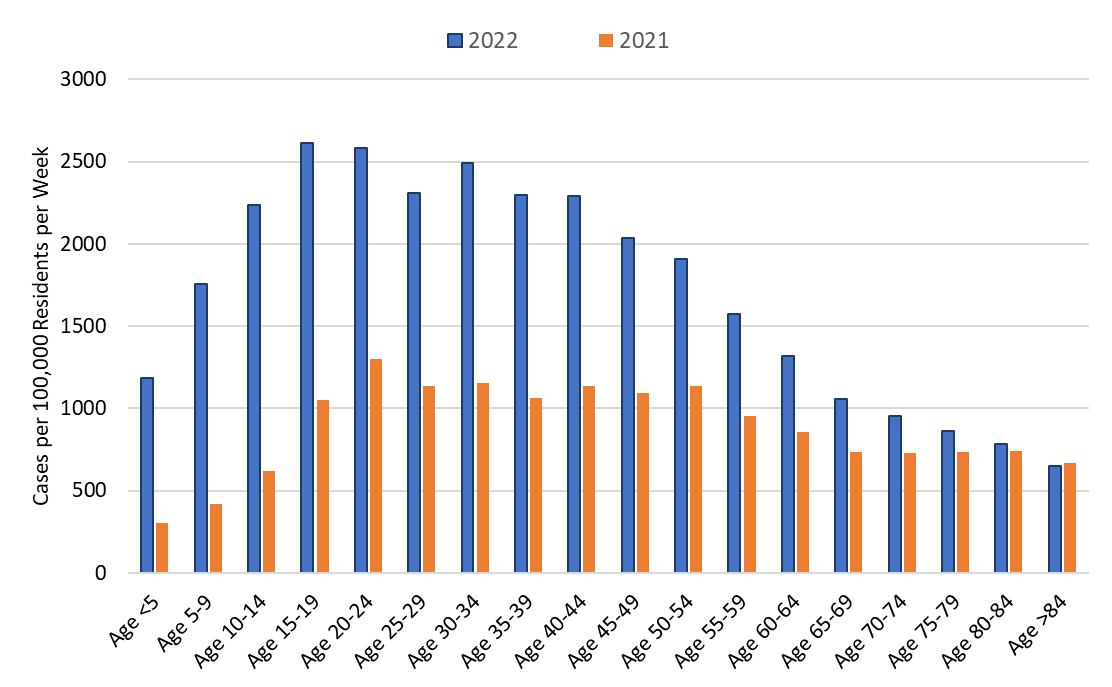
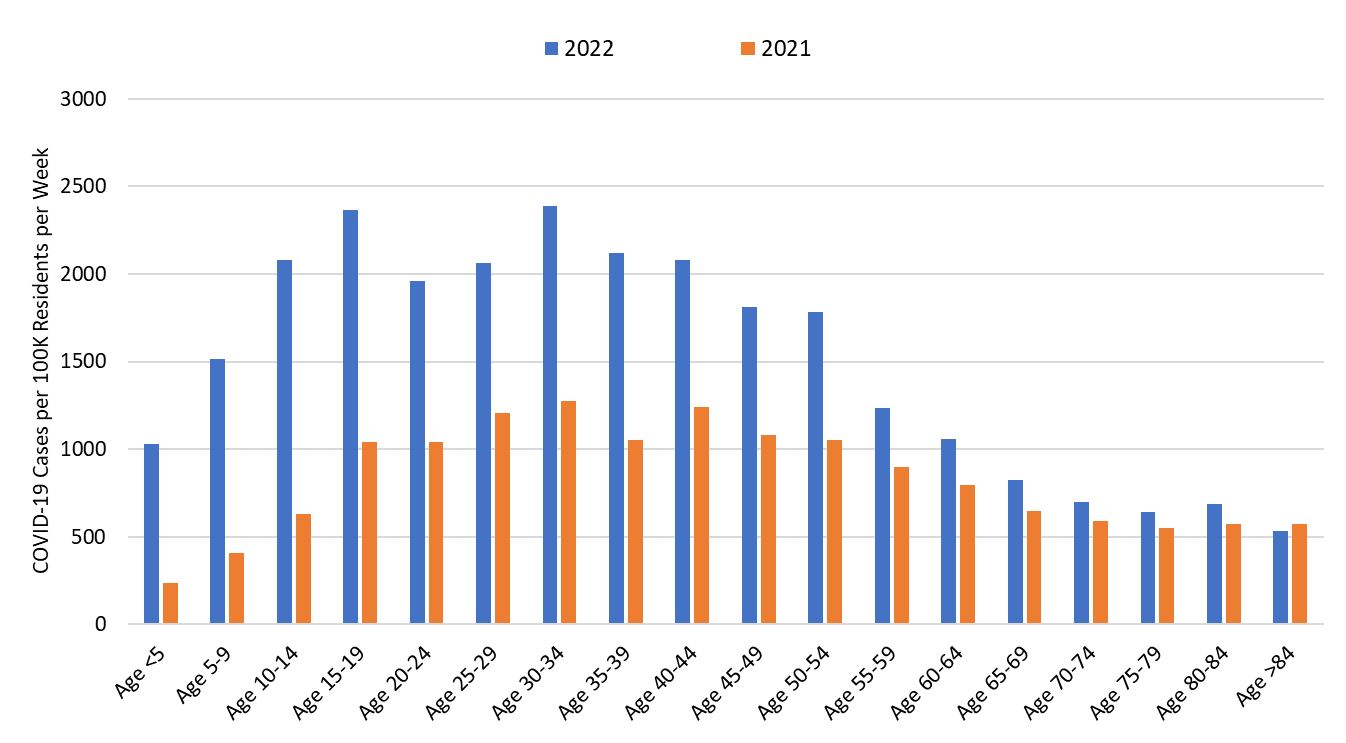
Figure 2a shows transmission among all age groups continues to increase with some moderation among adolescents, working-age adults, and the elderly. Rates among children continue their rapid increase. Figure 2b compares this week’s COVID-19 incidence by age group with last year’s January 2021 peak. Transmission is more widespread this year and shifted towards younger age groups likely due to higher third-shot booster rates among the elderly.
|
Figure 2a. COVID-19 Cases in Arizona by Age Group March 7 – January 16, 2022 (Data from week ending November 28 suppressed). |
|
Figure 2b. COVID-19 Weekly Incidence in Arizona by Age Group - January 10, 2021 (peak) versus January 16, 2022 (likely peak). |
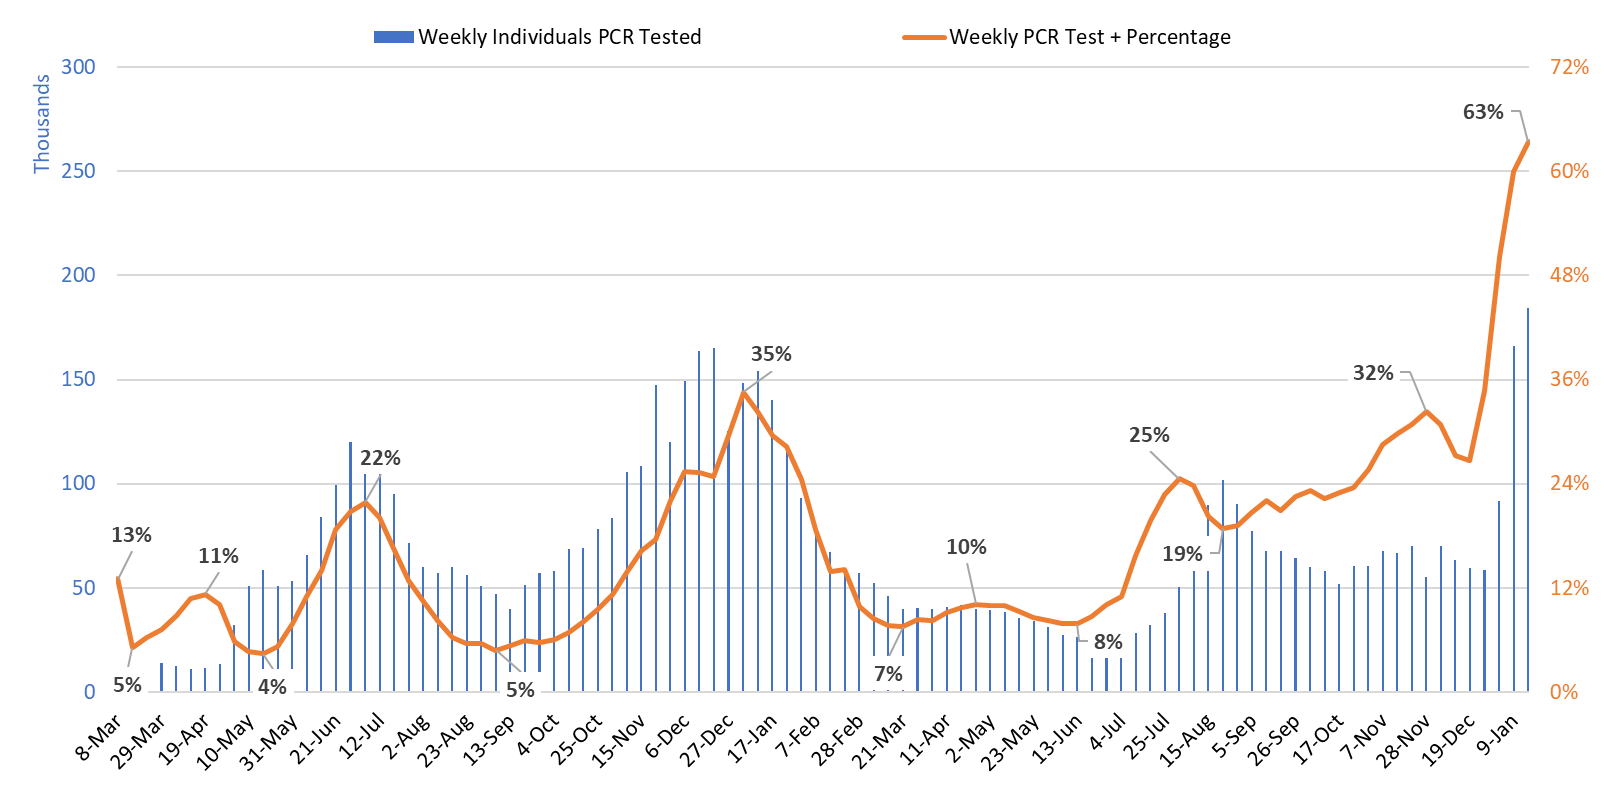
The increase in test positivity was more modest this week, but it remains insanely high at 63% (Figure 3). Test positivity = individuals with any positive test in the past week / all unique individuals who had ≥1 test result in the past week. This formula tends to yield higher values than elsewhere. We can’t be truly confident of reaching peak Omicron until cases and positivity are both declining.
|
Figure 3. Weekly Number of Patients Undergoing Traditional Nasopharyngeal PCR Testing and Associated Percent Positivity March 1, 2020 – January 16, 2022. |
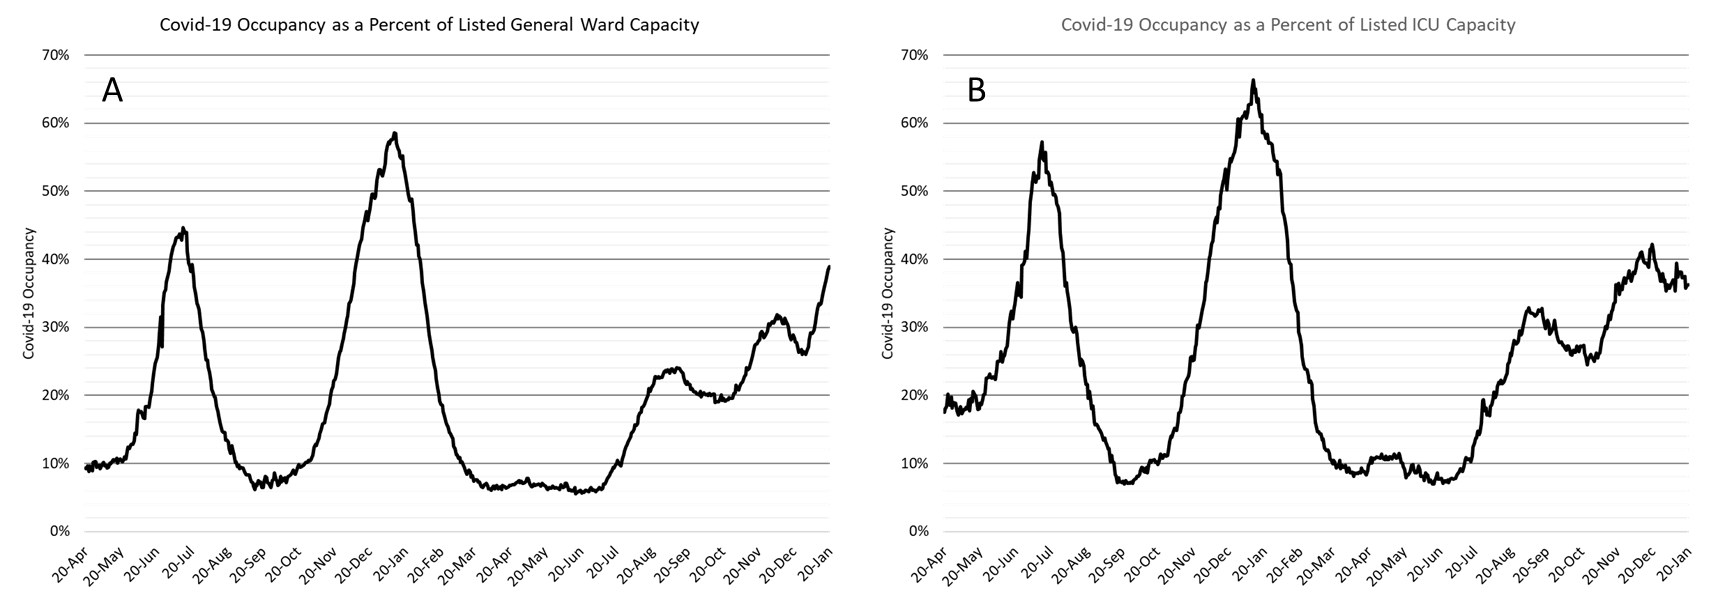
As of January 20th, 3410 (39%) of Arizona’s 8765 general ward beds were occupied by COVID-19 patients, a 16% increase from last week’s 2932 occupied beds (Figure 4 and Figure 5 Panel A). Another 492 (6%) beds remained available for use which is higher than last week’s 446 available beds. Five-hundred ninety-seven (597, 38%) of Arizona’s 1646 ICU beds were occupied by COVID-19 patients, a 5% decrease from last week’s 630 occupied beds (Figure 4 and Figure 5 Panel B). An additional 127 (8%) ICU beds remained available for use which is higher than last week’s 75 beds owing to a fall in COVID and non-COVID occupancy.
|
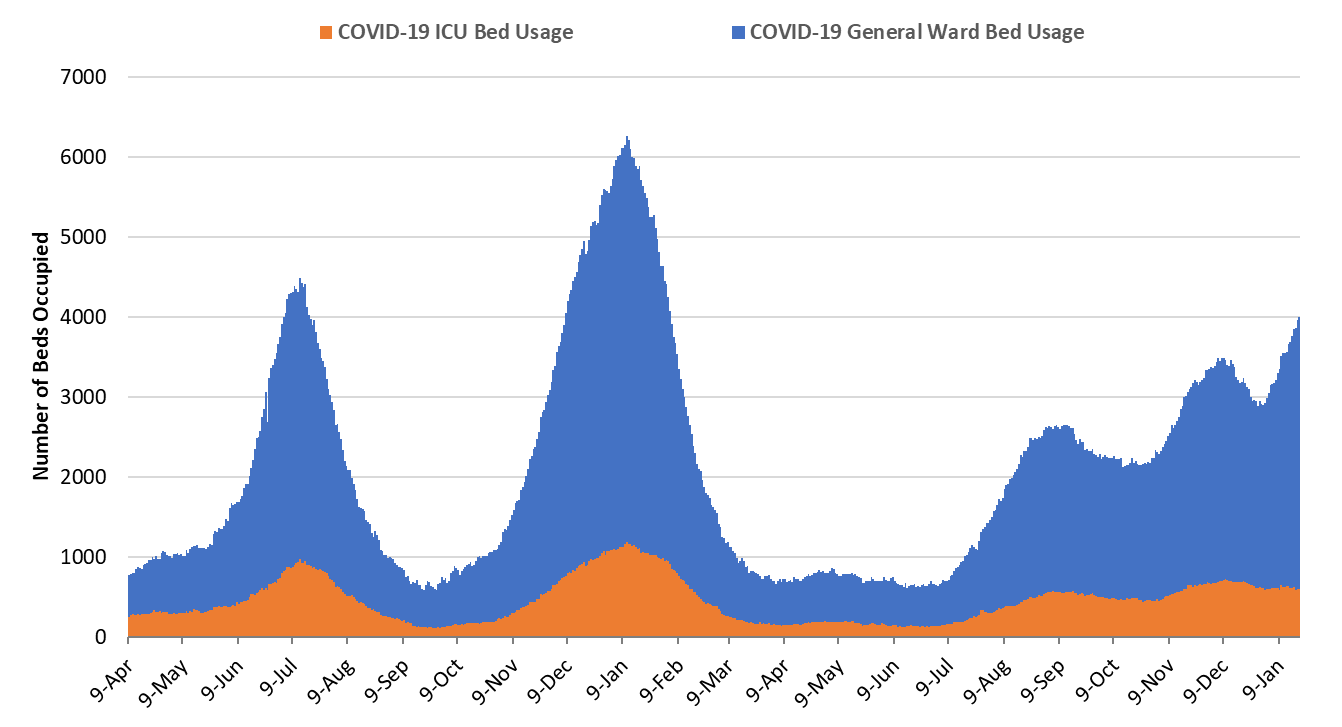
Figure 4. Arizona Daily COVID-19 General Ward and ICU Census April 9, 2020 – January 20, 2022. |
While peak occupancy won’t reach prior levels, we have reached 4000 combined occupancy for only the 3rd time since the pandemic began. The overlapping Delta and Omicron waves have placed greater chronic strain on our hospitals than prior waves. We have now experienced 160 consecutive days with a combined occupancy >2000 patients whereas the summer 2020 and winter 2021 saw 57 and 98 days, respectively. We have now experienced 55 days with >3000 combined occupancy whereas the summer 2020 and winter 2021 waves saw 35 and 78 days, respectively.
|
Figure 5. COVID-19 Occupancy as a Percent of Listed General Ward (A, left) and ICU (B, right) Capacity in Arizona April 20, 2020 – January 20, 2022. |
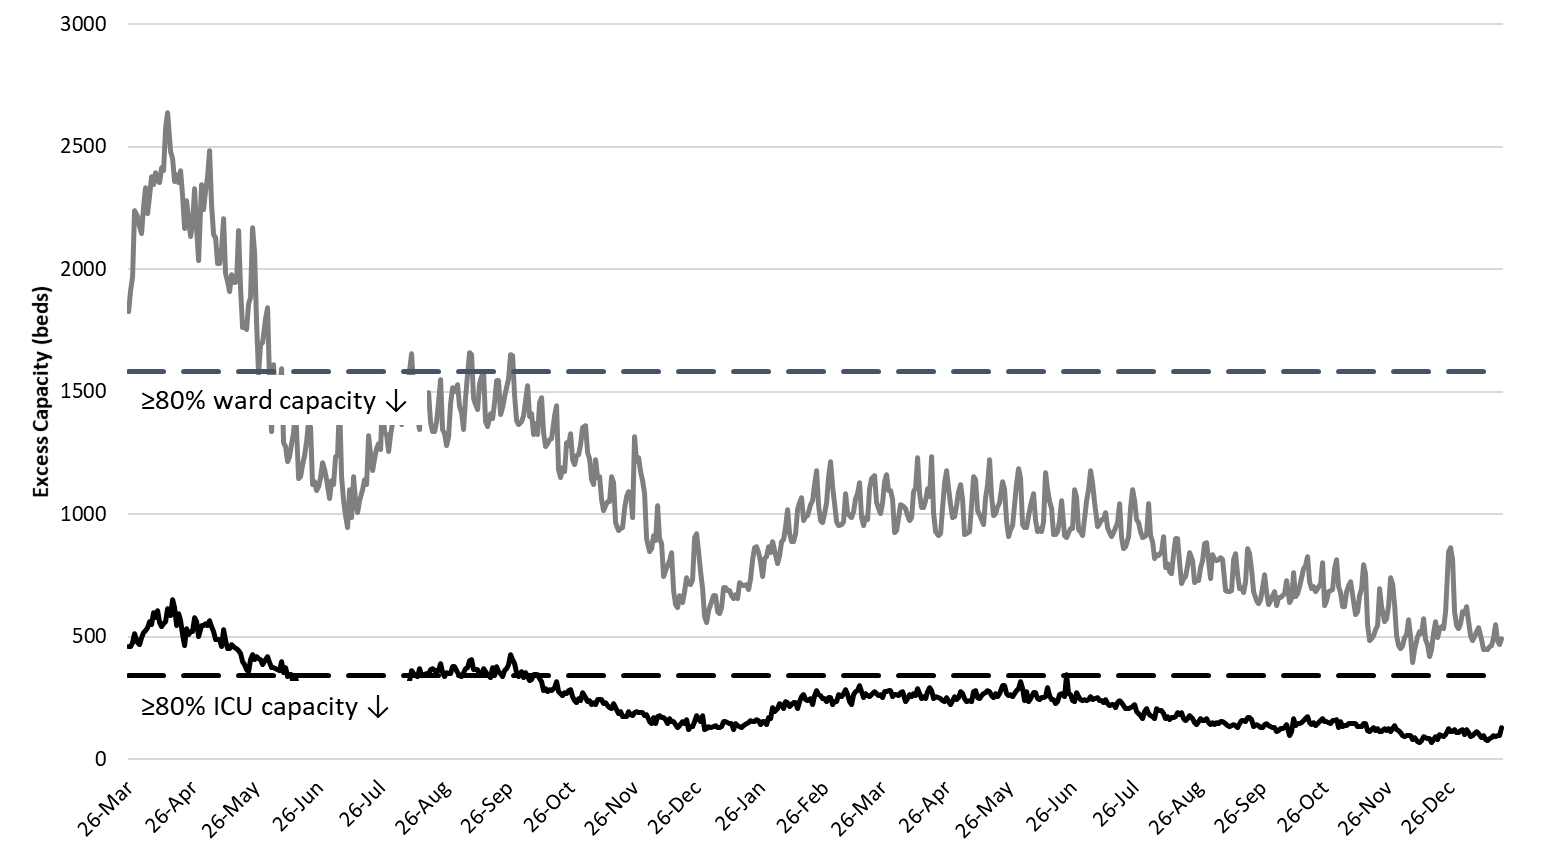
Hospital occupancy remains far above seasonal levels with safety margins, as measured by available beds, remaining near historical lows (Figure 6). Hospitals should prepare for >25% ward occupancy and ICU occupancy through February.
|
Figure 6. Observed Excess Non-Surge General Ward and ICU Capacity in Arizona March 26, 2020 – Jan 20, 2022. |
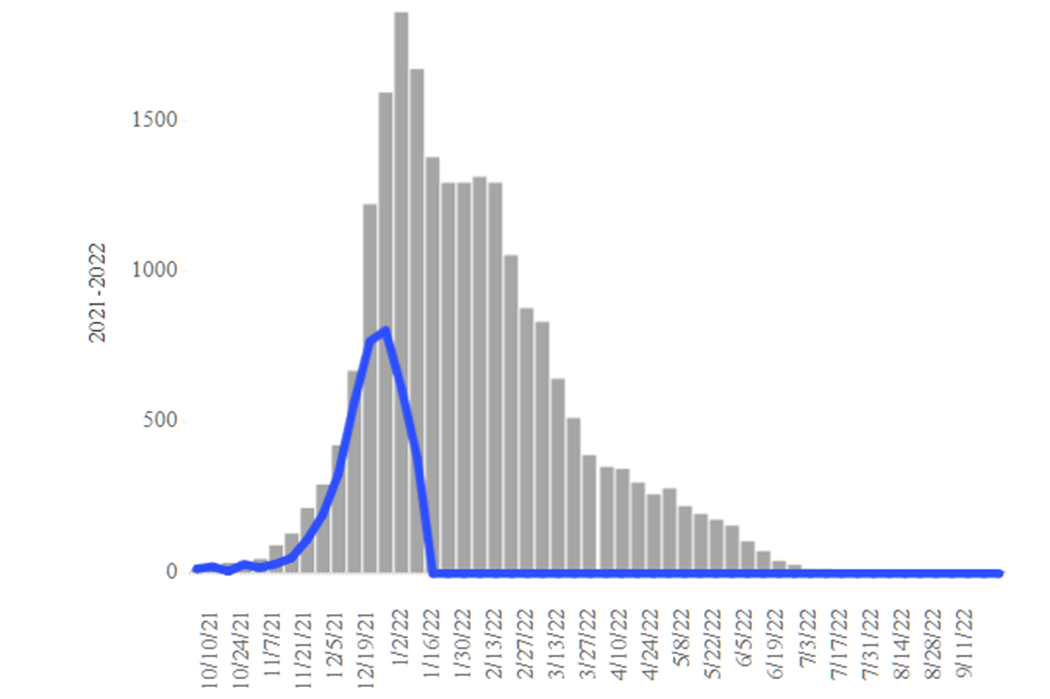
Seasonal influenza cases in Arizona (blue line) has fizzled, at least as compared to the state’s 5-year historical average (grey bars, Figure 7). COVID-19 mitigation efforts may have slowed influenza transmission. Hospitals should get relief from fewer COVID-19 and fewer influenza cases over the coming weeks.
|
Figure 7. Arizona Influenza Cases in 2021 (blue) versus 5-Year Historical Average (grey) |
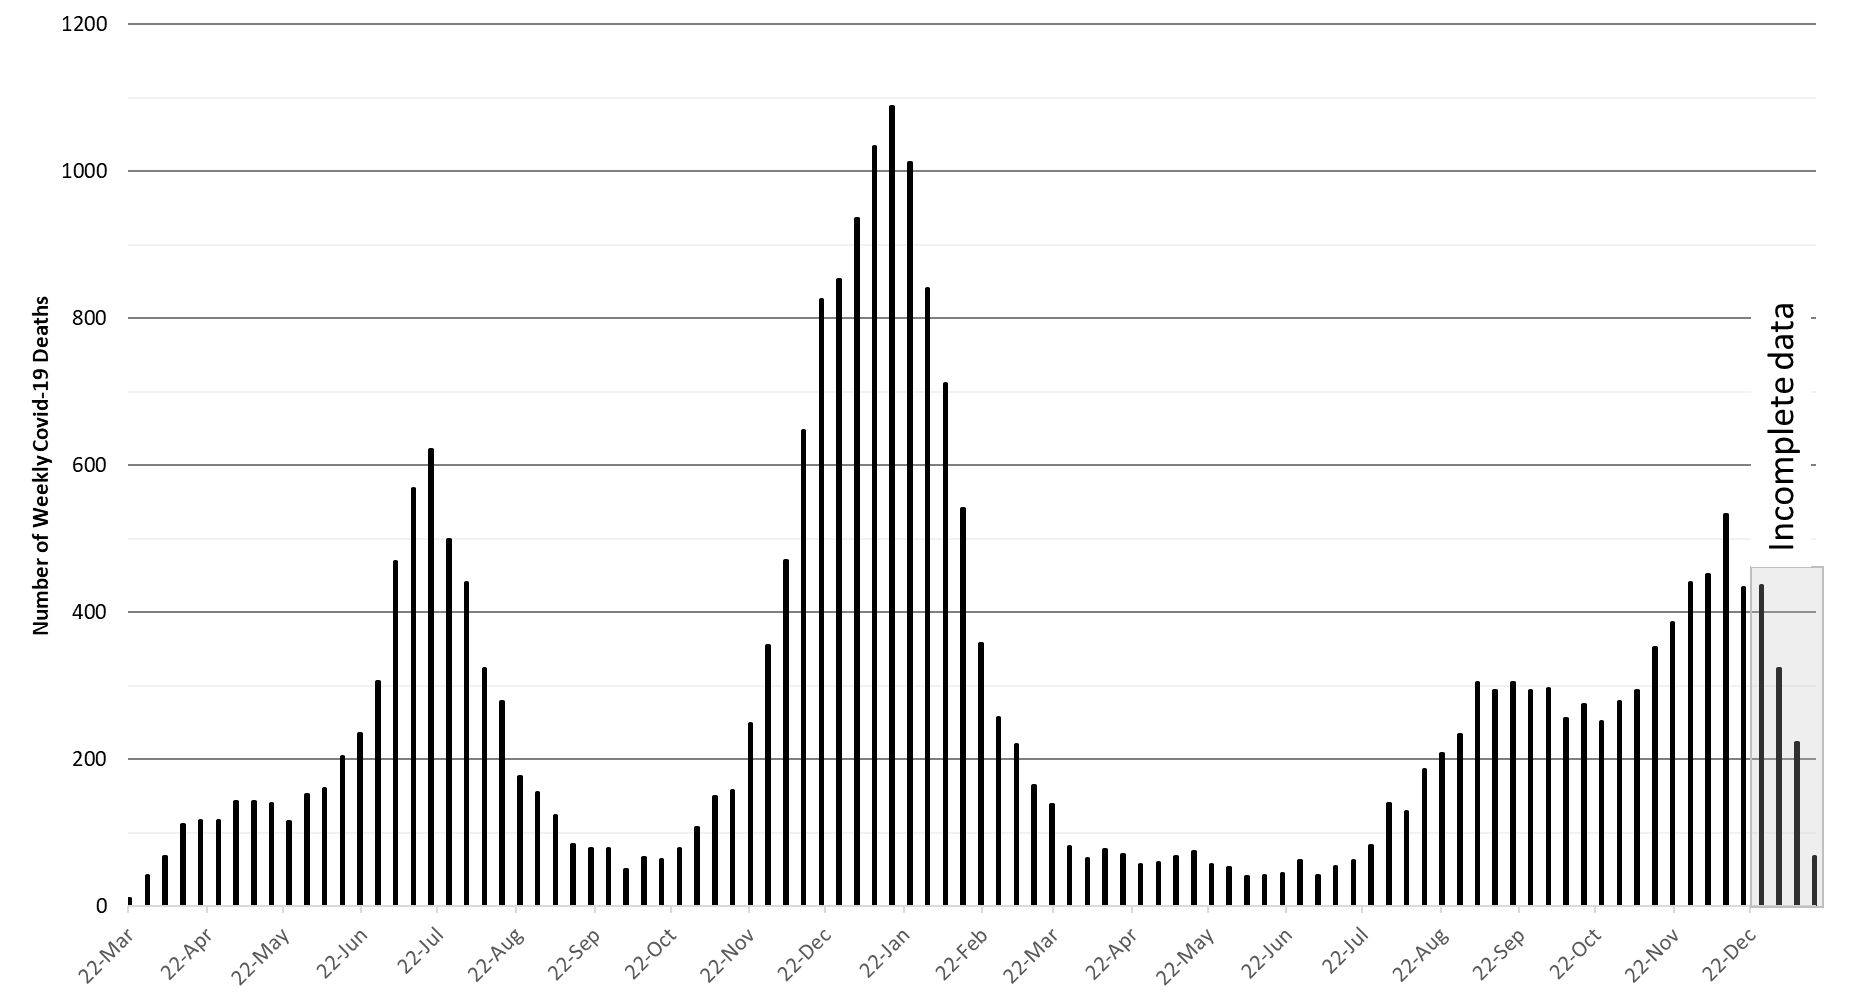
The week ending December 12th has now recorded 533 deaths to date. Hopefully, this will be the only week this happens during the Delta - Omicron waves (Figure 8). At least 25502 Arizonans have lost their lives to COVID-19. As an updated mortality report from the AzPHA indicates, official statistics undercount actual deaths.
|
Figure 8. Weekly Arizona COVID-19 Deaths March 16, 2020 – January 16, 2022. |
Pima County Outlook
For the week ending January 16th, 16669 Pima County residents were diagnosed with COVID-19, a 34% increase from the initial tally of 12438 cases last week (Figure 9).
|
Figure 9. Weekly COVID-19 Cases in Pima County and Number of Individuals Undergoing COVID-19 Diagnostic Testing March 1, 2020 – January 16, 2022. |
Comparisons of transmission by age group this week versus peak levels last January are shown in Figure 10. Results are comparable to the state statistics.
|
Figure 10. COVID-19 Weekly Incidence in Pima County by Age Group January 10, 2021 versus January 16, 2022. |
Summary
- Arizona is experiencing historic levels of community transmission attributable to the dominant Omicron variant. Test positivity is insanely high reminding us that test capacity, accessibility, and/or uptake is wholly inadequate. Arizona, like much of the United States, is in the midst of another large pandemic wave. Transmission (cases) has likely peaked as you read this but expect high levels of hospital through February. The greatest burden on our health care system will remain in hospital wards and emergency departments.
- As of January 16th, new cases were being diagnosed at a rate of 1896 cases per 100K residents per week. We can expect rates to peak ~2000 cases per 100K residents week, somewhat lower than some other states perhaps due to less testing availability. Ideally, a peak would be indicated by declining case counts and test positivity. Hopefully, next week’s update will bring confirmation of both.
- Even if Arizona is moving down the backside of the wave, it is still important that all adults who previously completed the 2-dose primary sequence to obtain a booster, particularly those 50+ years of age. The risk of Omicron infection will remain extremely high for many weeks. Remember, the CDC defines high community transmission as levels >100 cases per 100K residents per week. We’re a far cry from that!
- COVID-19 hospital occupancy (wards) continues to increase but should moderate soon. Hospitals will be burdened by >30% occupancy in general wards and in the ICU for several weeks yet. Access to care continues to be restricted by both COVID-19 occupancy and staff shortages owing to infections among healthcare workers.
- Weekly COVID-19 deaths likely peaked at 530 deaths the week ending December 12th. However, weekly totals in the upper-300s, lower-400s are likely for several more weeks. So far, at least 25502 Arizonans have lost their lives to COVID-19.
Forecast reports to date, available as PDFs
Download PDF to view additional charts of Arizona counties, available in appendix of report.
2021 Reports
Based on what we know now about this pandemic, we support guidelines for social distancing to slow the spread of the virus and urge everyone to follow the recommendations provided by the Centers for Disease Control and Prevention (CDC) to protect yourself, your family, your neighbors, and your employees. Please heed the recommendations as provided by the CDC.
COVID covid coronavirus virus covid19 corona forecast model