
Weekly Arizona COVID-19 Data Report – January 28
Note this forecast page is not the most recent forecast available.
View the most current forecast report
Researcher Analyzes Arizona COVID-19 Spread Models for Decision-Makers
The following information regarding the spread of COVID-19 in Arizona was prepared by Joe Gerald, MD, PhD, a researcher at the Mel and Enid Zuckerman College of Public Health (MEZCOPH) at the University of Arizona. This information has also been reviewed by other MEZCOPH faculty.
This data were obtained from the Arizona Department of Health Services COVID-19 webpage and reflect conditions in Arizona as of January 28, 2022.
This information is intended to help guide our response to the outbreak. It is not intended to predict how this pandemic will evolve. Rather, this model extrapolates what might occur if current conditions remain unchanged. As regional authorities and healthcare providers respond, their actions are expected to mitigate the worst consequences of this pandemic.

COVID-19 Disease Outbreak Forecast
Arizona State and Pima County
Updated January 28, 2022
Disclaimer: This information represents my personal views and not those of The University of Arizona, the Zuckerman College of Public Health, or any other government entity. Any opinions, forecasts, or recommendations should be considered in conjunction with other corroborating and conflicting data. Updates can be accessed at https://publichealth.arizona.edu/news/2021/covid-19-forecast-model.
|
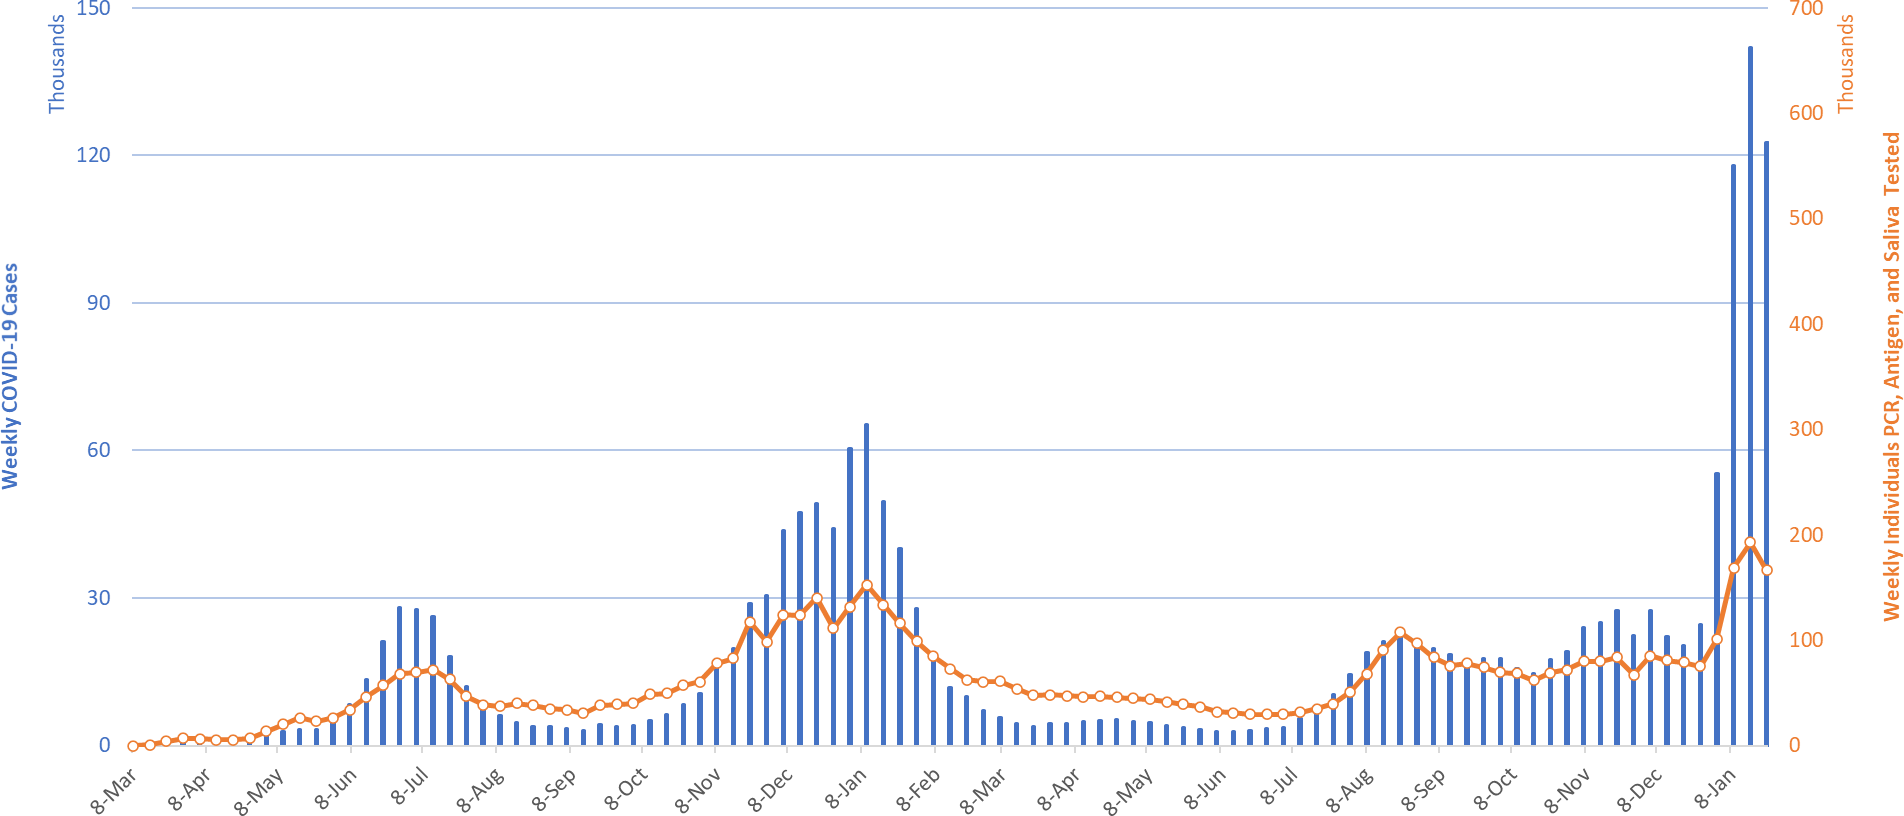
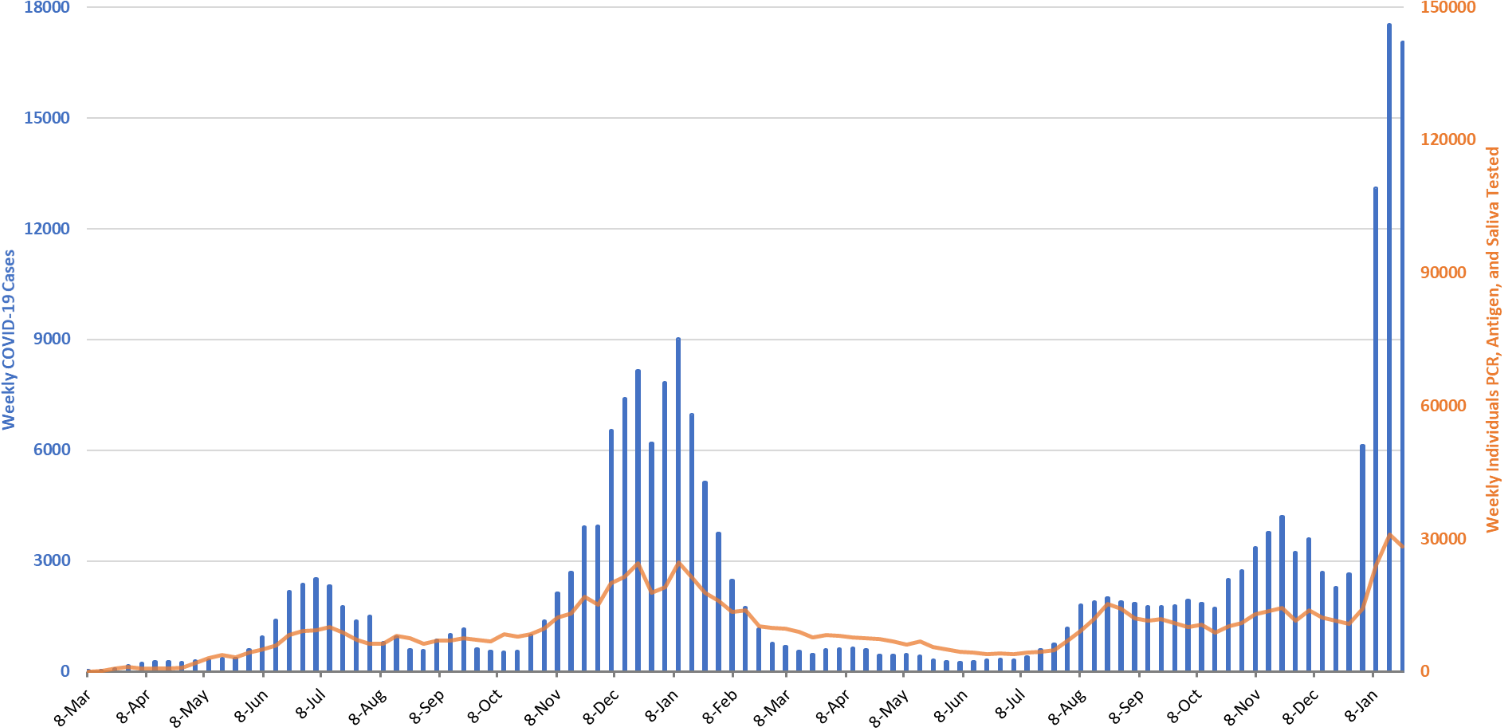
Figure 1. Weekly COVID-19 Cases in Arizona and Number of Individuals Undergoing COVID-19 Diagnostic Testing March 1, 2020 – January 23, 2022. |
For the week ending January 23rd, at least 122559 Arizonans were diagnosed with COVID-19, a 13% decrease from the 133806 cases reported the prior week (Figure 1). Last week’s initial tally has been updated to 141895 (+8089, +6%) cases. Omicron peaked statewide about January 15th at 1967 cases per 100K residents per week. While reaching a peak is a welcomed, the risk of contracting Omicron remains extremely high as the ride down is likely to be slower than the ride up. It is too soon for institutions and/or individuals to safely relax their mitigation practices as the level of transmission is more important than the direction of change.
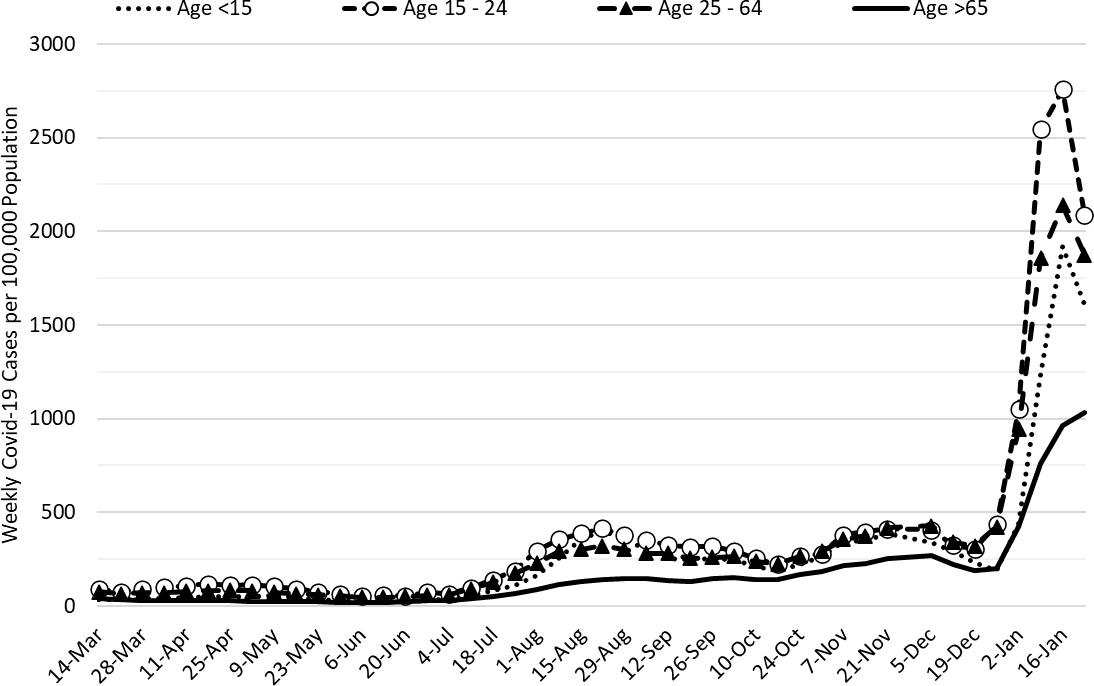
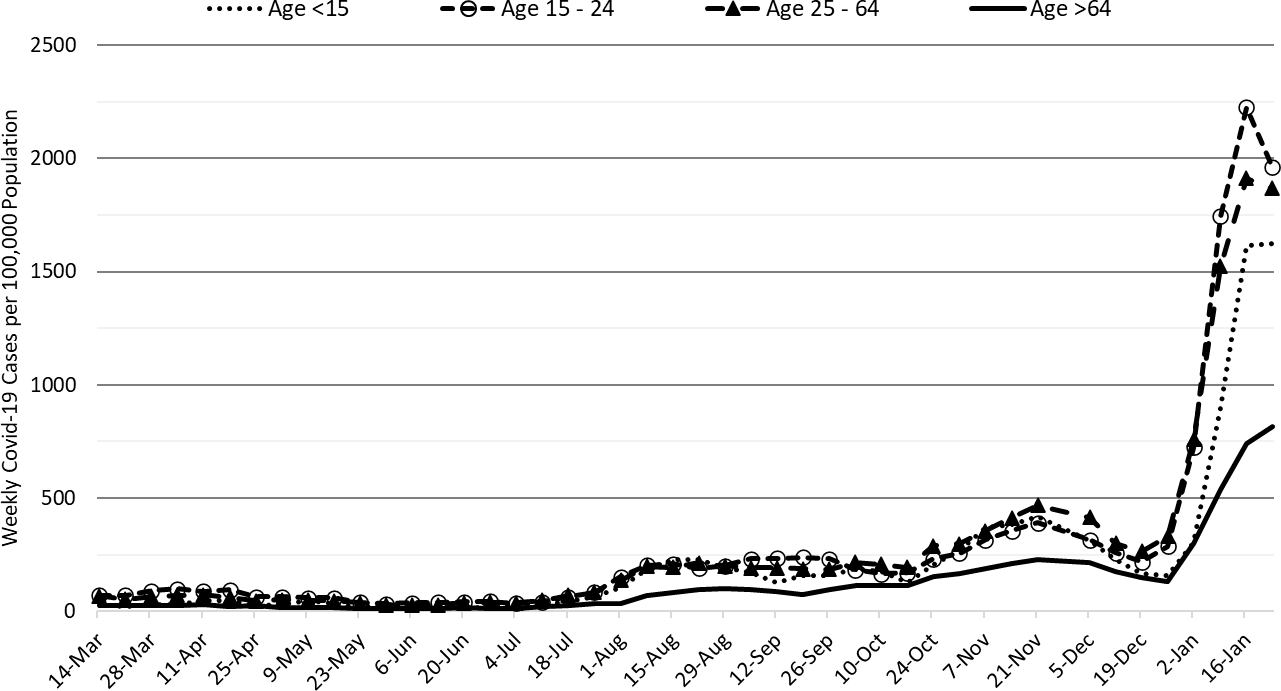
Cases are currently being diagnosed at a rate of 1684 cases per 100K residents per week. Rates remain highest among those 15 – 24 years and lowest among those ≥65 years, 2089 and 1031 cases per 100K residents, respectively (Figure 2a below). Arizona’s new case ranking has risen to 7th and, we are closing the gap with the nation’s leaders: Alaska (2360), Washington (1907), Kentucky (1897), Oklahoma (1839), and West Virginia (1809). Hopefully, Team Arizona will be hitting on all 4 cylinders by March Madness!
According to the CDC, 40% of Arizona adults and 57% of its seniors have obtained a third dose booster. Fortunately, the primary 2-dose Pfizer sequence retains 70% protection against hospitalization from Omicron. The ADHS Vaccine Dashboard shows weekly doses delivered fell just shy of 125K doses. So, we continue to make slow, plodding progress. The CDC recommends everyone ≥12 years who received Pfizer primary sequence should receive a booster; ≥18 years if they received the Moderna primary sequence.
|
Figure 2a. COVID-19 Cases in Arizona by Age Group March 7, 2021 – January 23, 2022 (Data from week ending November 28 suppressed). |
|
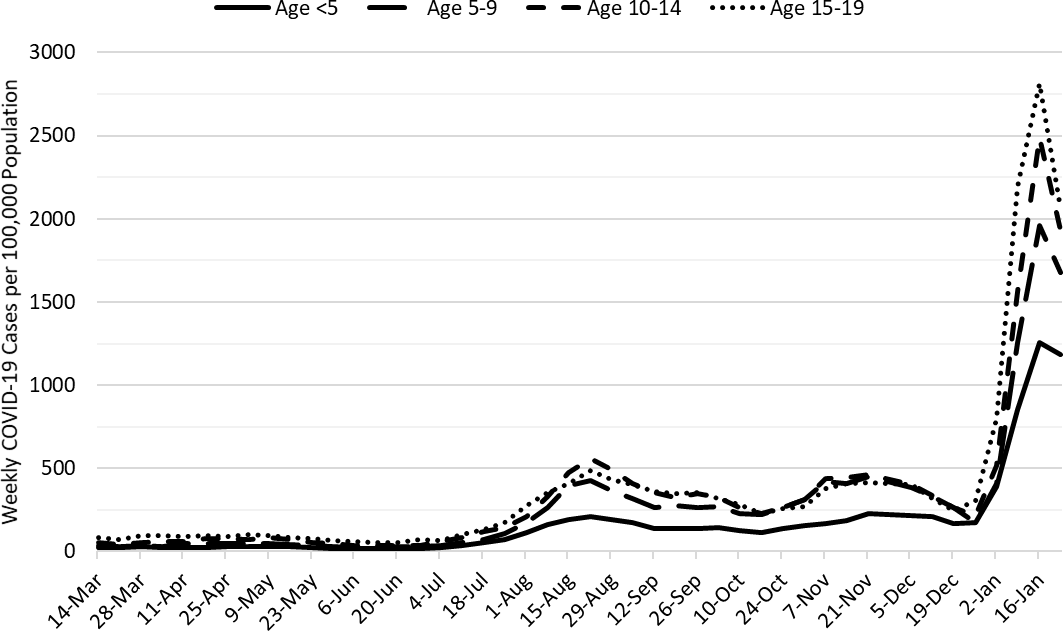
Figure 2b. COVID-19 Weekly Incidence in Arizona among children March 7, 2021 – January 23, 2022. |
Figure 2a shows transmission among all age groups is decreasing except among those ≥65 years. Figure 2b shows that transmission among children is declining across all age groups. A quick shout-out to all of Arizona’s K – 12 educators, staff, and administrators for taking one on the chin this month. Student and staff absenteeism should begin waning soon. February will still be a difficult month but at least there is a light at the end of the tunnel, and it’s probably not the train.
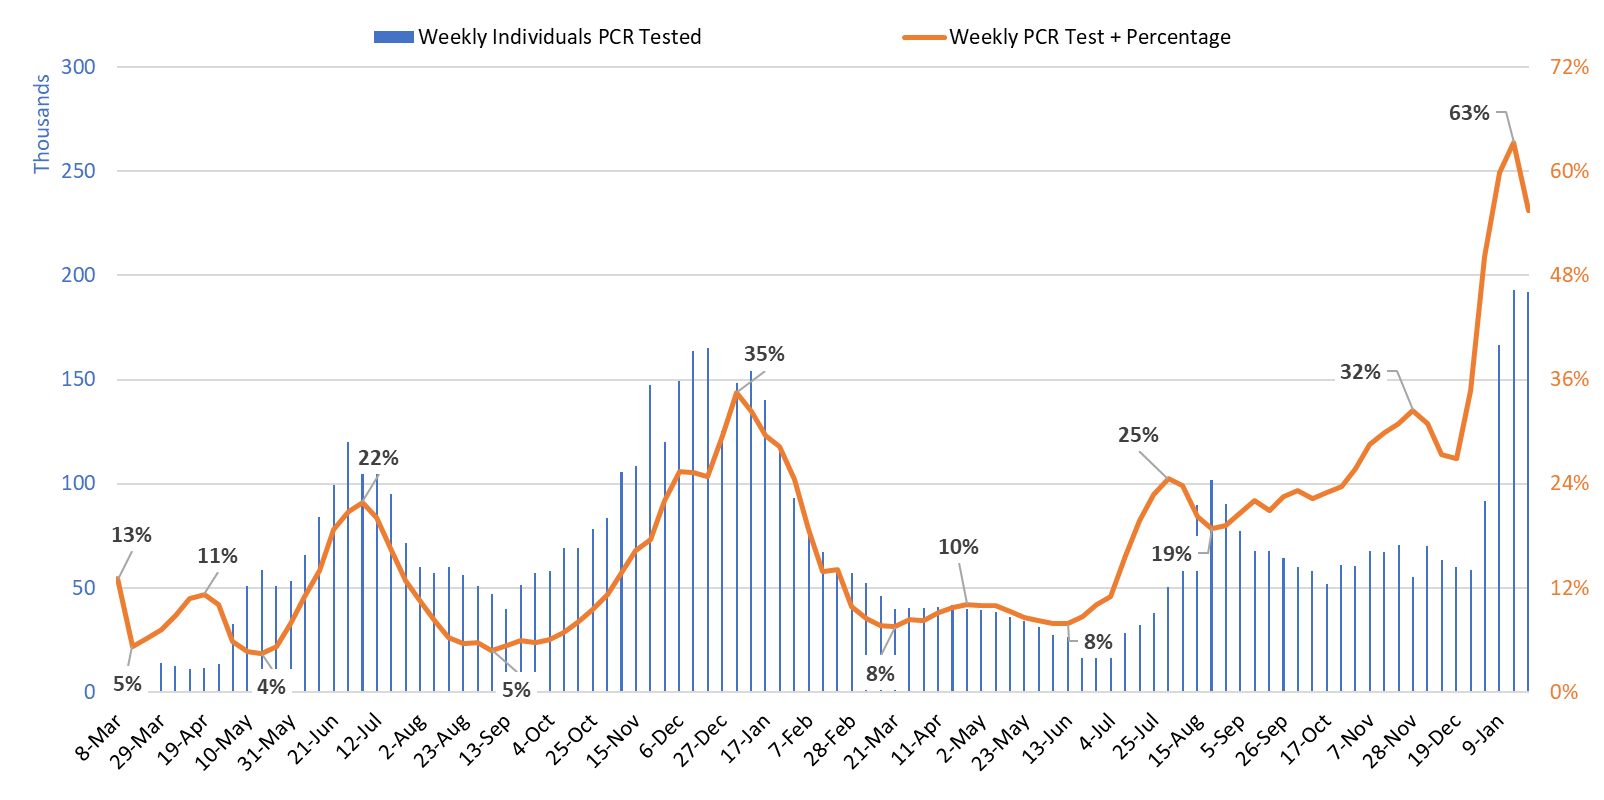
Test positivity declined for the first time in a while to 55% (Figure 3). Now that cases, testing, and positivity are all declining, the Omicron peak is all but certain. However, other jurisdictions have seen a follow-on “bounce” wave, smaller than the first, due to relaxing mitigation and perhaps the new more transmissible BA.2 Omicron variant. We should expect the ride down the backside of the peak to be bumpy.
|
Figure 3. Weekly Number of Patients Undergoing Traditional Nasopharyngeal PCR Testing and Associated Percent Positivity March 1, 2020 – January 23, 2022. |
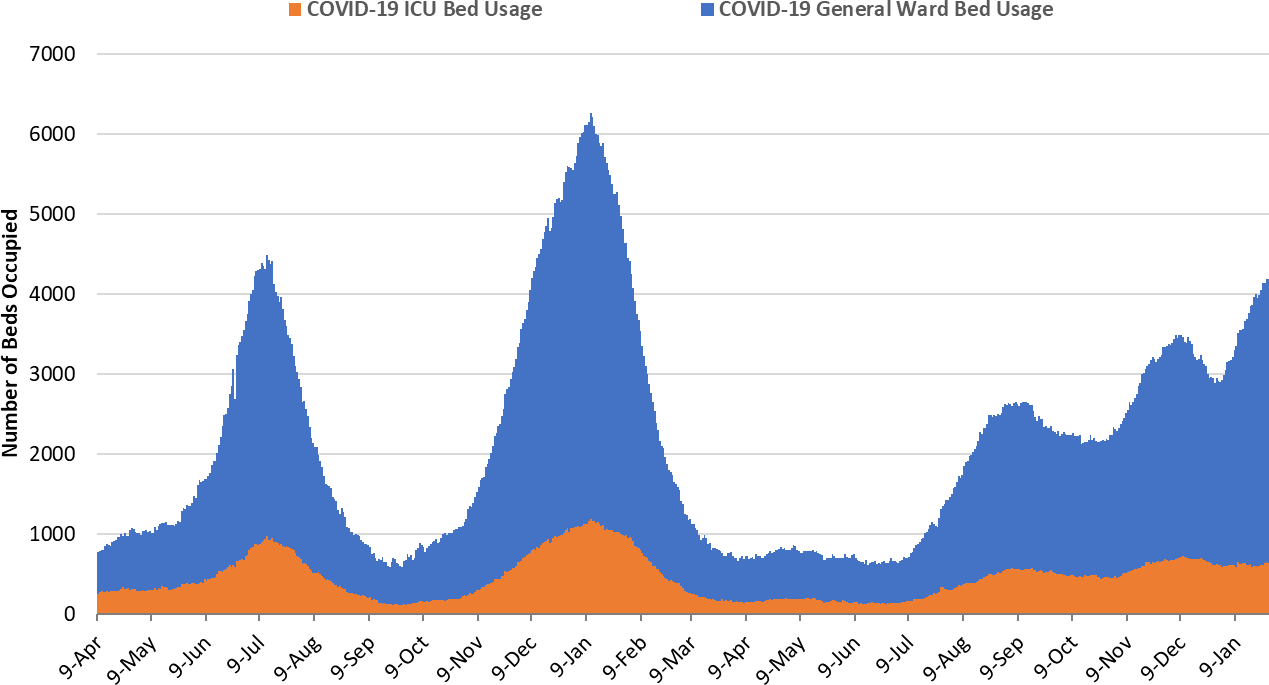
As of January 27th, 3559 (41%) of Arizona’s 8767 general ward beds were occupied by COVID-19 patients, a 4% increase from last week’s 3410 occupied beds (Figure 4 and Figure 5 Panel A). Another 405 (5%) beds remained available for use which is much lower than last week’s 492 available beds. Six-hundred thirty-six (636, 39%) of Arizona’s 1648 ICU beds were occupied by COVID-19 patients, a 7% increase from last week’s 597 occupied beds (Figure 4 and Figure 5 Panel B). An additional 92 (6%) ICU beds remained available for use which is lower than last week’s 127 beds.
|
Figure 4. Arizona Daily COVID-19 General Ward and ICU Census April 9, 2020 – January 27, 2022. |
While peak occupancy won’t reach prior levels, we remain above 4000 combined occupancy for only the 3rd time. The overlapping Delta and Omicron waves have placed hospitals under greater strain than prior waves. We have now experienced 167 consecutive days with a combined occupancy >2000 patients whereas the summer 2020 and winter 2021 saw 57 and 98 days, respectively. We have now experienced 62 days with >3000 combined occupancy whereas the summer 2020 and winter 2021 waves saw 35 and 78 days, respectively. Just like Wile E Coyote, hospitals are getting crushed by a slow rolling steam roller. No end in sight.
|
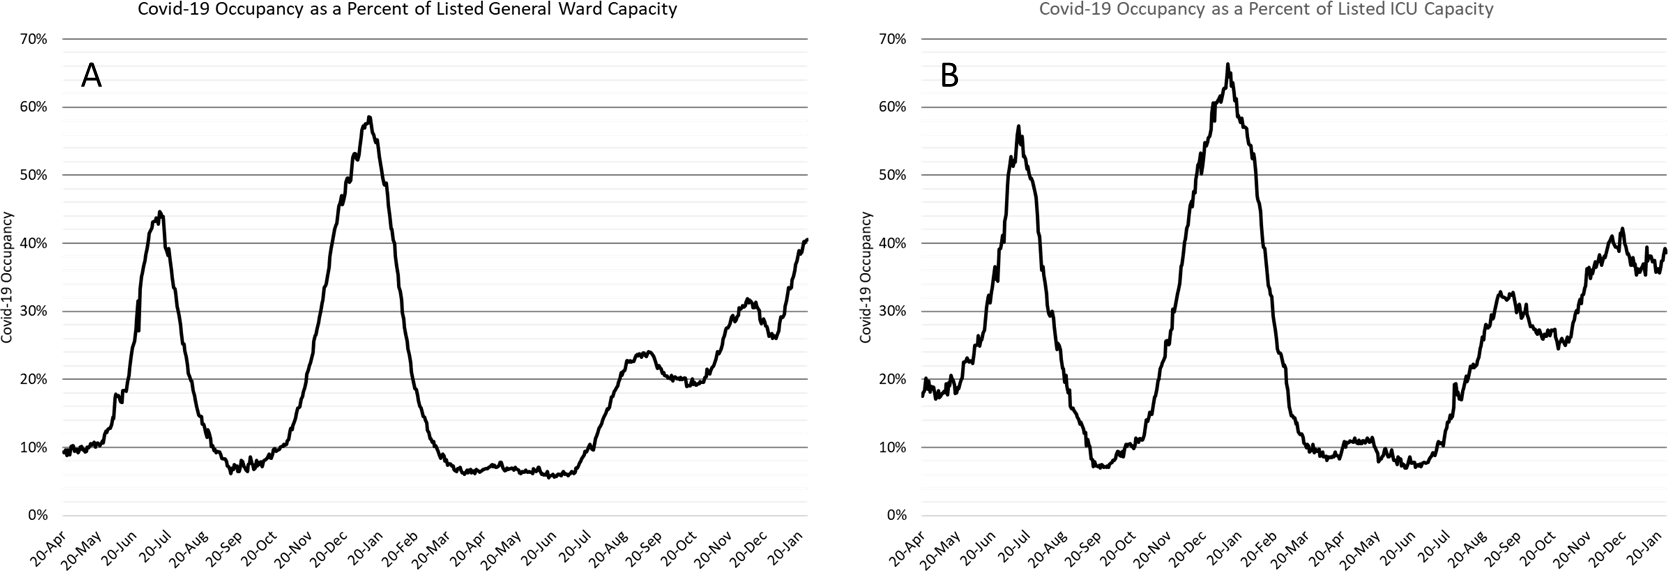
Figure 5. COVID-19 Occupancy as a Percent of Listed General Ward (A, left) and ICU (B, right) Capacity in Arizona April 20, 2020 – January 27, 2022. |
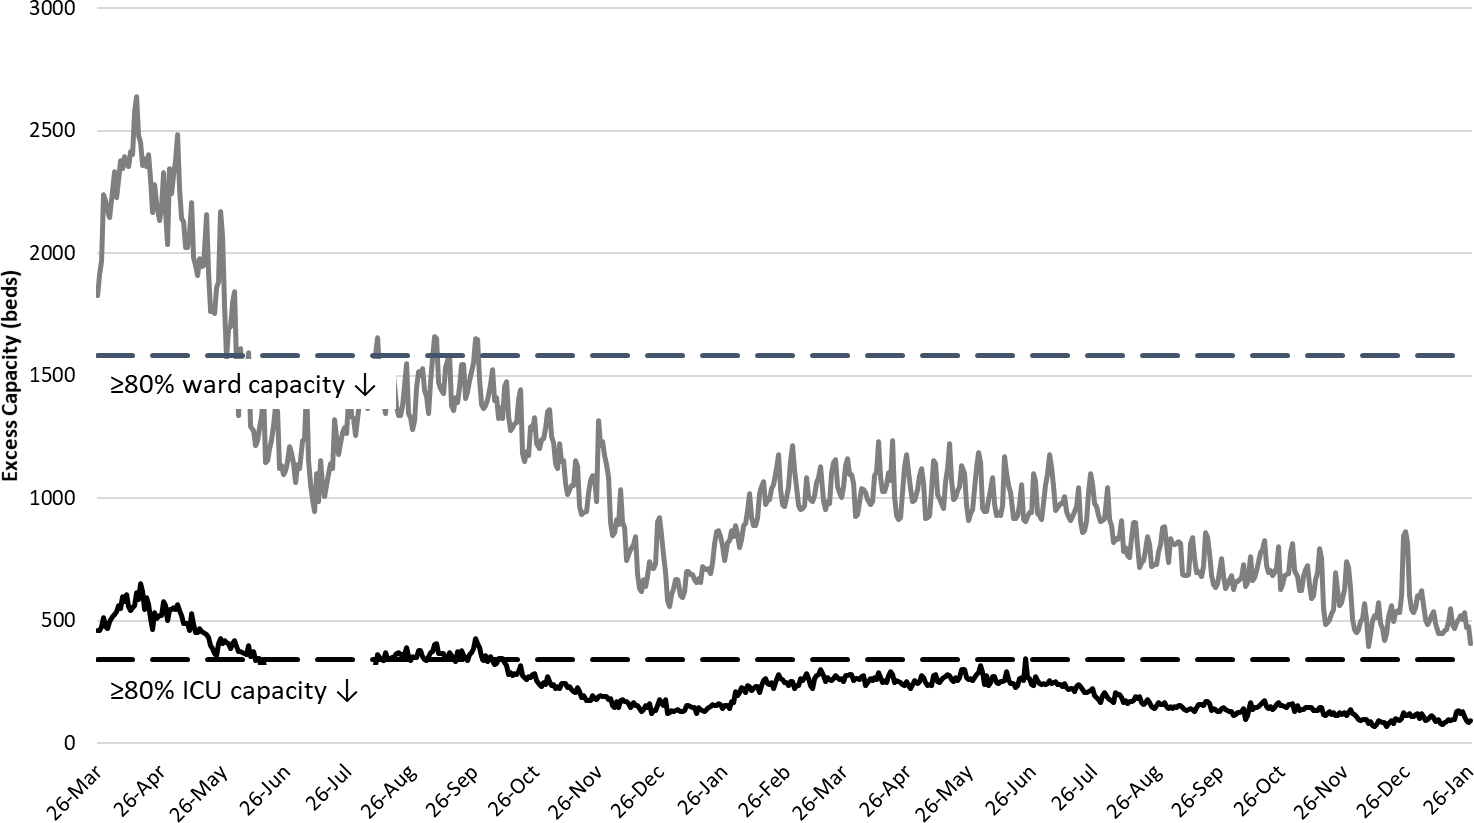
Hospital occupancy remains far above seasonal levels with safety margins, as measured by available beds, remaining near historical lows (Figure 6). Hospitals should prepare for >30% ward occupancy and ICU occupancy through February.
|
Figure 6. Observed Excess Non-Surge General Ward and ICU Capacity in Arizona March 26, 2020 – Jan 27, 2022. |
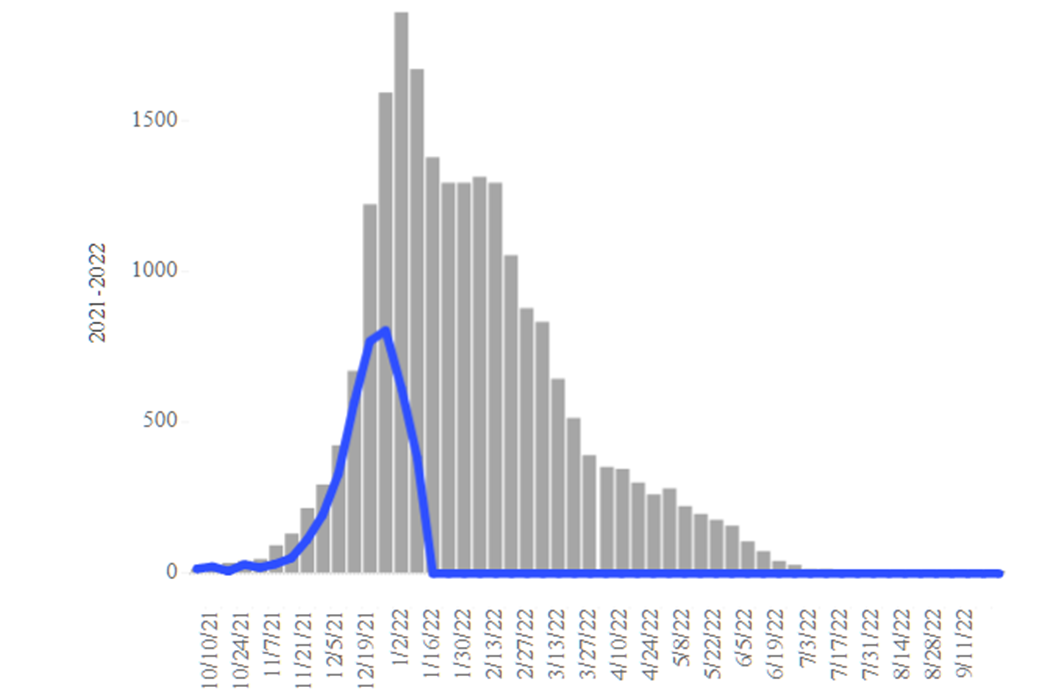
Seasonal influenza cases in Arizona (blue line) has fizzled, at least as compared to the state’s 5-year historical average (grey bars, Figure 7). COVID-19 mitigation efforts may have slowed influenza transmission. Hospitals should begin to get relief from fewer COVID-19 and fewer influenza cases over the coming weeks.
|
Figure 7. Arizona Influenza Cases in 2021 (blue) versus 5-Year Historical Average (grey) |
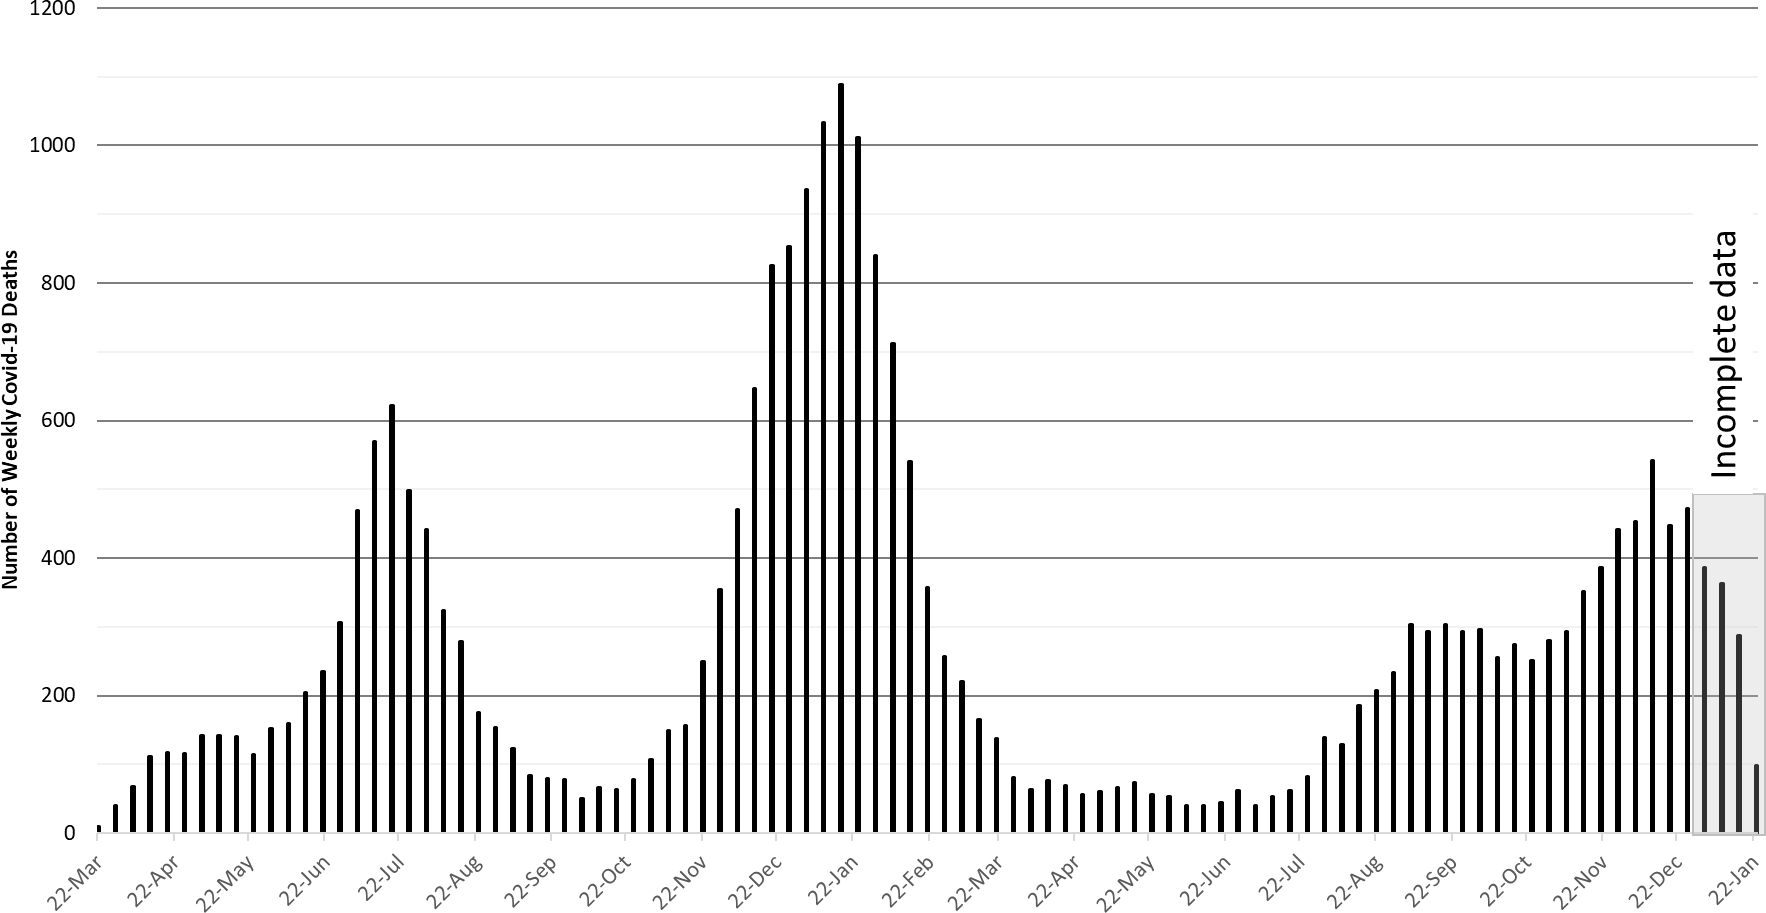
The week ending December 12th has now recorded 542 deaths to date. Hopefully, this will be the only week this happens during the Delta - Omicron waves (Figure 8a). At least 26001 Arizonans have lost their lives to COVID-19. A mortality report from the AzPHA indicates that official statistics undercount actual deaths.
|
Figure 8a. Weekly Arizona COVID-19 Deaths March 16, 2020 – January 23, 2022. |
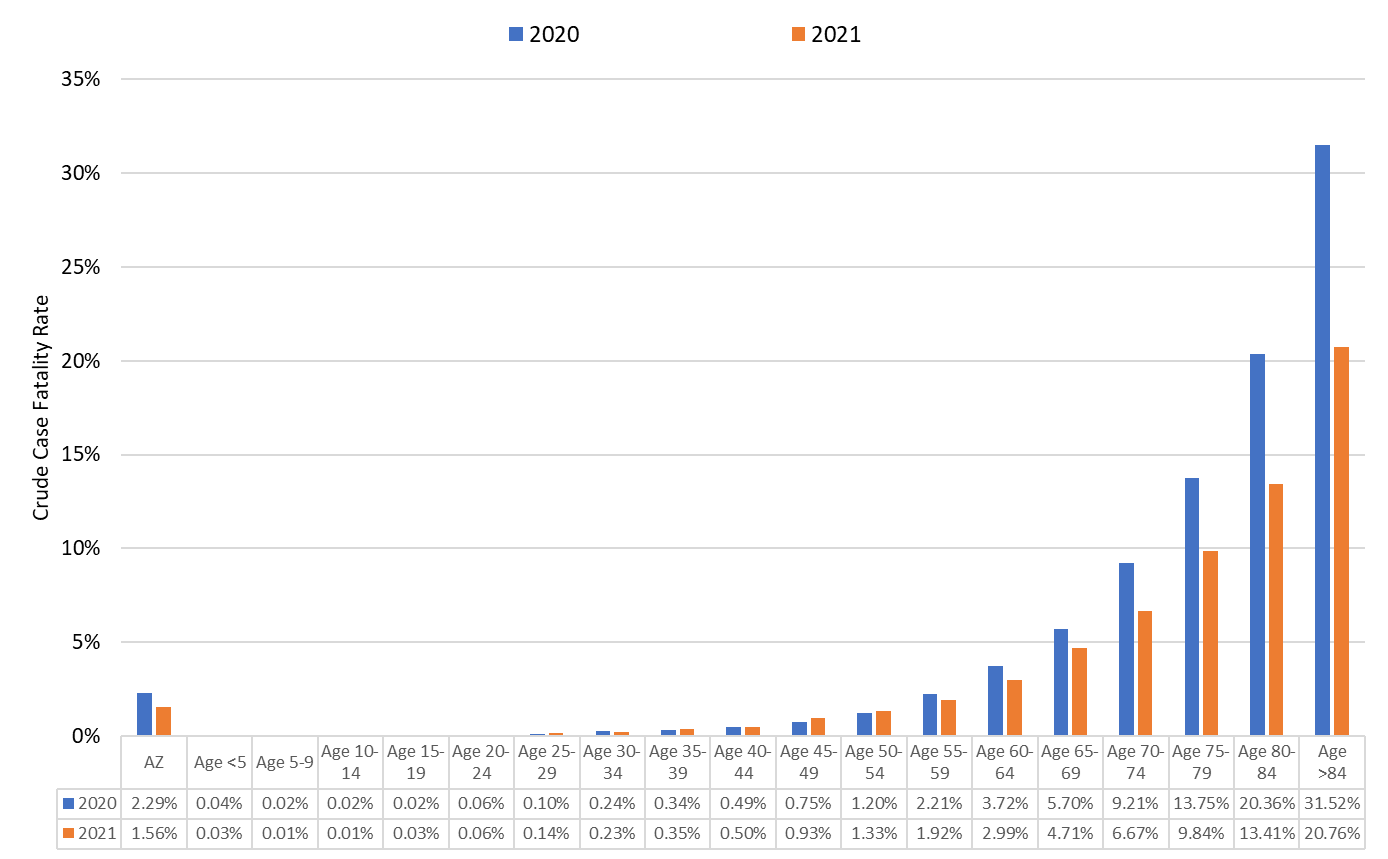
Figure 8b shows age-specific case-fatality rates (CFR) by year. Crude CFR is subject to surveillance bias for both cases (large undercounting) and deaths (modest undercounting). The bias may differ by age The impact of vaccination is most apparent for those >55 years whereas crude CFR was the same or a bit higher in 2021 than 2020 among working age adults.
|
Figure 8b. COVID-19 Crude Case Fatality Rate by Age and Year |
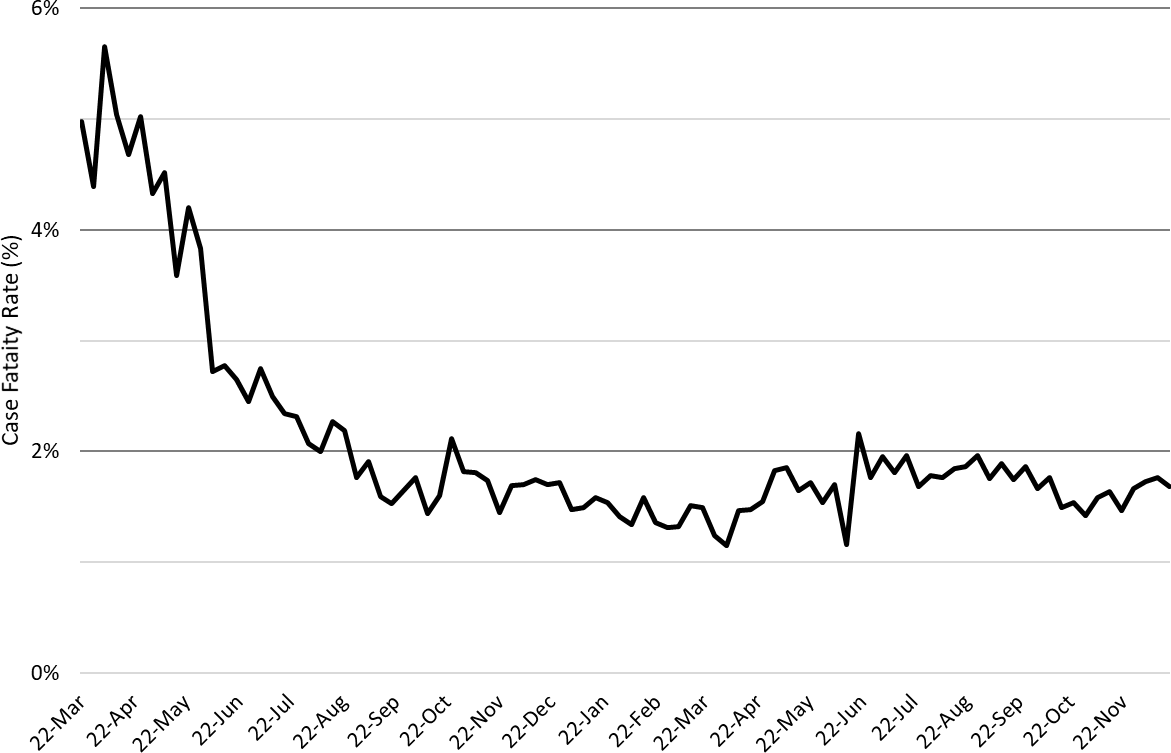
The age-standardized CFR has remained remarkably stable between 1.5 – 2.0% for over a year (Figure 8c). The CFR is standardized to a case age distribution the week of October 25, 2020.
|
Figure 8c. COVID-19 Age-Standardized Case Fatality Rate March 22, 2020 – December 19, 2021 (October 25, 2020 Age Distribution). |
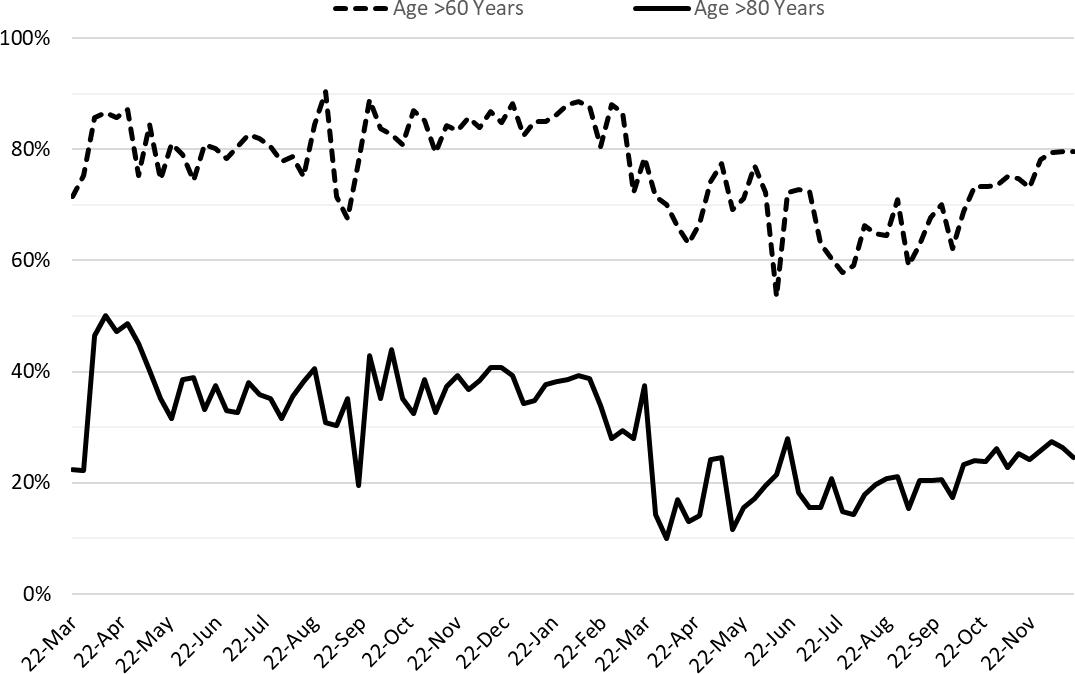
The proportion of COVID-19 deaths among the elderly (≥60 years) and eldest, elderly (80 years) both fell in March 2021 following the targeted vaccination campaign (Figure 8d). However, deaths have since returned to pre-vaccine levels for those >60 years, but not among those >80 years. This suggests deaths shifter younger in the >60 demographic and away from those >80 years.
|
Figure 8d. Proportion of COVID-19 Deaths Attributable to Those >60 Years and >80 Years, March 22, 2020 – |
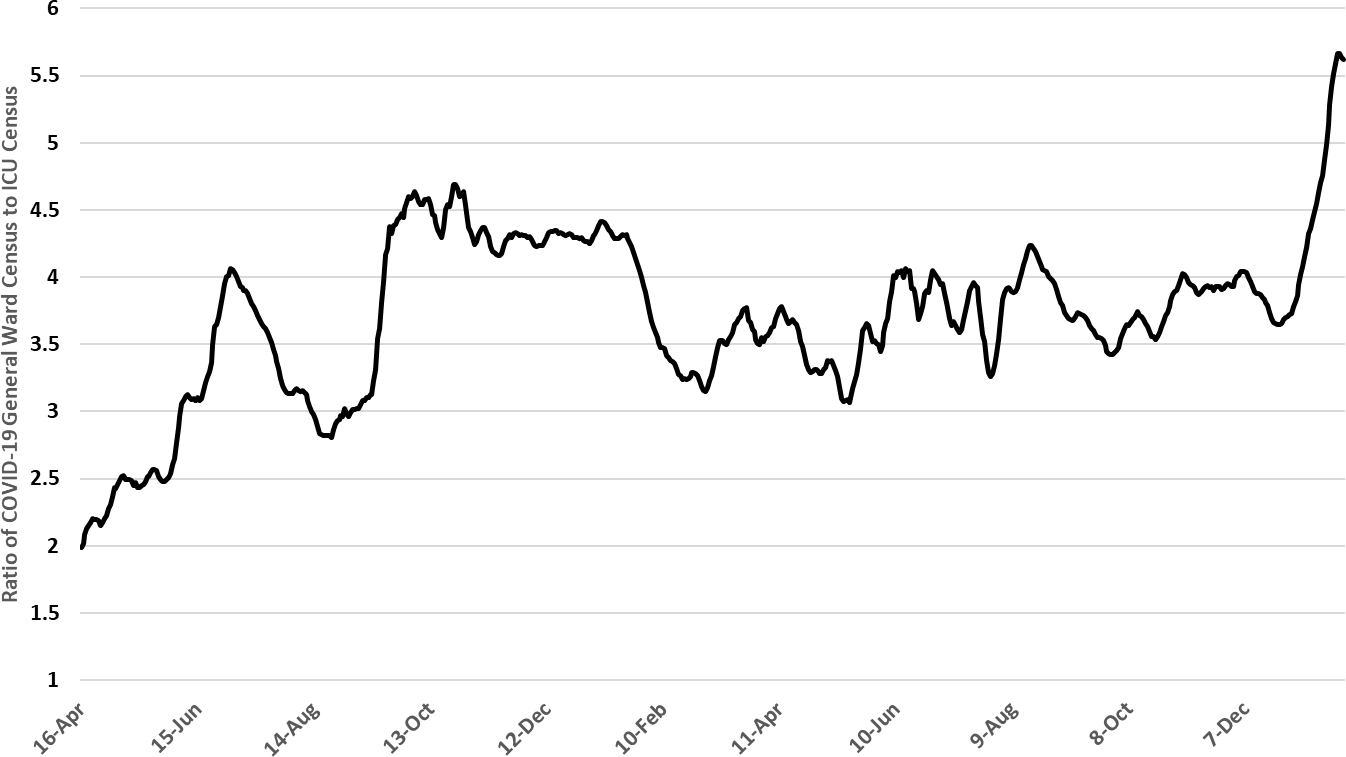
Because I have the room, I thought I would throw in one more figure. Figure 8e shows the ratio of the daily COVID-19 ward and ICU census. Typically, when cases increase rapidly ward occupancy increases relative to ICU occupancy. This trend was considerably more pronounced with the Omicron wave likely due to its lower severity.
|
Figure 8e. Ratio of COVID-19 Daily General Ward Census to ICU Census April 16, 2021 – January 27, 2022. |
Pima County Outlook
For the week ending January 23rd, 17055 Pima County residents were diagnosed with COVID-19, a 2% increase from the initial tally of 16669 cases last week (Figure 9).
|
Figure 9. Weekly COVID-19 Cases in Pima County and Number of Individuals Undergoing COVID-19 Diagnostic Testing March 1, 2020 – January 23, 2022. |
Depending on backfill, this week or last will likely be Pima County’s peak. Transmission by age group is shown in Figure 10.
|
Figure 10. COVID-19 Weekly Incidence in Pima County by Age Group January 10, 2021 versus January 23, 2022. |
Summary
- Arizona continues to experience historic levels of community transmission attributable to the dominant Omicron variant. Test positivity is insanely high reminding us that test capacity, accessibility, and/or uptake is wholly inadequate. Arizona, like much of the United States, is in the midst of another large pandemic wave. Transmission (cases) has peaked but risk of infection remains high.
- As of January 23rd, new cases were being diagnosed at a rate of 1694 cases per 100K residents per week. Rates peaked last week at ~1967 cases per 100K residents week, somewhat lower than some other states, perhaps due to less testing.
- Even if Arizona is moving down the backside of the wave, it is still important that all adults who previously completed the 2-dose primary sequence to obtain a booster, particularly those 50+ years of age.
- The risk of Omicron infection will remain extremely high for many weeks. Remember, the CDC defines high community transmission as levels >100 cases per 100K residents per week. We’re a far cry from that!
- COVID-19 hospital occupancy in the wards continues to increase but should moderate soon. Hospitals will be burdened by >30% occupancy in general wards and in the ICU for several weeks yet. Access to care continues to be restricted by both COVID-19 occupancy and staff shortages owing to infections among healthcare workers. Friendly PSA – still too early to chew gum and walk or do anything really after saying, “Hold my beer and watch this!”
- Weekly COVID-19 deaths likely peaked at 542 deaths the week ending December 12th. However, weekly totals in the upper-300s, mid-400s are likely for several more weeks. So far, at least 26001 Arizonans have lost their lives to COVID-19.
Forecast reports to date, available as PDFs
Download PDF to view additional charts of Arizona counties, available in appendix of report.
2021 Reports
Based on what we know now about this pandemic, we support guidelines for social distancing to slow the spread of the virus and urge everyone to follow the recommendations provided by the Centers for Disease Control and Prevention (CDC) to protect yourself, your family, your neighbors, and your employees. Please heed the recommendations as provided by the CDC.
COVID covid coronavirus virus covid19 corona forecast model