
Weekly Arizona COVID-19 Data Report – Dr. Joe Gerald, March 5 Update
Note this forecast page is not the most recent forecast available.
View the most current forecast report
Researcher Analyzes Arizona COVID-19 Spread Models for Decision-Makers
The following information regarding the spread of COVID-19 in Arizona was prepared by Joe Gerald, MD, PhD, a researcher at the Mel and Enid Zuckerman College of Public Health (MEZCOPH) at the University of Arizona. This information has also been reviewed by other MEZCOPH faculty.
This data were obtained from the Arizona Department of Health Services COVID-19 webpage and reflect conditions in Arizona as of March 5, 2021.
This information is intended to help guide our response to the outbreak. It is not intended to predict how this pandemic will evolve. Rather, this model extrapolates what might occur if current conditions remain unchanged. As regional authorities and healthcare providers respond, their actions are expected to mitigate the worst consequences of this pandemic.
![]()
COVID-19 Disease Outbreak Forecast
Arizona State and Pima County
Updated March 5, 2021
Disclaimer: This information represents my personal views and not those of The University of Arizona, the Zuckerman College of Public Health, or any other government entity. Any opinions, forecasts, or recommendations should be considered in conjunction with other corroborating and conflicting data. Updates can be accessed at https://publichealth.arizona.edu/news/2021/covid-19-forecast-model.
For the week ending February 28th, at least 6872 Covid-19 cases were diagnosed in Arizona (Figure 1). This represents a 29% decrease from last week’s initial tally of 9649 cases and marks the seventh straight week of decline. The prior week’s tally was upwardly revised by 4% (375 cases) to 10024 cases this week. The outbreak is evenly distributed by age (Figure 2). In terms of cases, the magnitude and length of the winter outbreak was approximately twice that of the summer outbreak making it about four times larger overall.
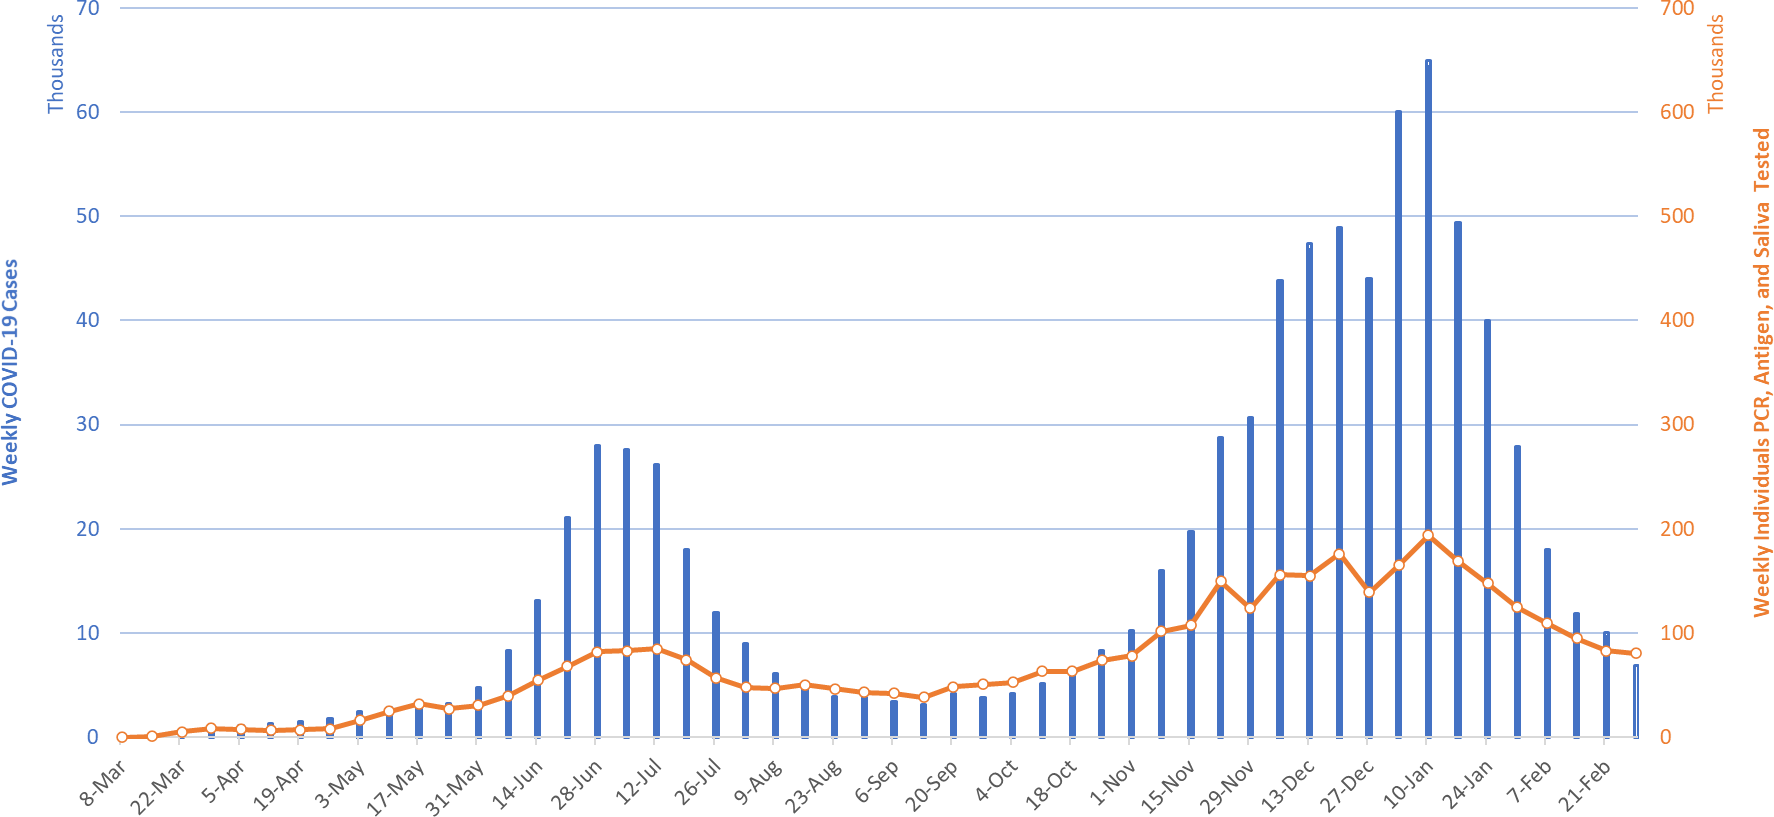
Figure 1. Newly Diagnosed Covid-19 Cases in Arizona and Number of Individuals Undergoing Covid-19 Diagnostic Testing March 1 through February 28, 2021 |
Arizona is now transitioning from a period of elevated risk to one of moderate risk with continuing, albeit smaller, improvements likely in the coming weeks. Hospital capacity remains adequate to meet Arizona’s foreseeable needs; however, it will be several months before the backlog of non-Covid care is fully addressed.
While residents and businesses should continue to follow recommended public health mitigation efforts, normalization of lower risk activities is reasonable as case rates have fallen below 100 new diagnoses per 100,000 residents per week. New cases are now being diagnosed at a rate of 94 per 100K per week. For reference, September 8th marked the fall nadir between the summer and winter outbreaks at 38 per 100K per week. Arizonans who are at risk of developing severe disease (e.g., age or comorbid conditions) should remain sheltered as much as feasible until fully vaccinated.
Note: Data for this report was updated Friday, March 5 allowing 4 full days to adjudicate cases and keep week-over-week backfill <10%. This allows more interpretable comparisons and graphics. All comparisons are week-over-week changes. Future updates will be released on Saturdays.
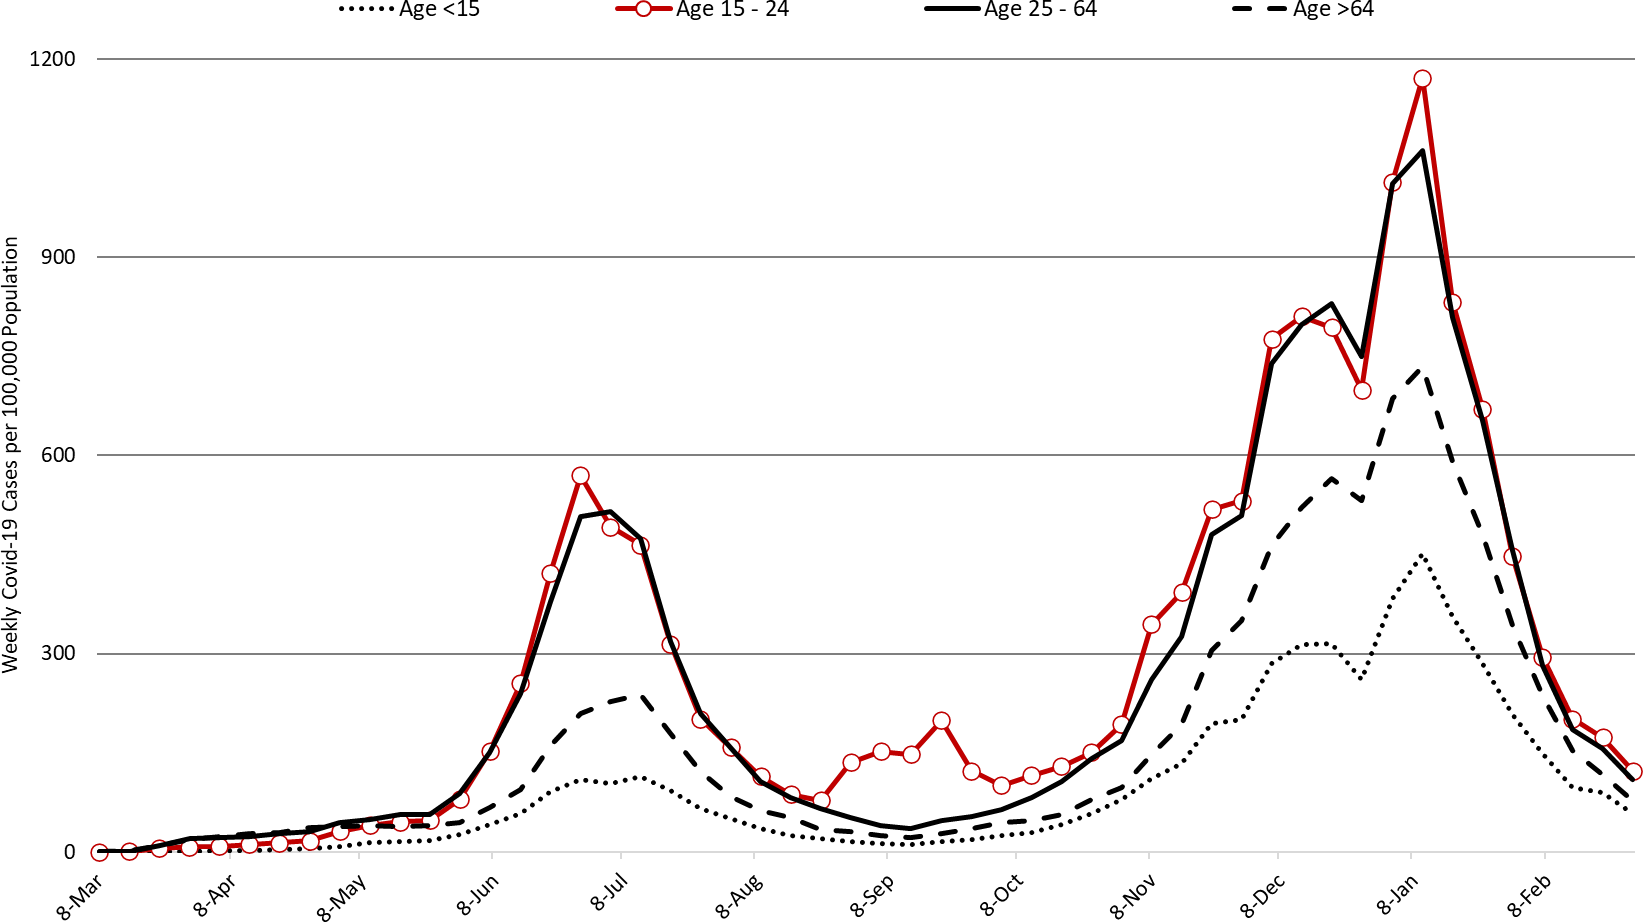
Figure 2. Newly Diagnosed Covid-19 Cases in Arizona by Age Group March 1 through February 28, 2021. |
Test positivity among those undergoing traditional nasopharyngeal PCR testing has resumed its decline after a brief pause last week, declining from 14% the week ending February 21st to 10% the week ending February 28th (Figure 3). Positivity is nearing the recommended 5 – 10% for optimal public health practice.
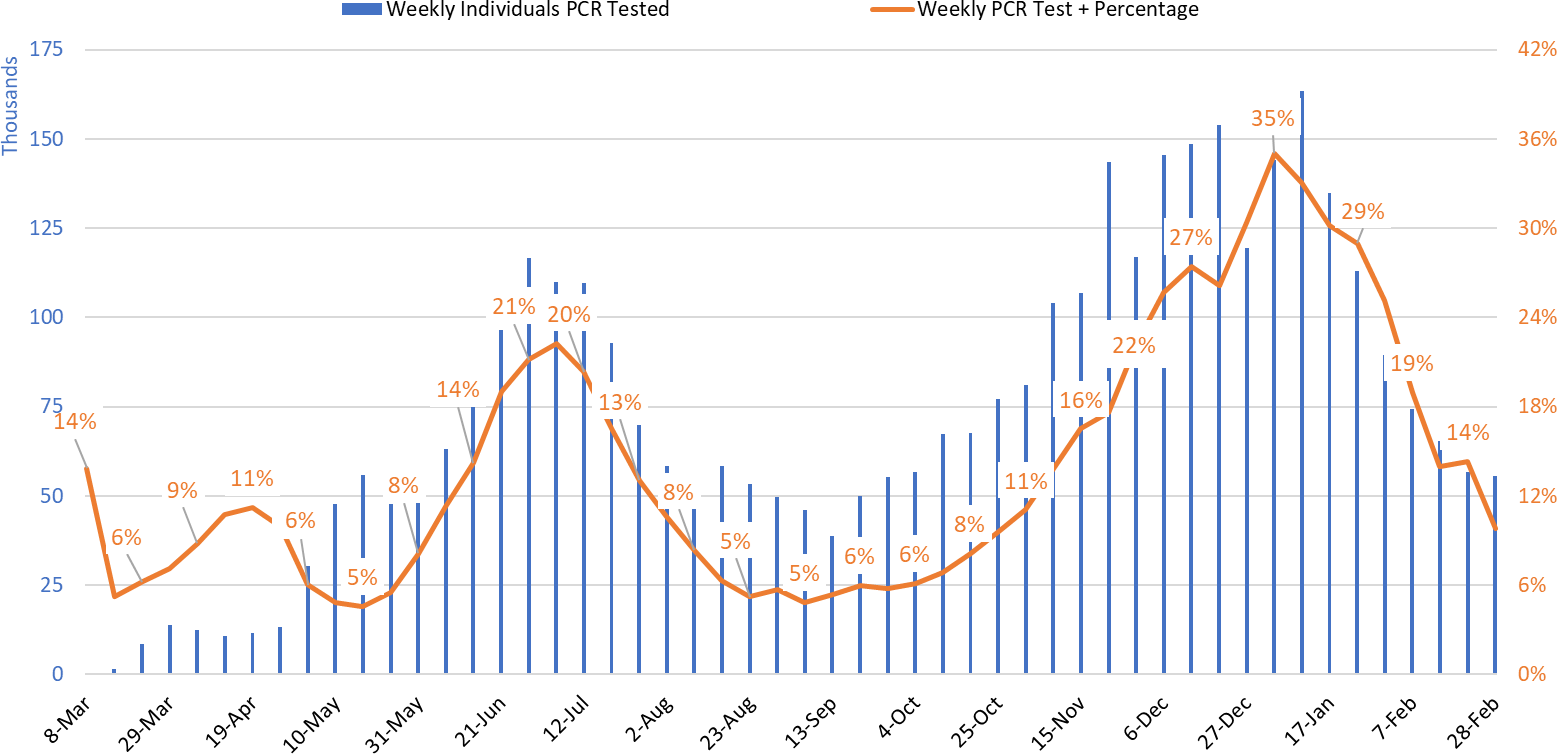
Figure 3. Weekly Number Patients Undergoing Traditional Nasopharyngeal PCR Testing and Associated Percent Positivity March 1 – February 28, 2021. |
As of March 5th, 966 (11%) of Arizona’s 8568 general ward beds were occupied by Covid-19 patients, a 27% decrease from the previous week’s 1317 occupied beds (Figure 4 and Figure 5 Panel A). Another 952 (11%) beds remained available for use. The number of available beds is lower than the previous week’s 1002 beds.
Covid-19 occupancy has dropped by 81% from its January 11th peak of 5082 ward patients. Nevertheless, hospitals remain above seasonal occupancy.
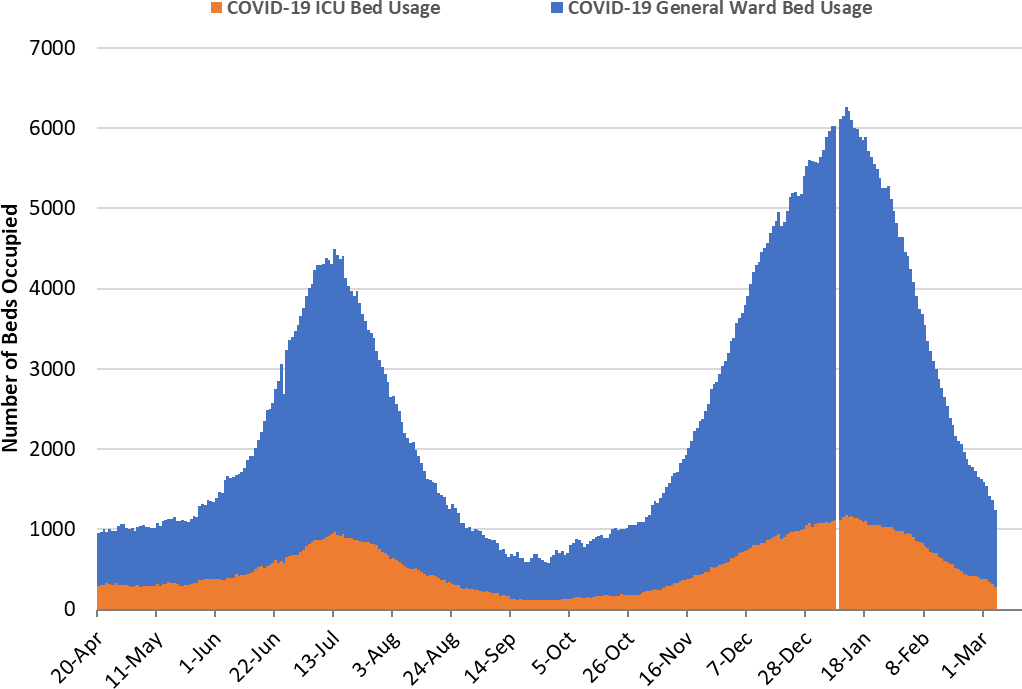
Figure 4. Arizona Daily Covid-19 General Ward and ICU Census April 20 – March 5, 2021. |
As of March 5th, 280 (16%) of Arizona’s 1751 ICU beds were occupied with Covid-19 patients, a 33% decrease from the prior week’s count of 415 patients (Figure 4 and Figure 5 Panel B). An additional 263 (15%) ICU beds remained available for use. This is higher than the prior week’s 246 available beds. ICU occupancy has fallen 76% from its January 11th peak of 1183 occupied beds.
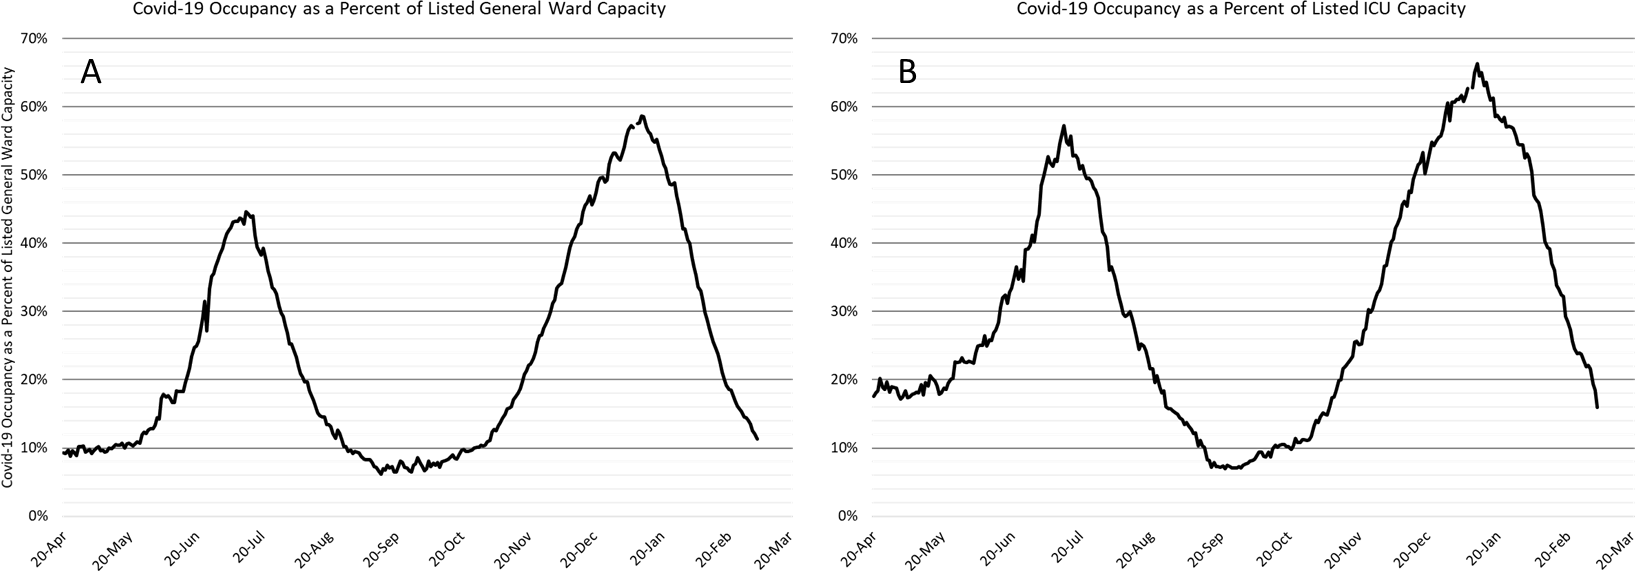
Figure 5. Covid-19 Occupancy as a Percent of Listed General Ward (A, left) and ICU (B, right) Capacity in Arizona April 20 – March 5, 2021. |
While Arizona hospitals’ safety margins remain low, they are slowly improving (Figure 6). Medically necessary procedures are now being scheduled in a more typical manner. Nevertheless, the backlog of postponed care will take months to resolve. As capacity constraints are lessened, care practices should return to those prior to the outbreak ensuring all patients will receive optimal care. Nevertheless, hospitals will remain crowded through the end of March – early April before returning to pre-outbreak levels assuming continued reductions in viral transmission.
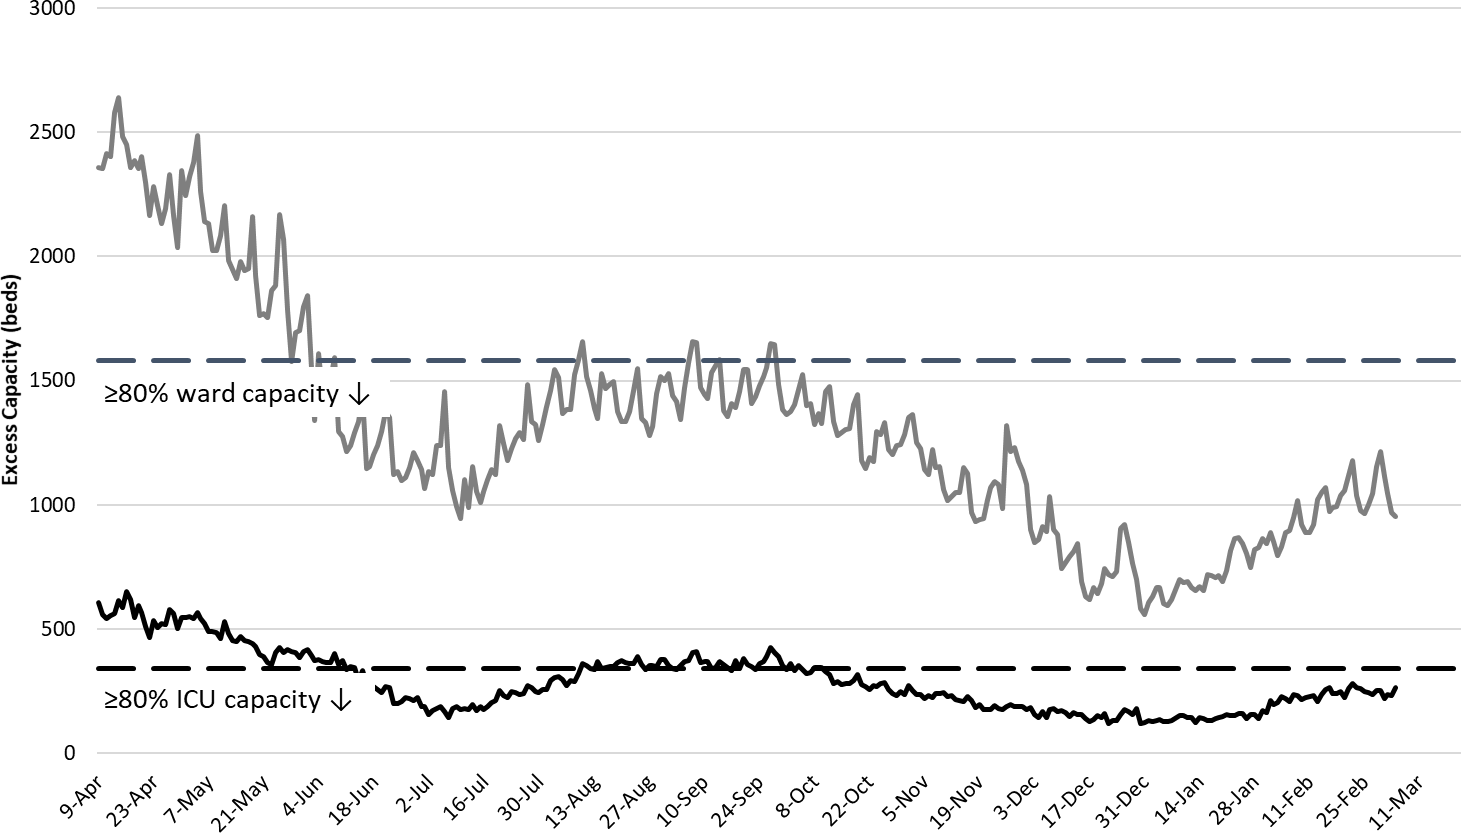
Figure 6. Observed Excess Non-Surge General Ward and ICU Capacity April 20 – March 5, 2021. |
The week ending January 17th remains Arizona’s deadliest with 1028 deaths (Figure 7). The week of January 17th represents peak mortality with subsequent improvements for the foreseeable future. Nevertheless, Covid- 19 deaths are expected to remain high for the next 1 - 3 weeks, falling below 200 per week by the end of March.
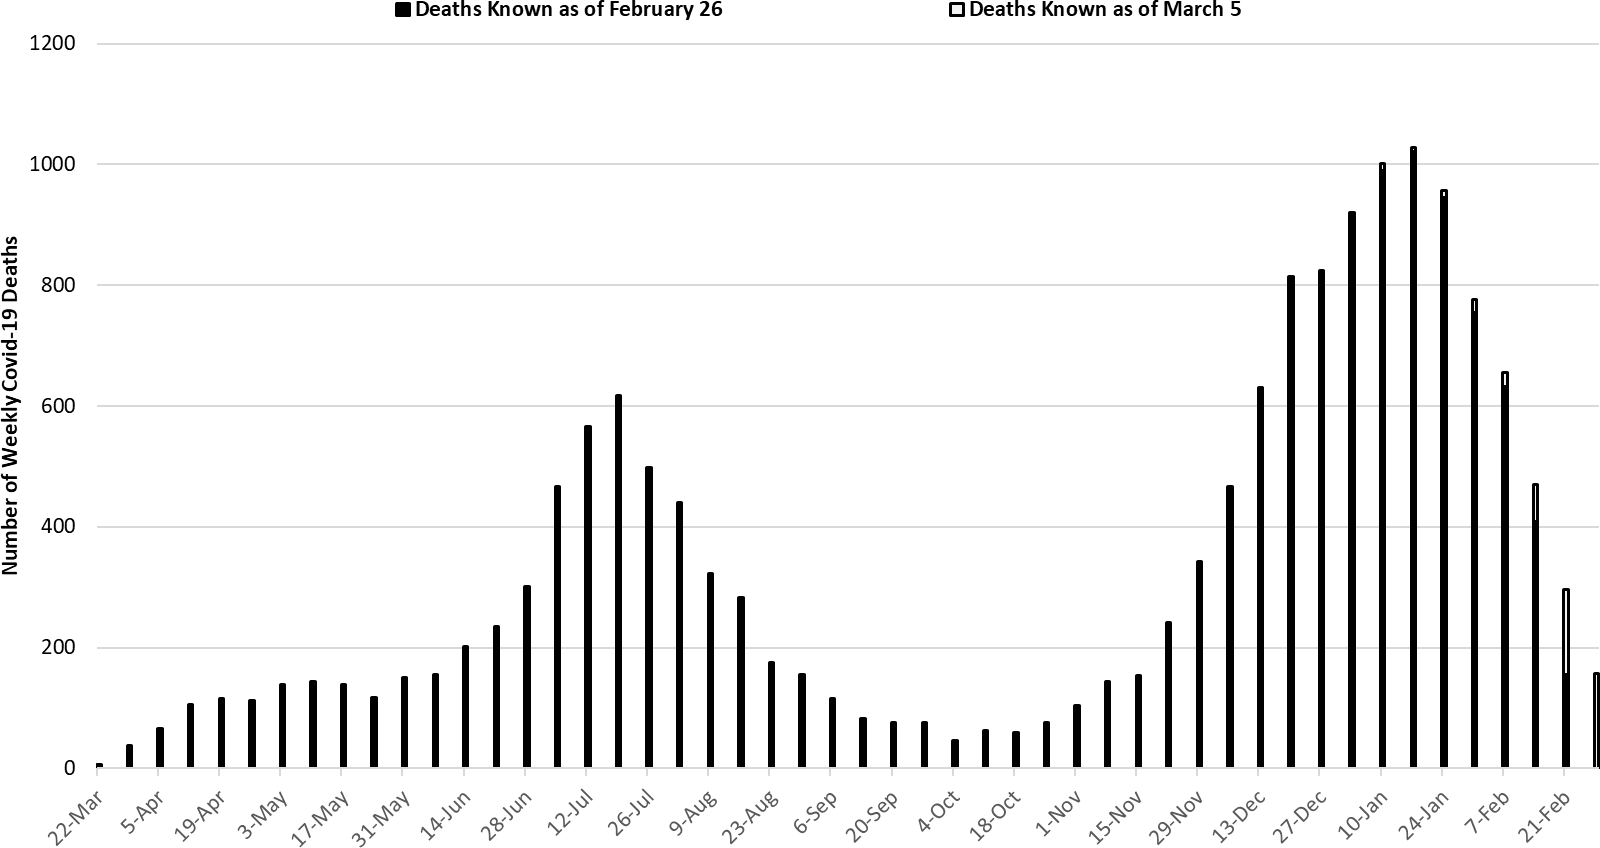
Figure 7. Weekly Arizona Covid-19 Deaths March 1 – February 28, 2021. |
Pima County Outlook
For the week ending February 28th, 826 Pima County residents were diagnosed with Covid-19, a 24% decrease from the 1093 cases initially reported last week (Figure 8).
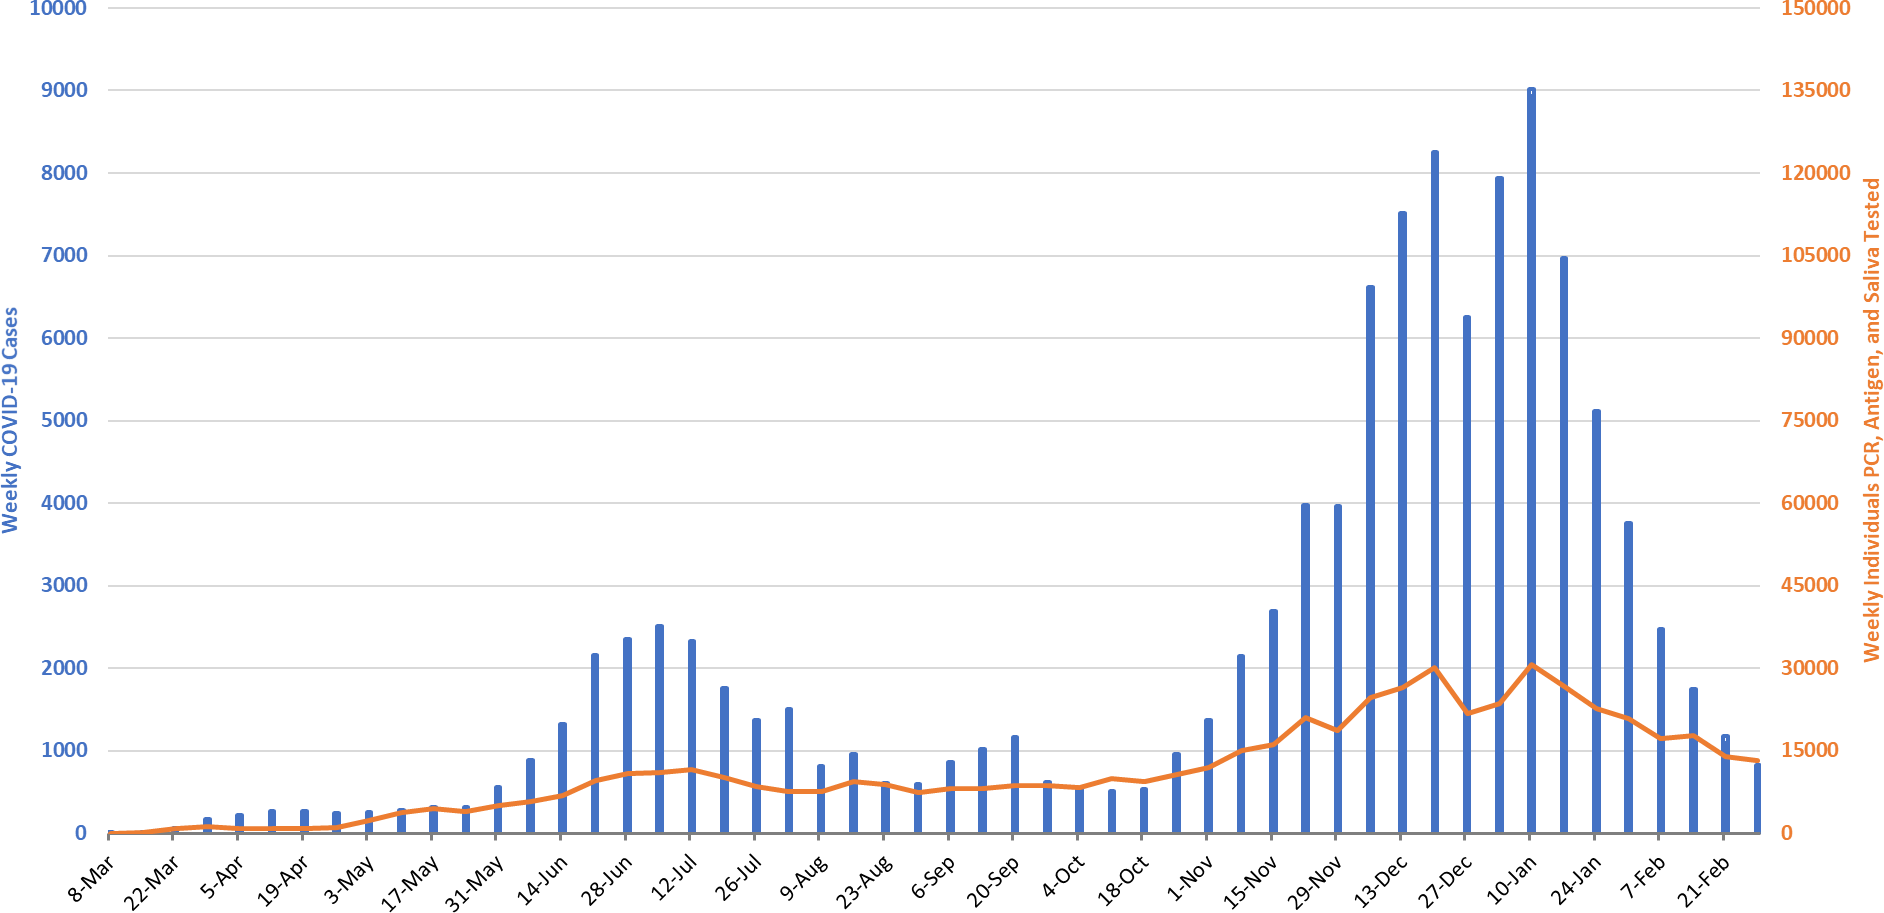
Figure 8. Covid-19 Cases and Individuals Undergoing Diagnostic Testing in Pima County Mar 1 – Feb 28. |
Last week’s initial tally of 1093 cases was upwardly revised by 7% (81 cases) to 1174 cases. New cases are being diagnosed at a rate of 79 cases per 100K residents per week. For reference, October 9th marked a nadir between the summer and winter outbreak at 46 cases per 100K residents per week. Trends are similar across the various age groups (Figure 9).
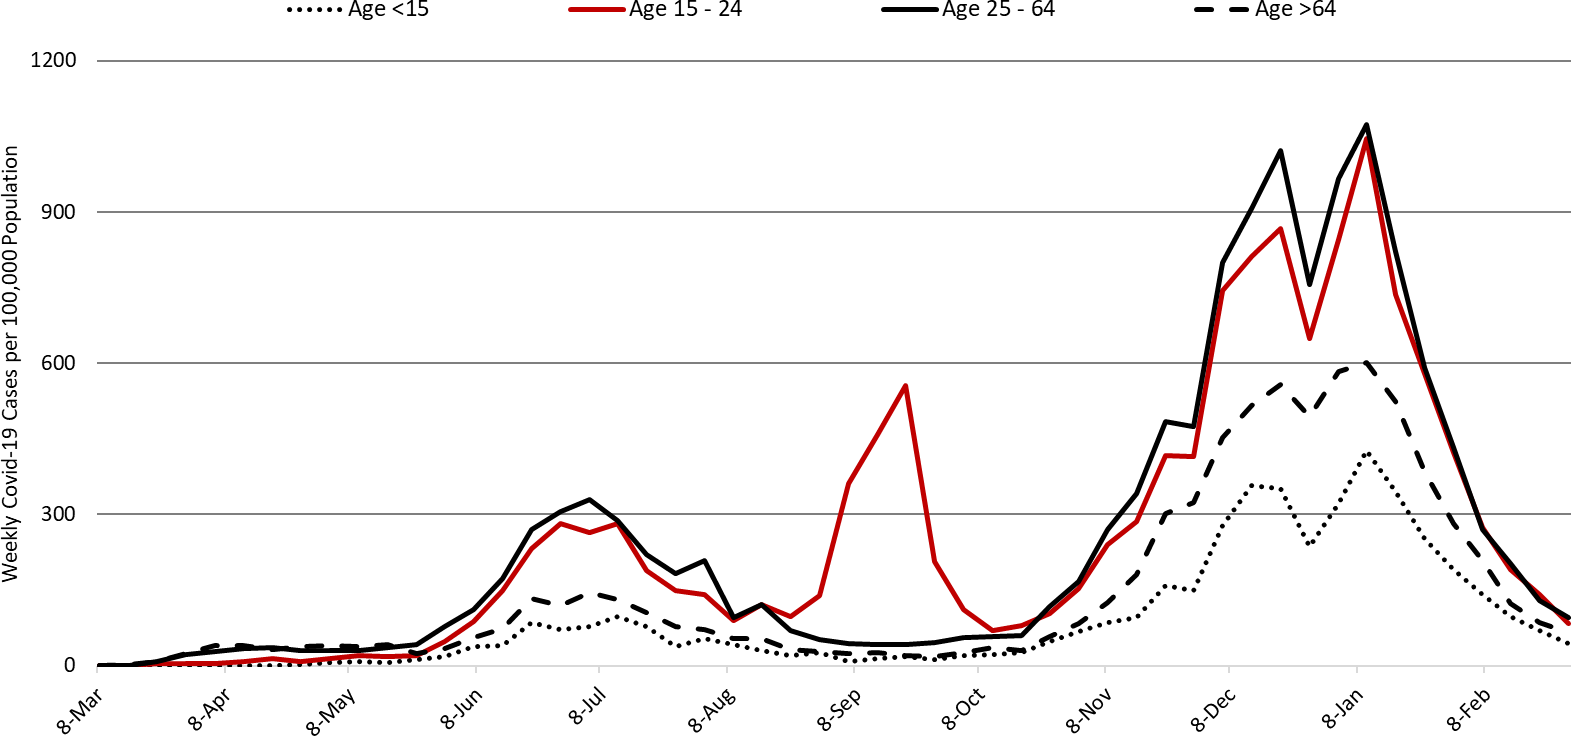
Figure 9. Covid-19 Cases by Age Group in Pima County from March 1 – February 28, 2021. |
Commentary on Governor Ducey’s Executive Order: Open for In Person Learning (2021-4)
- The CDC defines, and Governor Ducey acknowledges, 4 risk levels based on community transmission rates: low, moderate, substantial, and high. When risk is low or moderate, both the CDC and Governor Ducey call for K – 12 schools to be open. When risk is substantial or high, the Governor generally calls for greater in-person instruction than the CDC.
- Assuming conditions continue to improve, Gov Ducey’s executive order aligns closely with the current CDC recommendations.
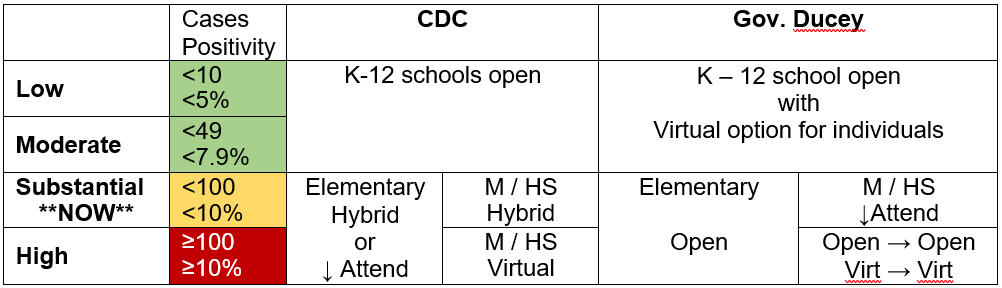
- If conditions worsen, then his plan poses some greater risk. This is particularly true if cases rates are high enough to warrant the high transmission designation, >100 new cases per 100K residents per week or >10% test positivity.
- Under substantial transmission (e.g., current conditions), Govern Ducey would require elementary schools to provide in-person instruction whereas the CDC would recommend hybrid learning modes or in-person instruction with reduced attendance. Governor Ducey would require middle and high schools to offer in-person instruction with reduced attendance whereas the CDC recommends they be in a hybrid learning mode.
- Under high transmission, Governor Ducey would require middle and high schools that are already offering in-person instruction as of March 15th to remain in the in-person instructional mode. Alternatively, the CDC would call for virtual instructional mode if community transmission were rated as high.
- Maricopa and Pima County transmission rates both warrant a rating of substantial risk at present. While both are trending towards moderate risk, Pima County is the likeliest to achieve moderate risk by March 15th.
- Maricopa County: 99 cases per 100K per week (substantial) / <10% positivity (substantial)
- Pima County: 79 cases per 100K per week (substantial) / <10% positivity (substantial)
- Assuming conditions continue to improve, Gov Ducey’s executive order aligns closely with the current CDC recommendations.
- Four broad considerations for school reopening. The goal is to weigh the benefits of in-person instruction to the student against the risk opening poses to the broader community:
- What are current community transmission rates and what trends are projected?
- What resources, mitigation practices and infrastructure do schools have to reduce risk?
- What is the age of students / grade level as younger students seem to pose lower risk than older ones?
- What is the vaccination status of teachers and at-risk community members?
- When considering school reopening 2 things that seem contradictory are both in fact true:
- Little transmission occurs between students-students and between students-teachers in classrooms such that classrooms are generally safe environments when mitigation practices are followed.
- Closing schools has been one of the more effective government interventions to curb community transmission – primarily due to the numerous activities that coincide with classroom instruction not classroom instruction itself.
- Six broad things schools can do to mitigate risk:
- Enforce mask policies for students, faculty, and staff
- Maintain recommended physical distancing
- Ensure adequate ventilation in classrooms
- Create pods, cohorts, or staggered schedules to reduce mixing
- Frequently sanitize high touch / high contact environmental objects
- Develop contact tracing programs for known cases
Summary
- This week saw a seventh straight week of meaningful declines in Covid-19 cases and hospital occupancy. In some communities, absolute levels of SARS-CoV-2 viral transmission have fallen below the 100 new cases per 100,000 residents per week threshold.
- As of February 28th, new cases were being diagnosed at a rate of 94 cases per 100,000 residents per week (Figure 10). This rate is declining by 43 cases per 100,000 residents per week. Compared to last week, the pace at which conditions improved quickened this week; however, improvements will likely slow over the coming weeks.
- Arizona has the 26th highest viral transmission rate in the US according to the CDC; however, it remains the 6th hardest hit state overall.
- All residents should continue to wear a mask in public, avoid large social gatherings, maintain physical distance from non-household contacts, avoid >15 minutes contact in indoor spaces, especially if physical distancing is inadequate and adherence to face masks is low.
- While residents and businesses should continue to follow the recommended public health mitigation efforts, normalization of lower risk activities is reasonable in communities where case rates are below 100 new diagnoses per 100,000 residents per week.
- The test positivity rate for traditional nasopharyngeal PCR testing has reached 10% which is near the recommended 5 – 10% for optimal public health practice.
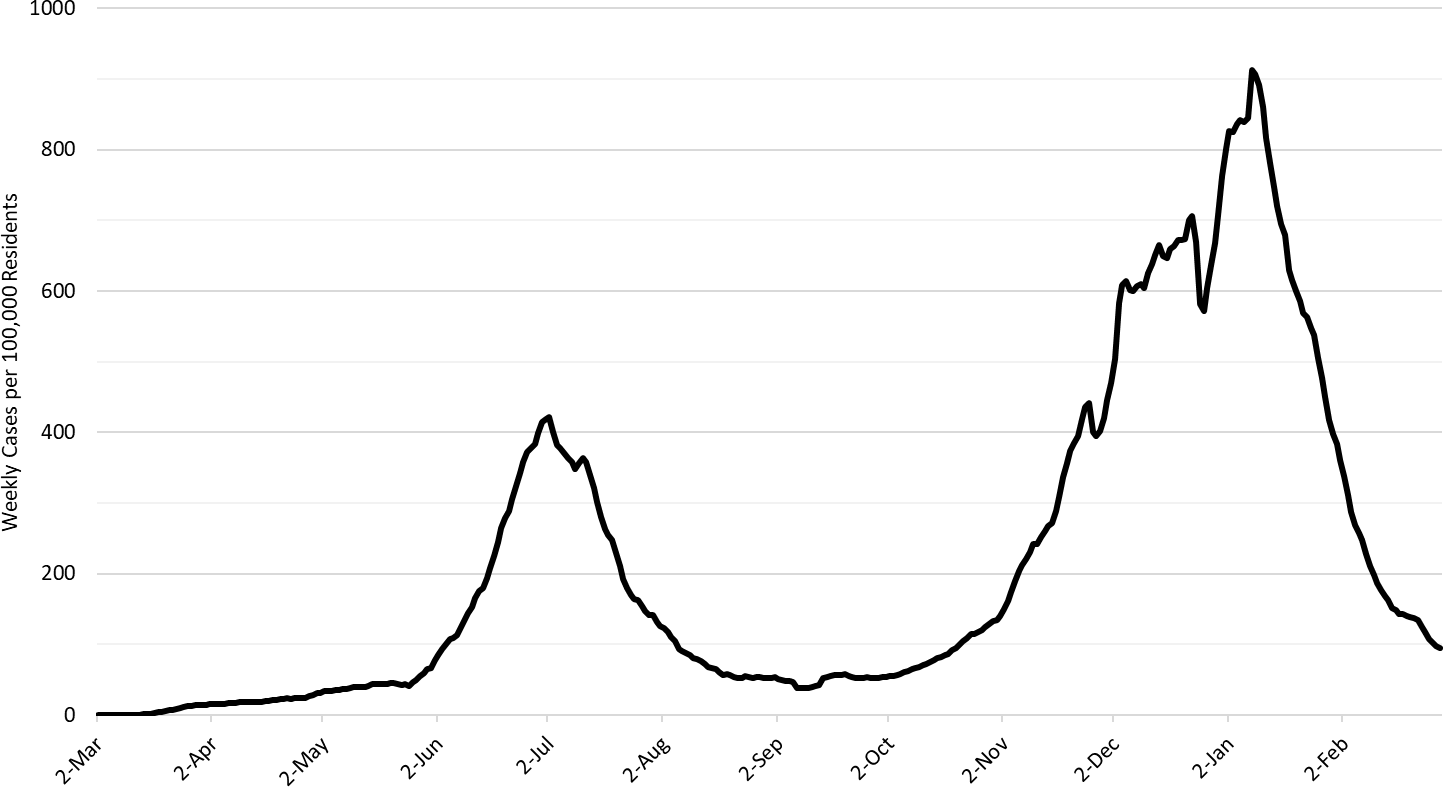
Figure 10. 7-Day Moving Average of Arizona Covid-19 Cases by Date of Test Collection Mar 1 – Feb 28, 2021. |
- In some communities, absolute levels of transmission and test positivity have reached levels that warrant a return to in-person instruction using a hybrid mode or reduced attendance (see CDC Recommended Mitigation Strategies for K – 12 Learning Modes). Full in-person instruction is not recommended by the CDC until transmission falls below 50 cases per 100K residents per week.
- Hospital Covid-19 occupancy continues to decline in the ward and ICU. Access to care however, remains somewhat restricted as the backlog of medically necessary non-Covid procedures is addressed.
- Arizona is still reporting a large number of weekly deaths and this count may underestimate true fatalities. The week ending January 17th will be Arizona’s deadliest with >1000 deaths. Arizona’s weekly tally of deaths ranks it 8th in the nation while its overall rank remains 6th since the outbreak began.
- According to the CDC, 11.7% of Arizona adults have received at least 2-doses of vaccine while another 11.8% have received 1-dose. The ADHS Dashboard is reporting slightly higher levels. To date, Arizona has administered 78% of its delivered doses.
Forecast reports to date, available as PDFs
Download PDF to view additional charts of Arizona counties, available in appendix of report.
March 5
2020 Reports
Based on what we know now about this pandemic, we support guidelines for social distancing to slow the spread of the virus and urge everyone to follow the recommendations provided by the Centers for Disease Control and Prevention (CDC) to protect yourself, your family, your neighbors, and your employees. Please heed the recommendations as provided by the CDC, found at the following website: https://www.cdc.gov/coronavirus/2019-ncov/prepare/prevention.html
COVID covid coronavirus virus covid19 corona forecast model