
COVID-19 Forecast Models Report for Arizona, December 4
Note this forecast page is not the most recent forecast available.
View the most current forecast report
Researcher Analyzes Arizona COVID-19 Spread Models for Decision-Makers
The following information regarding the spread of COVID-19 in Arizona was prepared by Joe Gerald, MD, PhD, a researcher at the Mel and Enid Zuckerman College of Public Health (MEZCOPH) at the University of Arizona. This information has also been reviewed by other MEZCOPH faculty.
This data were obtained from the Arizona Department of Health Services COVID-19 webpage and reflect conditions in Arizona as of December 4, 2020.
This information is intended to help guide our response to the outbreak. It is not intended to predict how this pandemic will evolve. Rather, this model extrapolates what might occur if current conditions remain unchanged. As regional authorities and healthcare providers respond, their actions are expected to mitigate the worst consequences of this pandemic.

COVID-19 Disease Outbreak Forecast
Arizona State and Pima County
Updated December 4, 2020
Disclaimer: This information represents my personal views and not those of The University of Arizona, the Zuckerman College of Public Health, or any other government entity. Any opinions, forecasts, or recommendations should be considered in conjunction with other corroborating and conflicting data. Updates can be accessed at https://publichealth.arizona.edu/news/2020/covid-19-forecast-model.
**NOTICE** Arizona is experiencing a public health crisis where access to critical care services is limited due to shortages of space, personnel, and critical supplies. If not addressed within the next 1 - 2 weeks, this crisis will evolve into a humanitarian crisis leading to hundreds of preventable deaths. At this point, only shelter-in-place restrictions are certain to quickly and sufficiently curtail viral transmission. Because such restrictions impose substantial economic hardships, these measures should be augmented by state expansion of programs to provide direct economic assistance, reduce food insecurity, prevent foreclosure and evictions, and protect access to health services.
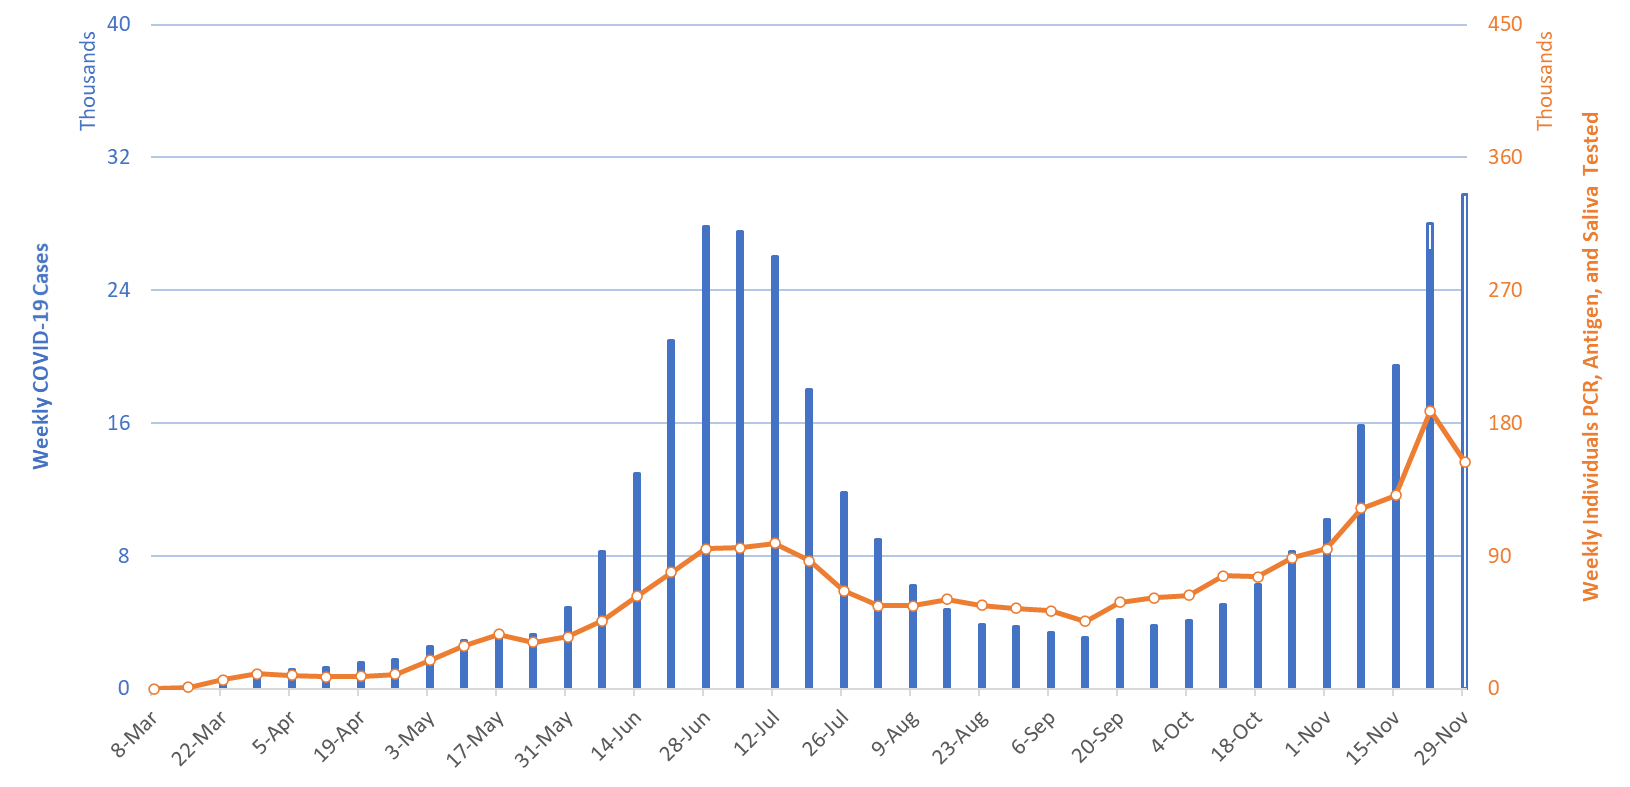
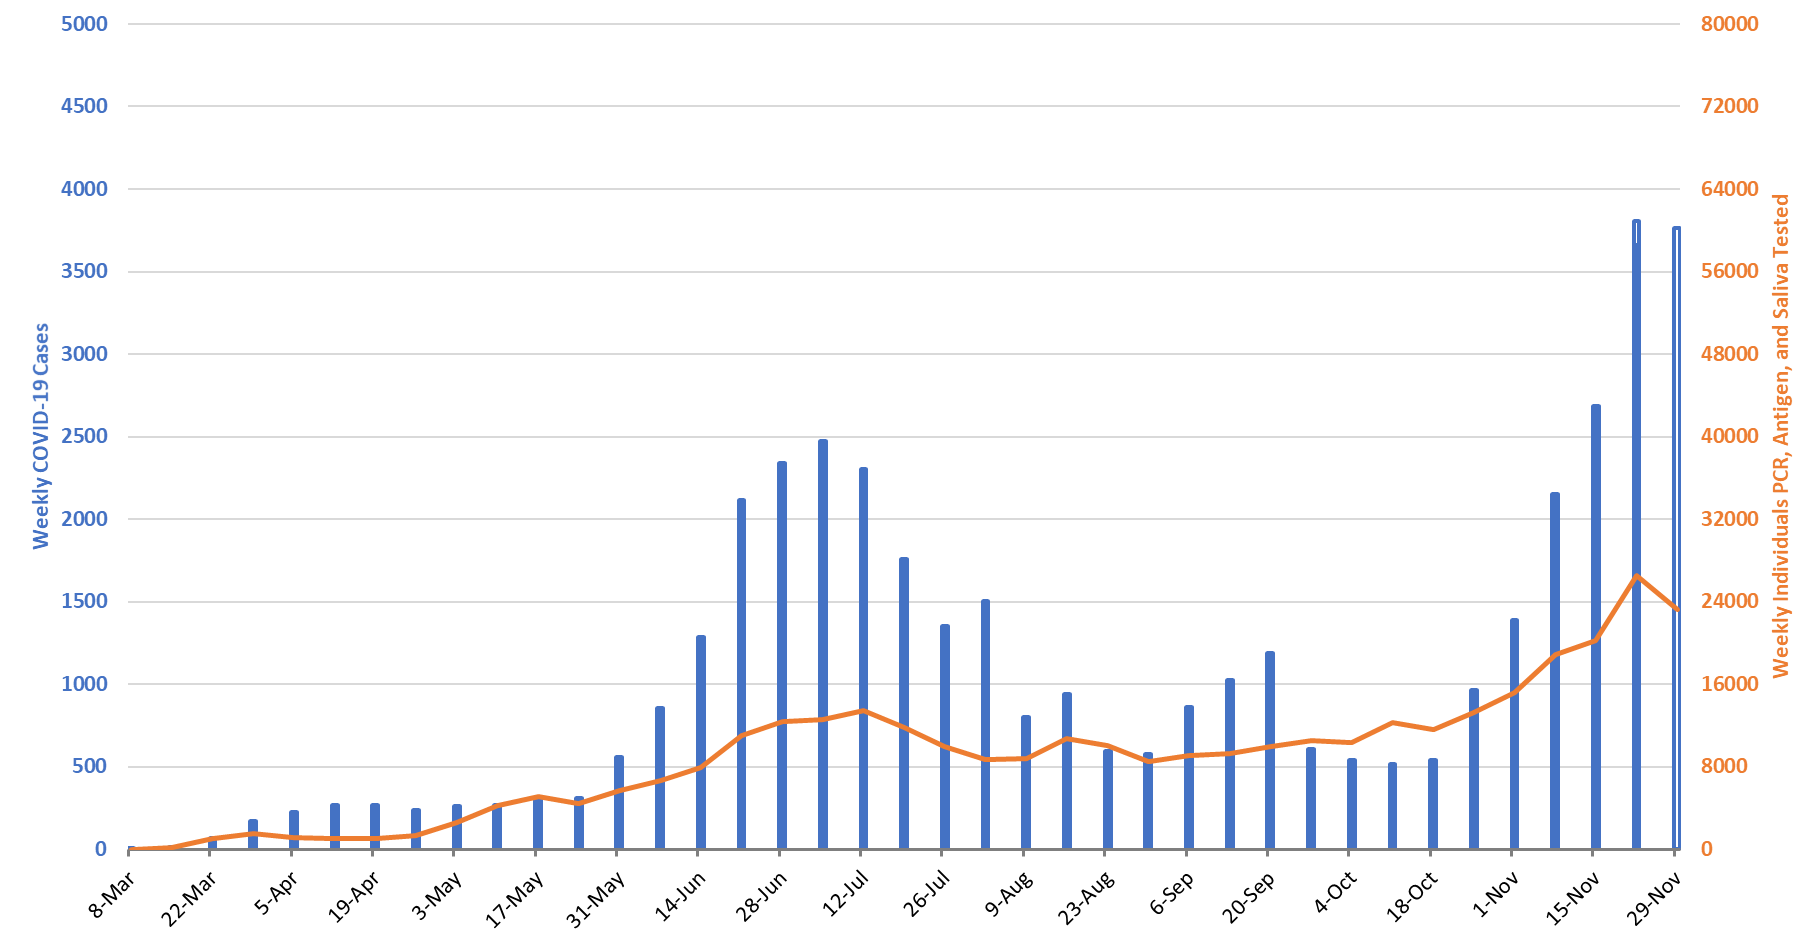
For the week ending November 29th, at least 29770 new Covid-19 cases were diagnosed in Arizona (Figure 1). This is a 13% increase from last week’s initial tally of 26406 cases and a new state record. Last week’s tally was upwardly revised this week by 1589 cases, a 6% increase. Assuming similar amounts of backfill, this week’s tally will rise by two thousand cases next week. The sharp decline in testing and an increase in test positivity indicates many cases that would have been detected were missed altogether or will be backfilled next week. Therefore, conditions are worse than this report indicates.
|
Figure 1. Newly Diagnosed Covid-19 Cases in Arizona and Number of Individuals Undergoing Covid-19 Diagnostic Testing March 1 through November 29. |
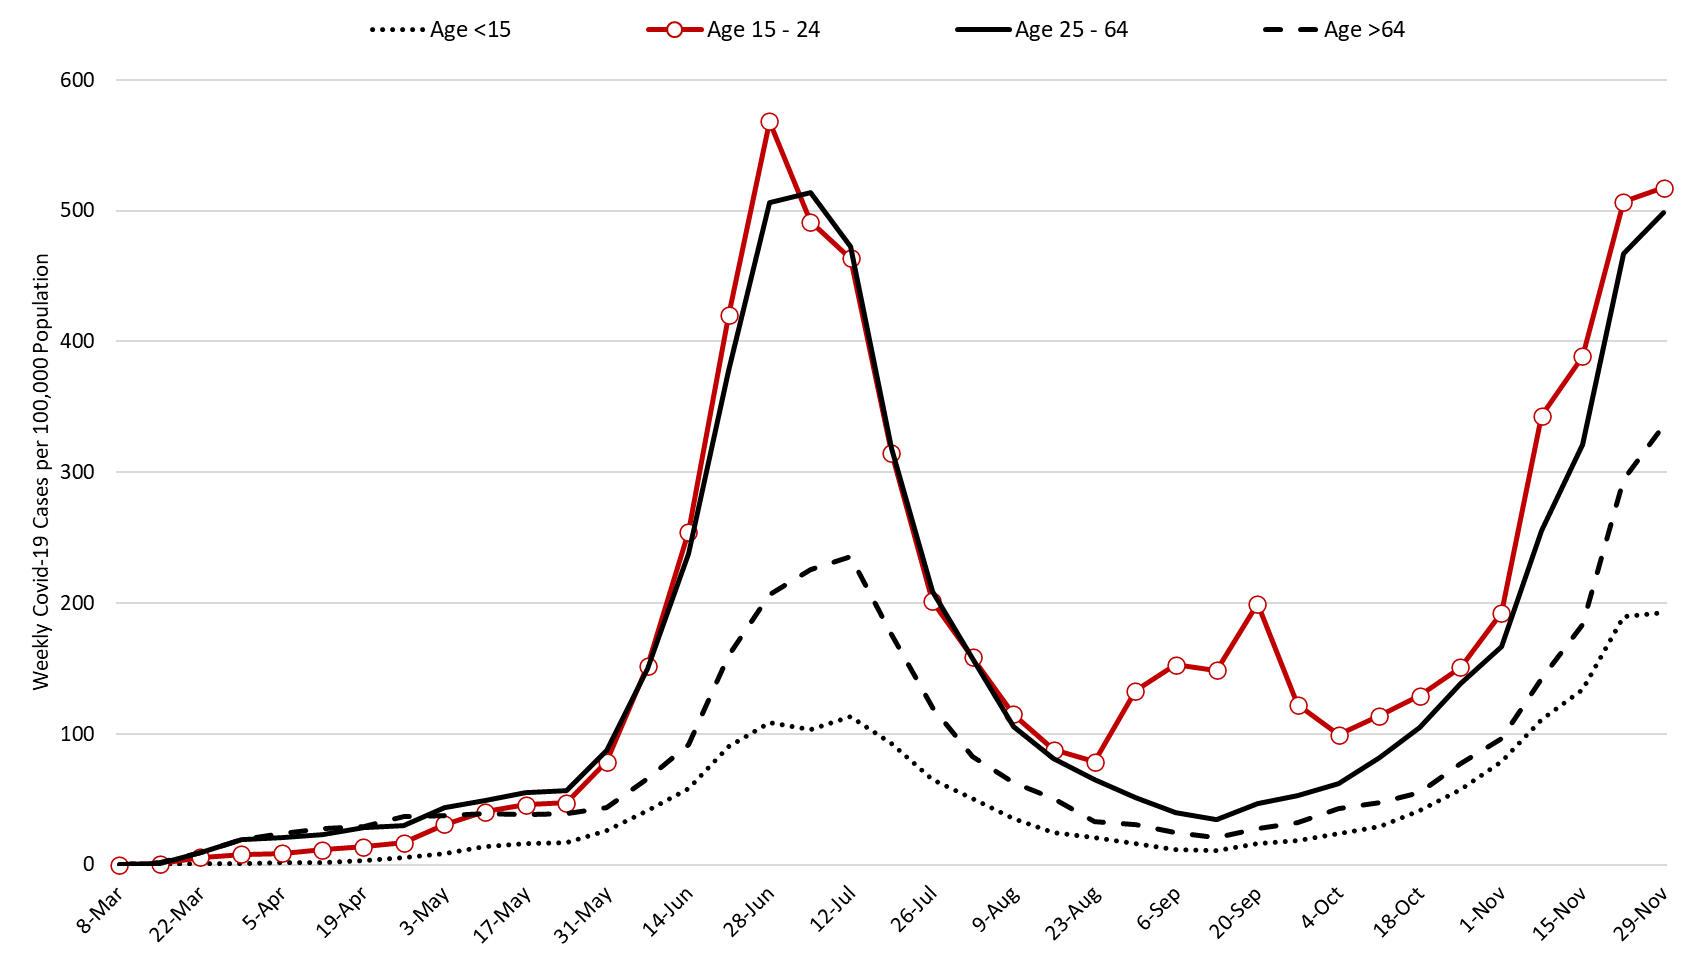
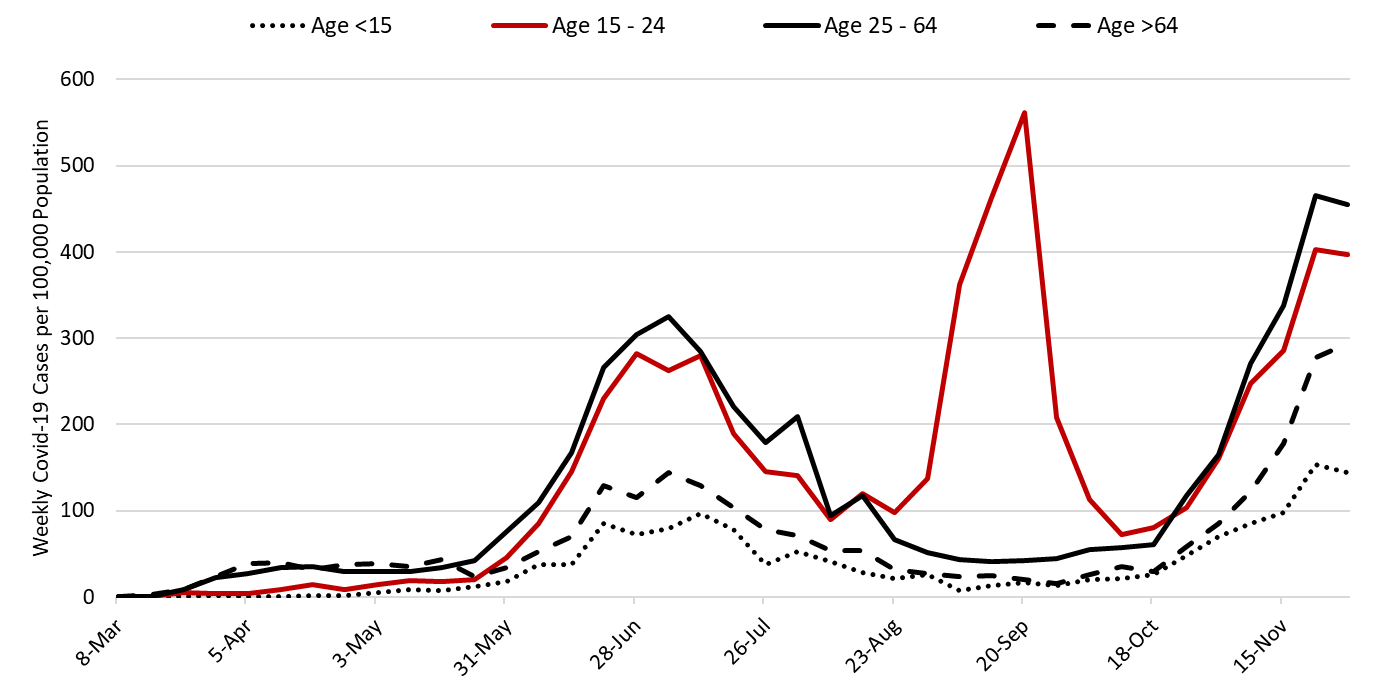
The outbreak remains broadly entrenched with increases among all age groups. However, the transmission rate among those >64 years of age is concerning given that it is 50% higher than the summer outbreak (Figure 2).
Note: Data for this report was updated Friday, December 4 allowing 4 full working days to adjudicate weekend cases. This should reduce week-over-week backfill to 10% allowing more interpretable comparisons and graphics. All comparisons are week-over-week changes. Given the lengthy reporting delays, future updates will continue to be released on weekends.
|
Figure 2. Newly Diagnosed Covid-19 Cases in Arizona by Age Group March 1 through November 29. |
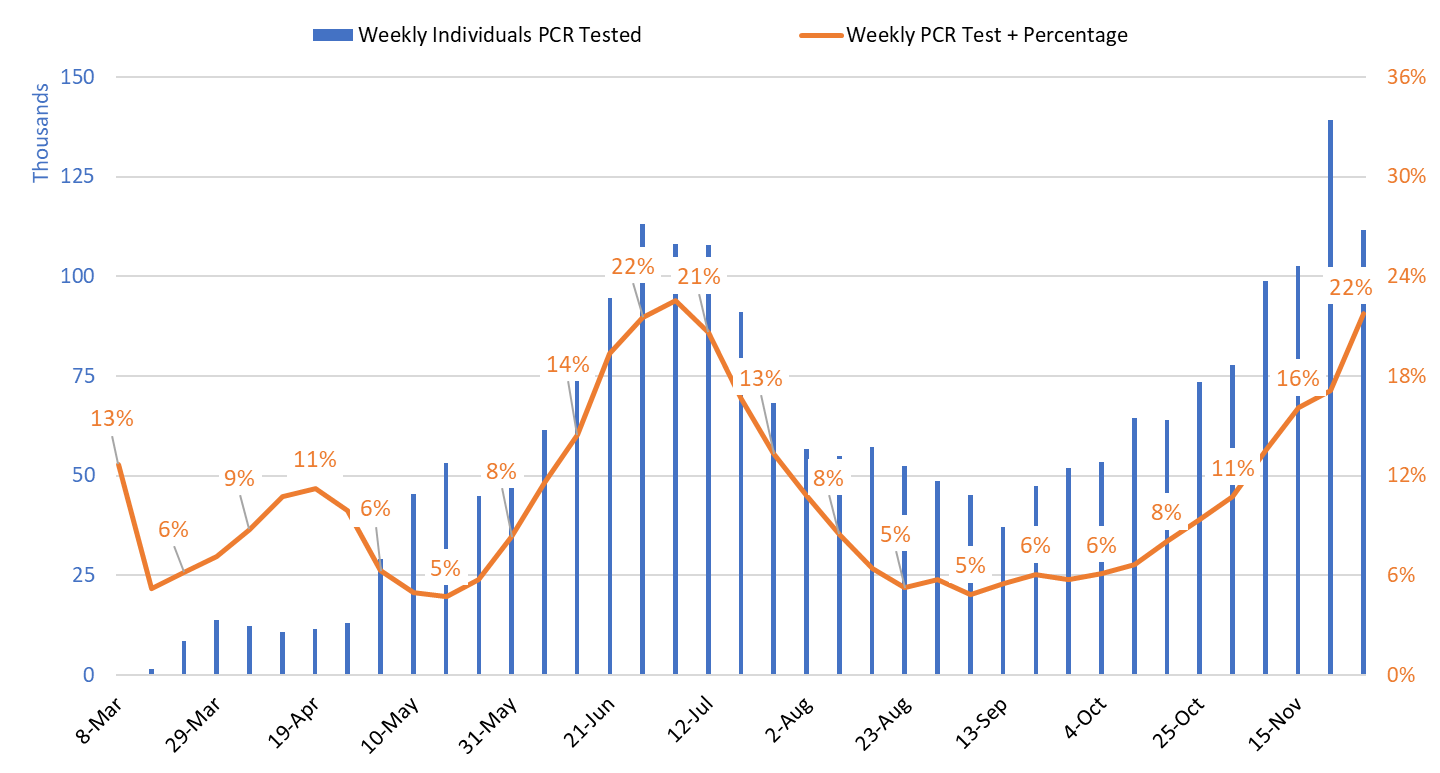
Test positivity among those undergoing traditional PCR testing continues to increase, reaching 21.8% this past week (Figure 3). Increasing test positivity indicates that viral transmission continues to increase despite the uncertainty surrounding actual case counts. Test positivity for antigen tests being conducted by the University of Arizona and by some long-term care facilities and retail clinics was 19.0% this week. Test positivity for saliva testing being conducted by Arizona State University for students and other groups was 16.1% this week.
|
Figure 3. Weekly Number Patients PCR Tested and Percent with Positive Test March 1 – November 29. |
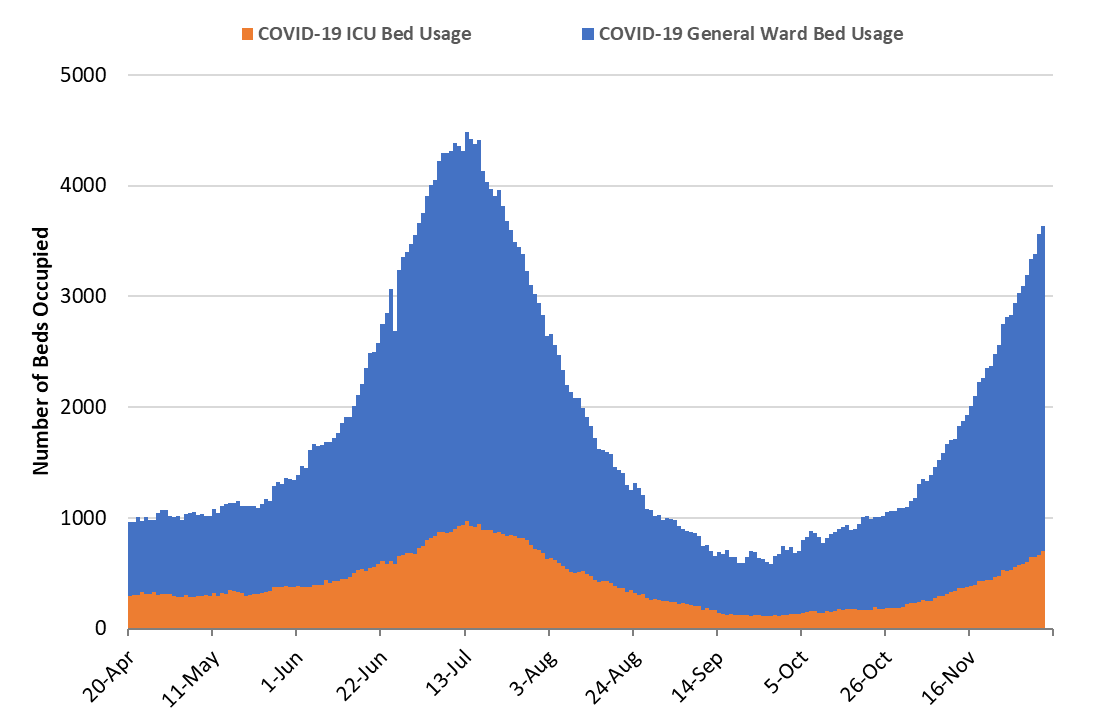
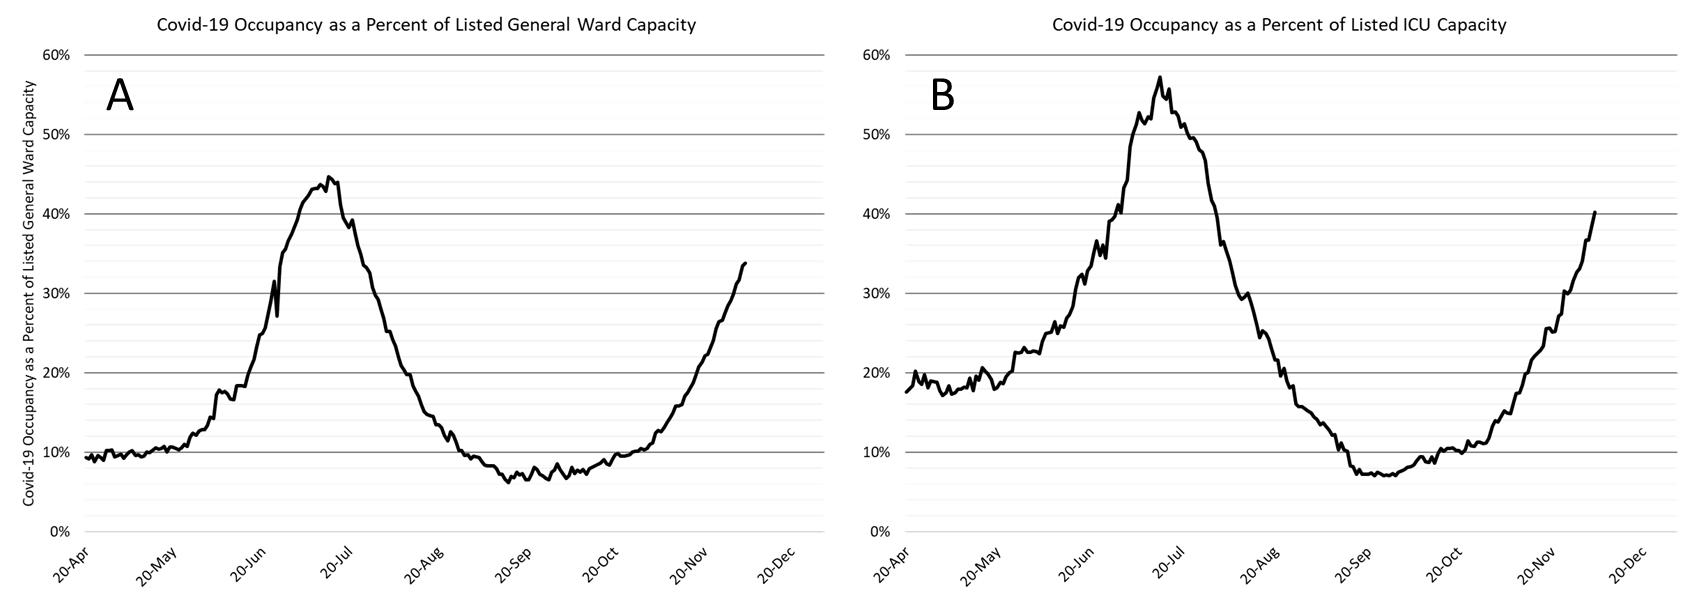
As of December 4th, 2931 (34%) of Arizona’s 8666 general ward beds were occupied by Covid-19 patients, a 23% increase from last week’s 2383 occupied beds (Figure 4 and Figure 5 Panel A). Another 861 (10%) beds were available for use. This is lower than the 1213 beds available during the week of Thanksgiving.
For reference, max Covid-19 ward occupancy was 3517 beds on July 13. If similar weekly increases persist, the previous peak will be reached by Friday, Dec 12th.
|
Figure 4. Arizona Daily Covid-19 General Ward and ICU Census April 20 – December 4. |
As of December 4th, 701 (40%) of Arizona’s 1743 ICU beds were occupied with Covid-19 patients, a 27% increase from last week’s count of 553 patients (Figure 4 and Figure 5 Panel B). An additional 144 (11%) ICU beds remain available. This is lower than last week’s 196 beds.
For reference, max Covid-19 ICU occupancy was 970 beds on July 13th. If similar weekly increases persist, the previous peak will be reached before Friday, December 19th.
|
Figure 5. Covid-19 Occupancy as a Percent of Listed General Ward (A, left) and ICU (B, right) Capacity in Arizona April 20 – December 4. |
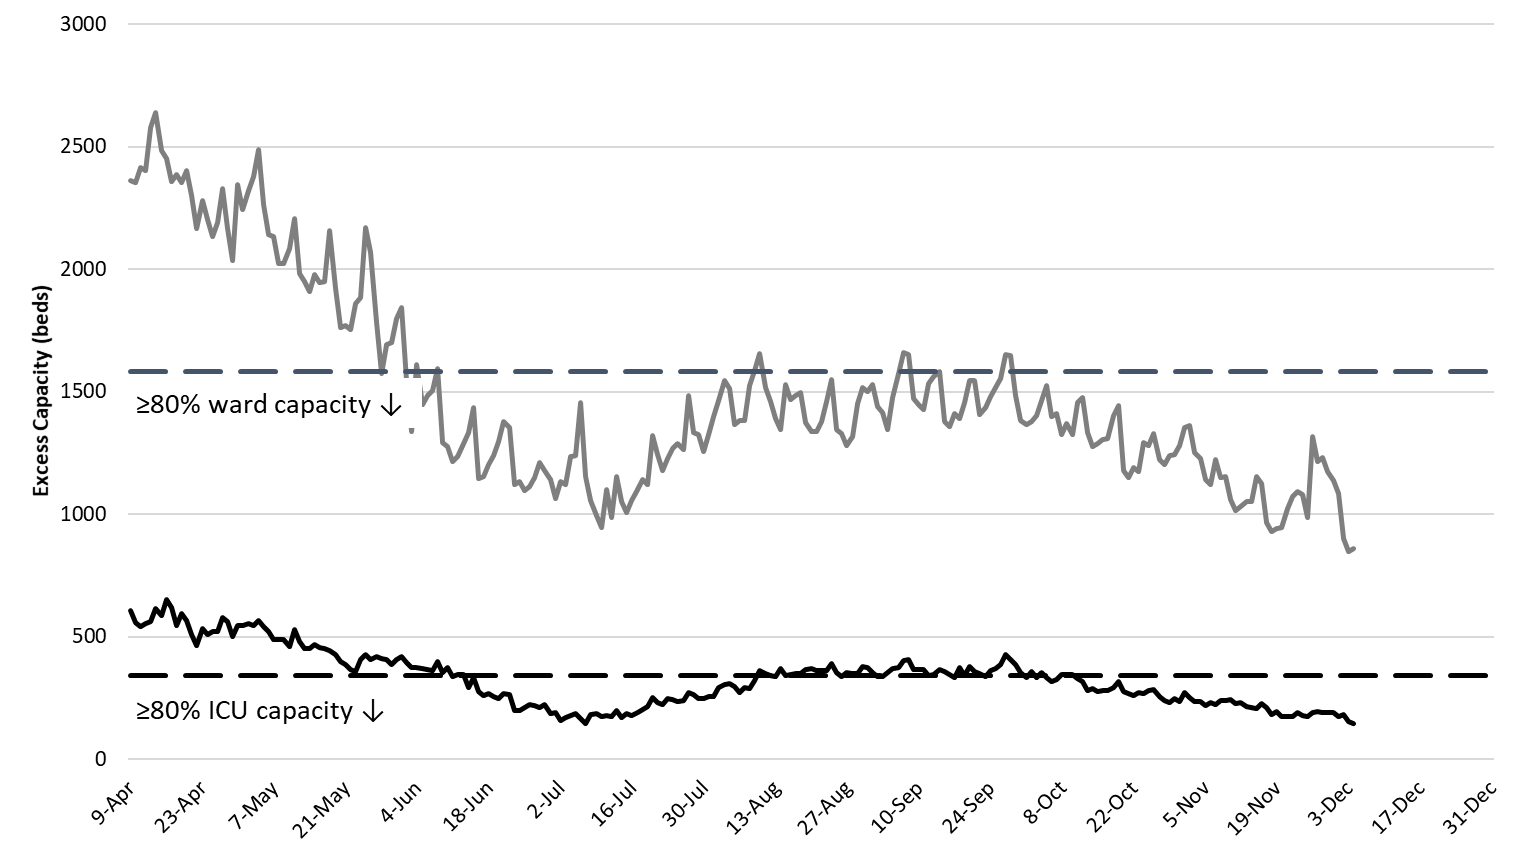
Arizona hospitals’ safety margin continues to erode in both the ward and ICU (Figure 6). Hospital occupancy is high not only because of Covid-19 admissions but also because hospitals continue to perform scheduled procedures and because of higher occupancy this time of year due to wintering part-time residents and viral respiratory season.
While occupancy data suggest Arizona hospitals should be under greater strain, the fact that admissions are dispersed across multiple units, not just Covid-specific units, means the workload is more evenly distributed across physicians, nurses and other health professionals. As Covid-19 admissions continue to increase, this advantage will be lost.
|
Figure 6. Observed Excess Non-Surge General Ward and ICU Capacity April 20 – December 4. |
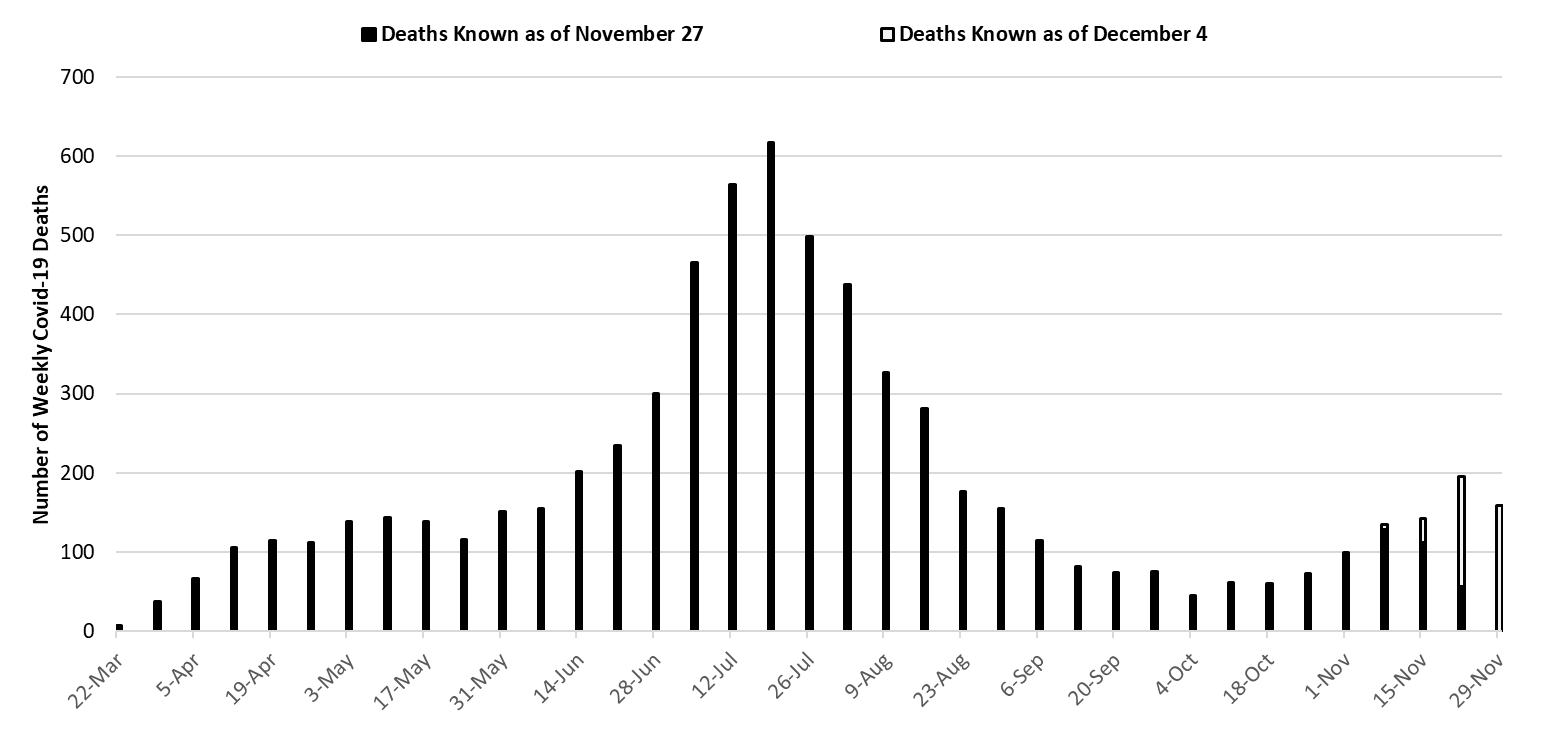
With 617 deaths, the week ending July 19th remains Arizona’s deadliest week (Figure 7). Weekly Covid-19 mortality reached a nadir of 46 deaths the week ending October 4th. Because cases have been increasing, deaths are now increasing. Sharper rises are expected over the coming weeks as deaths lag new cases by 14-days and are often only made known weeks later. However, the case fatality rate has held relatively stable at 1.7%. By Christmas, Arizona will be experiencing >500 deaths per week (30000 weekly cases now times .017 = weekly deaths 2 – 3 weeks from now). However, this toll will not be apparent until mid-January when all deaths are accounted for. Unidentified Covid-19 deaths (e.g., excess mortality) are not included in this estimate.
|
Figure 7. Weekly Arizona Covid-19 Deaths March 1 – November 29. |
Pima County Outlook
For the week ending November 29th, 3762 Pima County residents were diagnosed with Covid-19 (Figure 8). This represents a 3% increase from the 3660 initially reported last week. This tally once again sets a new record for cases observed in a single week. Test reporting remains relatively timely and case reporting delays only caused last week’s initial tally of 3660 cases to be upwardly revised by 4% (146 cases) this week.
|
Figure 8. Covid-19 Cases and Individuals Undergoing Diagnostic Testing in Pima County Mar 1 – Nov 29. |
However, the sharp decline in testing suggests additional cases were missed or will be backfilled next week. Increases in viral transmission are occurring across all age groups (Figure 9).
|
Figure 9. Covid-19 Cases by Age Group in Pima County from March 1 – November 29. |
Updated Arizona State University Covid-19 Forecast
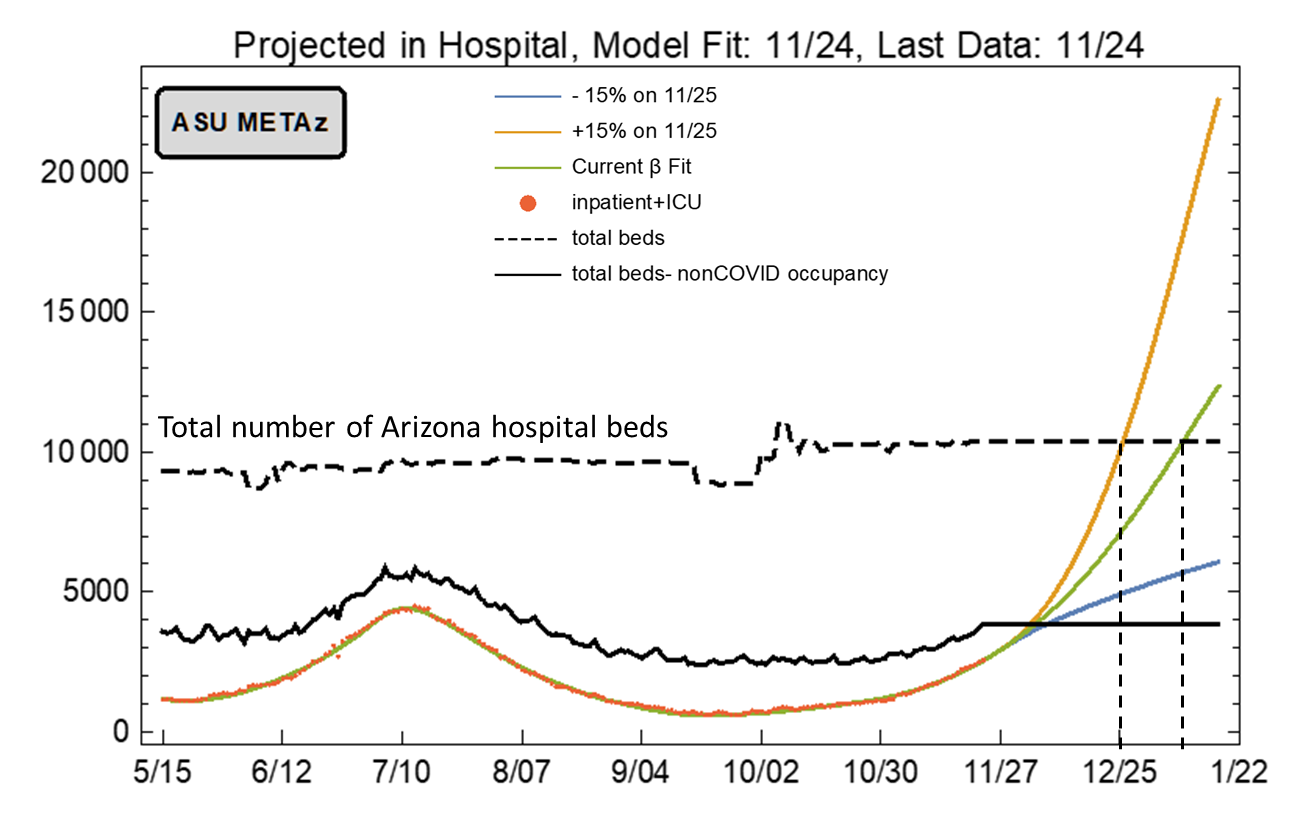
There was no update this week to the ASU Covid-19 model of projected cases, hospitalizations, and deaths through mid-January (full report). The current data continue to track as expected (Figure 10). The main findings are summarized in Figure 10. Assuming current viral transmission rates continue unabated, total Covid-19 hospitalizations in Arizona could exceed the total number of hospital beds by Christmas; however, it is looking more likely to be early January before this could happen (green line). This change does not reflect increases that might occur because of Thanksgiving travel and gatherings.
**A special thank you to the members of the ASU Covid-19 Modeling Group for their efforts to bring greater understanding of the current outbreak and for sharing their report. Readers are encouraged to read the full report which can be found here.
|
Figure 10. ASU Covid-19 Modeling Group Estimate of Total Covid-19 Hospitalization in Arizona through January 21st. Produced by Esma Gel, PhD, Megan Jehn, PhD, Anna Muldoon MPH, Health Ross, PhD, DNP, ANP-BC, and Tim Lant, PhD, MAS (November 24 Update). |
Summary
- Viral transmission is increasing throughout Arizona. If not slowed within the next 1 – 2 weeks, new Covid-19 cases will overwhelm our capacity to provide hospital care by the end of December.
- New cases are being diagnosed at a rate of at least 390 cases per 100,000 residents per week. This rate is increasing by approximately 27 cases per 100,000 residents per week.
- Transmission rates could be faster than measured owing to limited access to and/or lower uptake of Covid-19 testing during the Thanksgiving week.
- Holiday travel, commerce, and social gatherings between Thanksgiving and New Years are likely to accelerate transmission rates without additional public health interventions.
- A state-wide shelter-in-place order is warranted to slow transmission and to prevent overwhelming our hospital system. A state-wide mask mandate is also needed. Individuals and business who do not comply with restrictions should face sanctions.
- If such action is taken, it must be accompanied by additional state funds to alleviate food insecurity, to prevent evictions and foreclosures, and to protect access to health services as the loss of economic support from the CARES Act is a likely contributor to increased transmission.
- Acknowledging that a shelter-in-place order is unlikely, counties should be granted additional authority to establish and enforce alternative Covid-19 mitigation policies.
- The only unacceptable course is inaction. Without intervention, we are on track to experience a major humanitarian crisis during the Christmas – New Year holiday season.
- All Arizona residents should wear a mask in public, avoid social gatherings, maintain physical distance from non-household contacts, avoid >15 minutes contact in indoor spaces, especially if physical distancing is inadequate and adherence to face masks is low.
- Hospital Covid-19 occupancy is increasing and is on course to exceed previous peaks by mid-December. It could overwhelm hospital capacity by late-December.
- The fall-winter viral respiratory season plus the return of part-time residents who winter in Arizona will continue to strain hospitals capacity through January - February.
- Hospitals are already postponing scheduled procedures and requiring health professionals to work additional hours and assume new duties. Shortages and burn-out will degrade our capacity to provide critical care services.
- The test positive rate for traditional PCR testing reached 22% this week. The growing mismatch between testing capacity and demand indicates viral transmission is growing faster than the estimate here.
- Covid-19 mortality continues to increase. While rates remain lower than those observed with this summer’s outbreak, cases are rising quickly. It is likely that Arizona will record >500 Covid-19 deaths per week by Christmas.
- Avoiding cases among those ≥65 years of age, particularly those residing in long-term care facilities, is critical to keeping mortality low.
Forecast reports to date, available as PDFs
Download PDF to view additional charts of Arizona counties, available in appendix of report.
December 4
Based on what we know now about this pandemic, we support guidelines for social distancing to slow the spread of the virus and urge everyone to follow the recommendations provided by the Centers for Disease Control and Prevention (CDC) to protect yourself, your family, your neighbors, and your employees. Please heed the recommendations as provided by the CDC, found at the following website: https://www.cdc.gov/coronavirus/2019-ncov/prepare/prevention.html
COVID covid coronavirus virus covid19 corona forecast model