
Weekly Arizona COVID-19 Data Report – December 3
Note this forecast page is not the most recent forecast available.
View the most current forecast report
Researcher Analyzes Arizona COVID-19 Spread Models for Decision-Makers
The following information regarding the spread of COVID-19 in Arizona was prepared by Joe Gerald, MD, PhD, a researcher at the Mel and Enid Zuckerman College of Public Health (MEZCOPH) at the University of Arizona. This information has also been reviewed by other MEZCOPH faculty.
This data were obtained from the Arizona Department of Health Services COVID-19 webpage and reflect conditions in Arizona as of December 3, 2021.
This information is intended to help guide our response to the outbreak. It is not intended to predict how this pandemic will evolve. Rather, this model extrapolates what might occur if current conditions remain unchanged. As regional authorities and healthcare providers respond, their actions are expected to mitigate the worst consequences of this pandemic.

COVID-19 Disease Outbreak Forecast
Arizona State and Pima County
Updated December 3, 2021
Disclaimer: This information represents my personal views and not those of The University of Arizona, the Zuckerman College of Public Health, or any other government entity. Any opinions, forecasts, or recommendations should be considered in conjunction with other corroborating and conflicting data. Updates can be accessed at https://publichealth.arizona.edu/news/2021/covid-19-forecast-model.
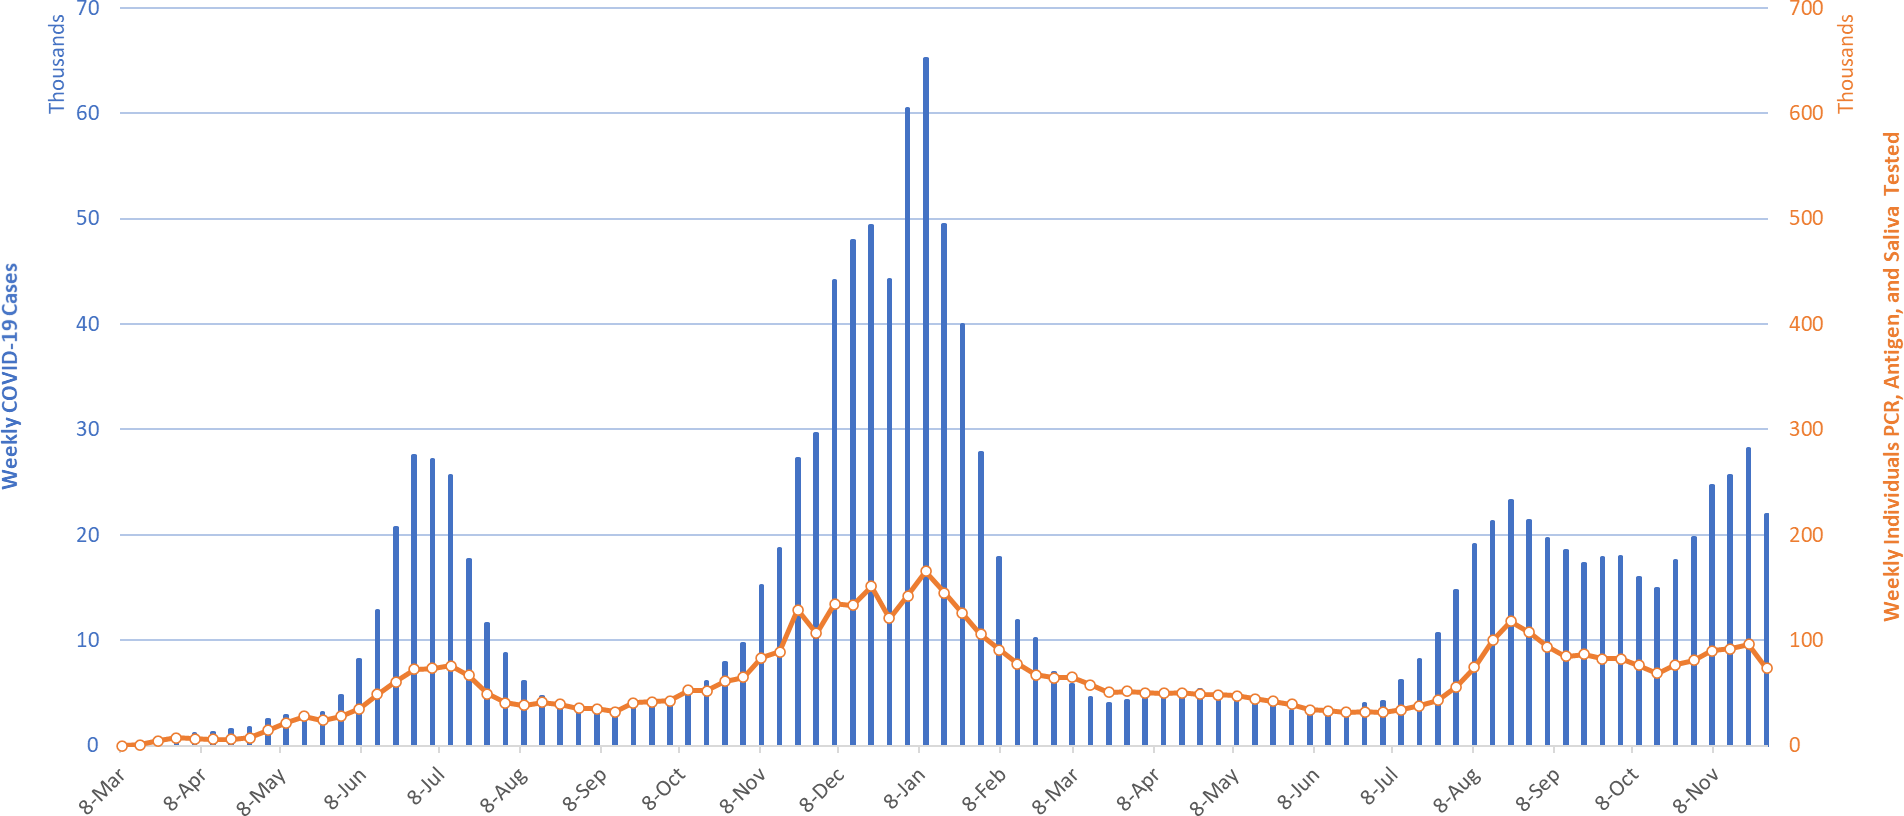
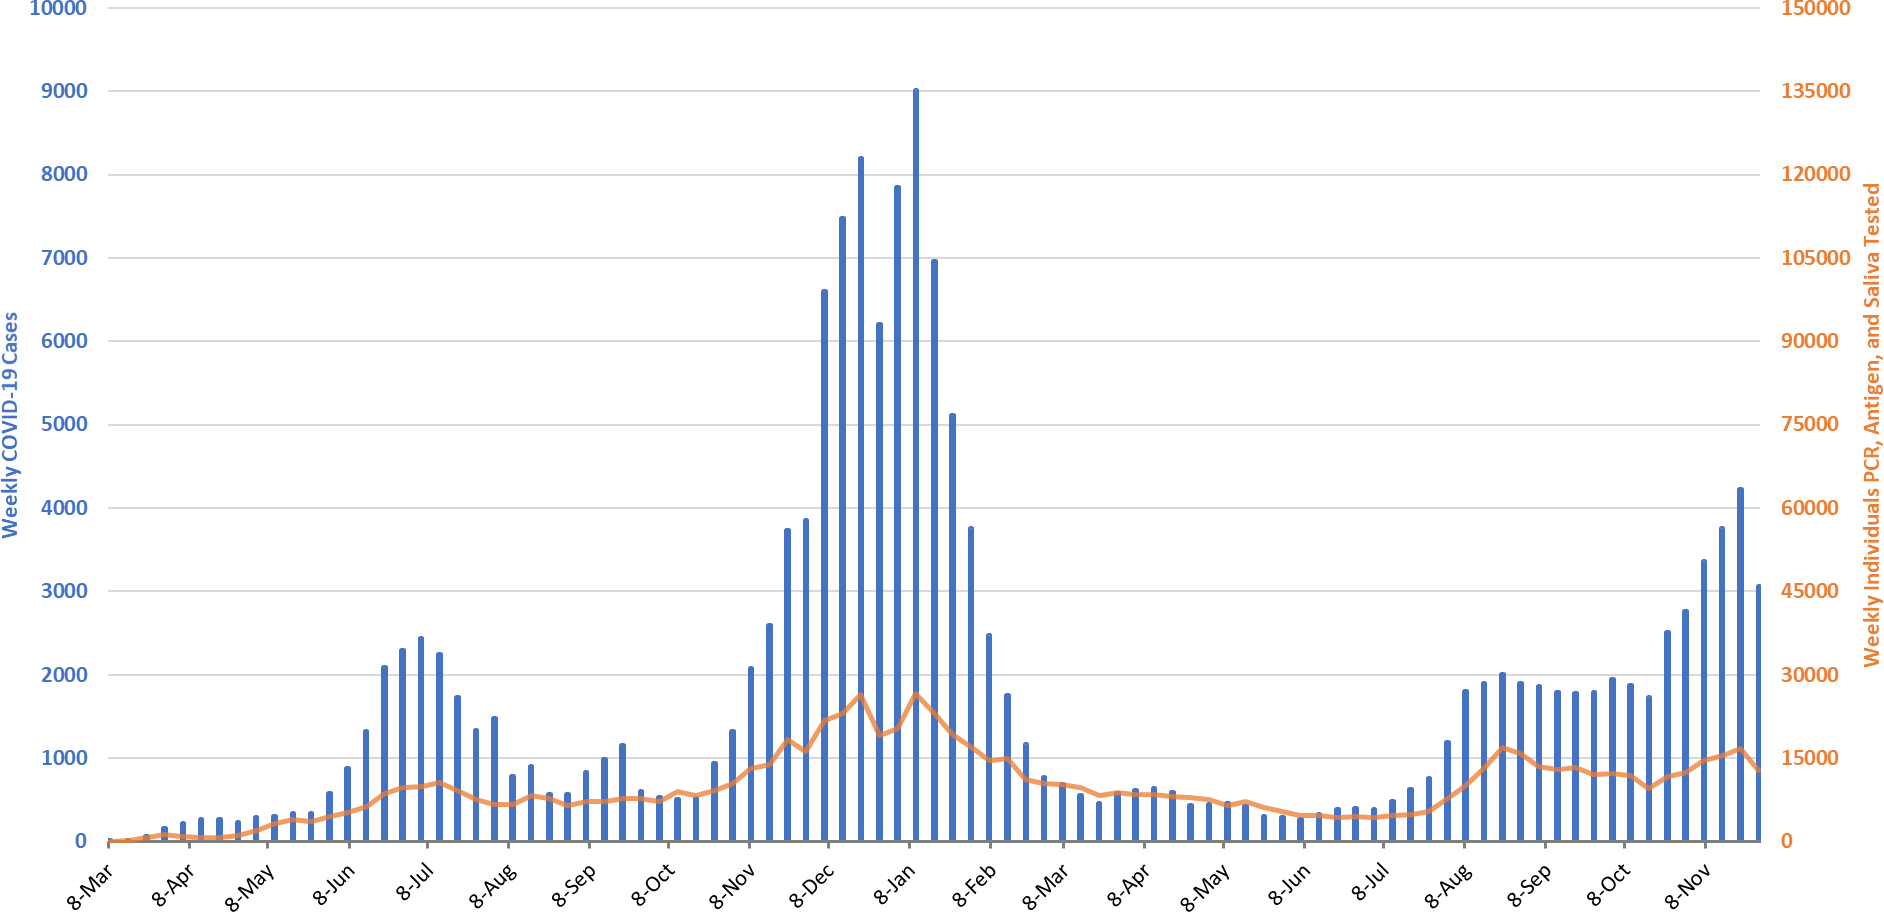
For the week ending November 28th, 21963 Arizonans were diagnosed with COVID-19, a spurious decline from last week’s initial tally of 27846 cases (Figure 1). Like last Thanksgiving, testing was significantly disrupted during Thanksgiving with 25000 fewer individuals being testing than the week before. Therefore, case counts and resulting rates meaningfully underestimate transmission (Figure 2a below). As typical testing patterns resume, case rates should return to prior levels and then some as underlying transmission is almost certainly increasing. Arizona’s new case ranking has fallen from 9th to 22nd. The nation’s current leaders are New Hampshire (540), Minnesota (535), Michigan (518), Vermont (484), and North Dakota (441).
|
Figure 1. Weekly COVID-19 Cases in Arizona and Number of Individuals Undergoing COVID-19 Diagnostic Testing March 1, 2020 – November 28, 2021. |
STILL TRUE → Arizona continues to experience a high number of cases, hospitalizations, and deaths. With waning vaccine efficacy and a potentially short duration of acquired immunity, herd immunity is not achievable. As winter approaches, more individuals will become susceptible. While the previously vaccinated and previously infected will remain mostly protected from severe outcomes, they will contribute to community transmission. Unvaccinated Arizonans will not be able to avoid infection by “free riding” on high levels of community immunity. The decision to remain unvaccinated carries a much greater risk than getting vaccinated. For the vaccinated, third-shot boosters provide considerable additional protection and should be a priority for anyone >50 years to ward off existing Delta infection and provide a hedge against the new Omicron variant.
According to the CDC, only 22% of Arizona adults and 42% of seniors are fully vaccinated with a third dose booster, 37th and 41st national ranking, respectively. Vermont is winning the booster race at 39% and 65%, respectively. As winter approaches, waning immunity among those without a booster will place them at risk. The CDC guidance on boosters has widened eligibility to all adults. The ADHS Vaccine Dashboard shows weekly doses delivered fell a bit from 180K to 140 doses.
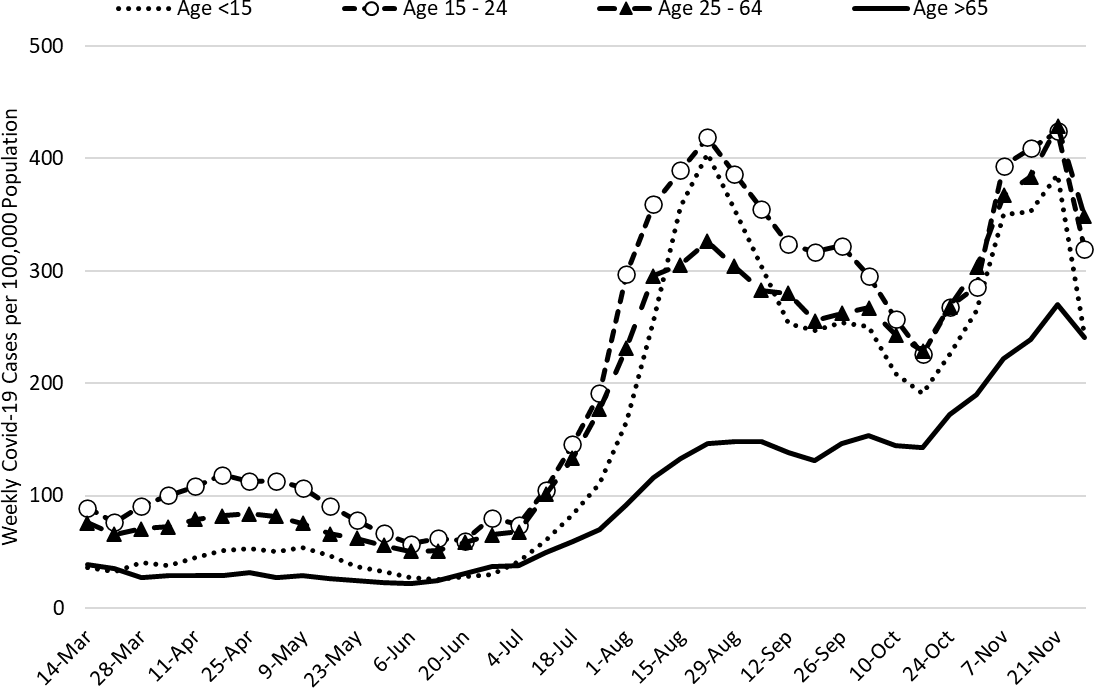
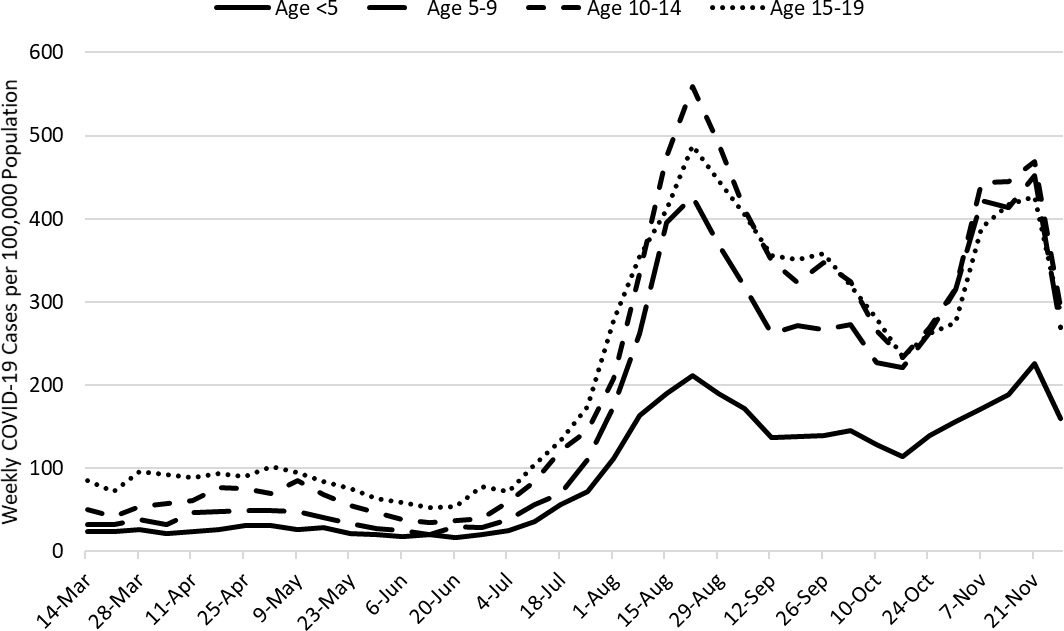
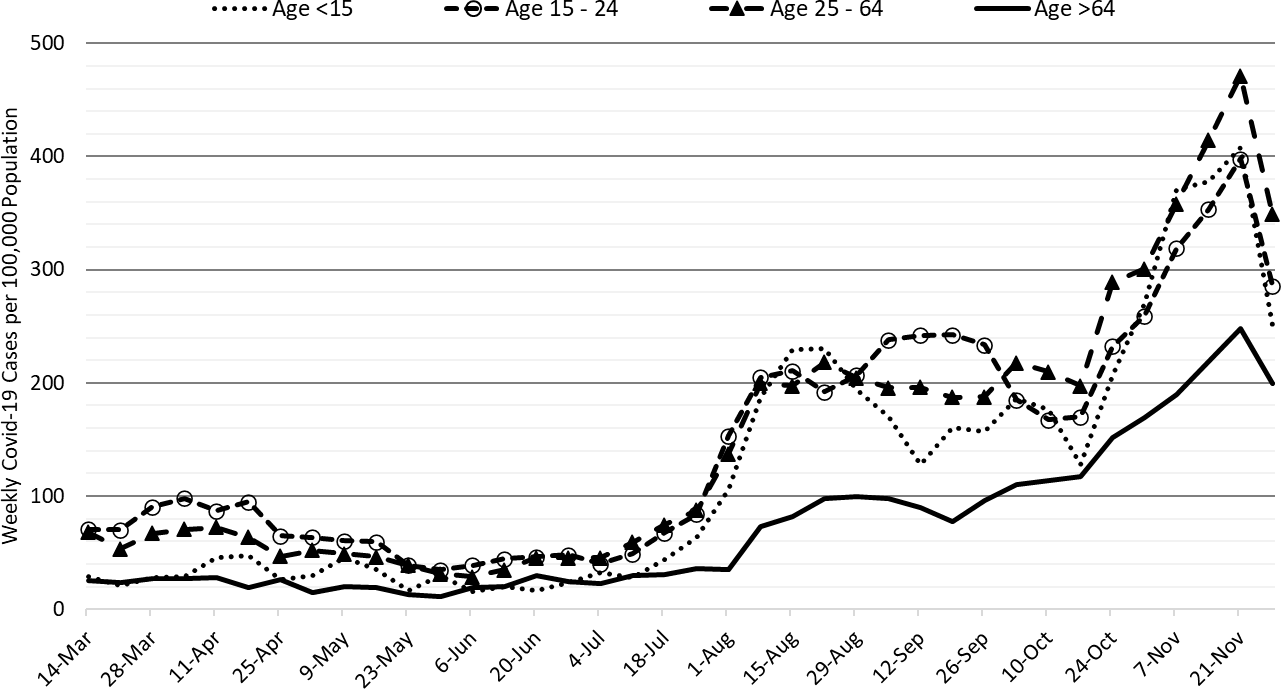
Figure 2a shows marked declines among children and working-age adults, almost certainly due to less testing. A similar decline is evident among children (Figure 2b). As mentioned last week, testing disruptions will make viral transmission seem to increase in fits and spurts as Thanksgiving and Christmas holidays bring major changes to work and social life. For the next several weeks, hospital COVID-19 occupancy will give a more consistent, although lagged, indicator of what is happening with viral transmission in the community.
|
Figure 2a. COVID-19 Cases in Arizona by Age Group March 7 – November 28, 2021. |
|
Figure 2b. COVID-19 Cases in Arizona among Children by Age Group March 7 – November 28, 2021. |
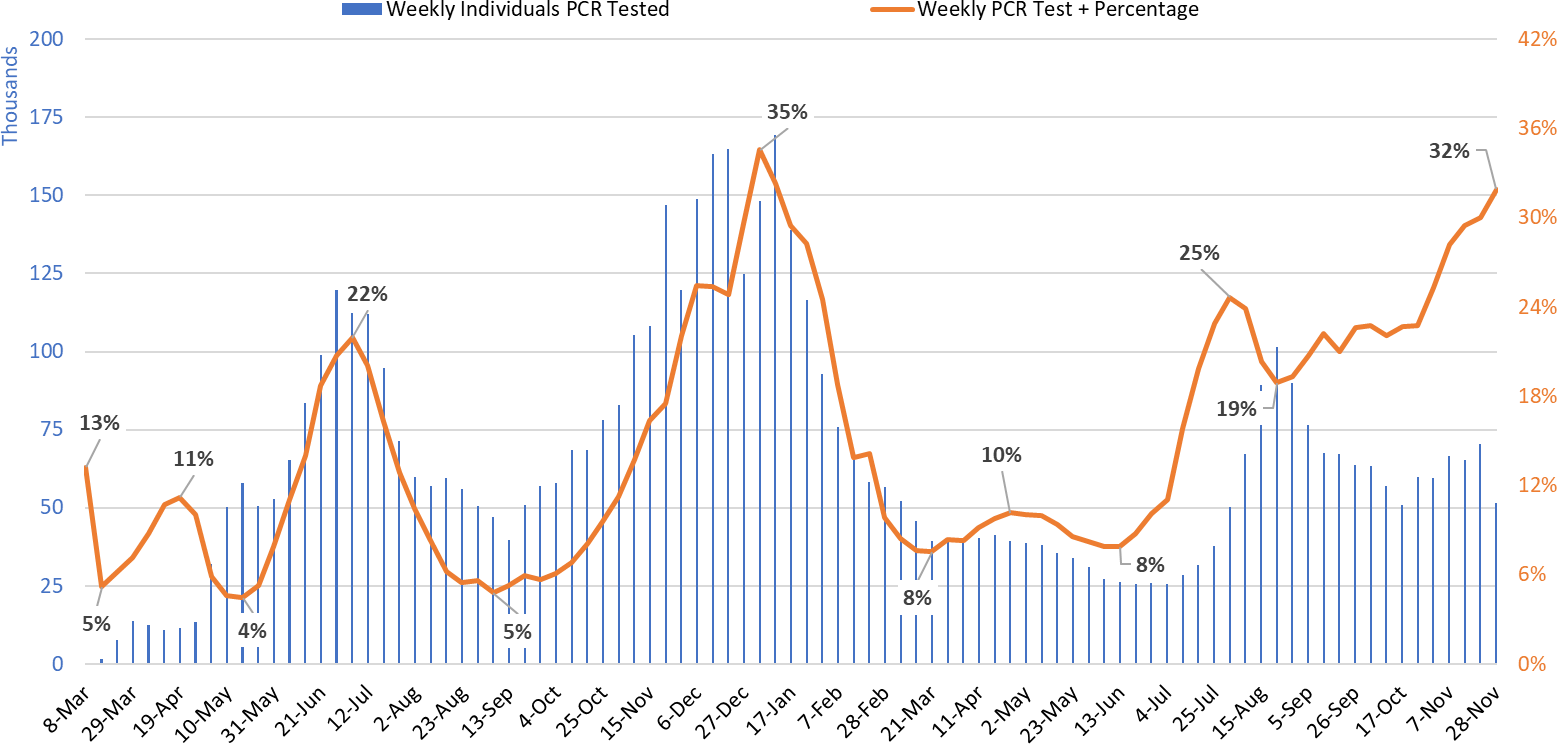
Test positivity, at 32%, continues to rise with markedly fewer tests being conducted last week. Testing remains inadequate for public health practice and many cases are going undiagnosed (Figure 3).
|
Figure 3. Weekly Number of Patients Undergoing Traditional Nasopharyngeal PCR Testing and Associated Percent Positivity March 1, 2020 – November 28, 2021. |
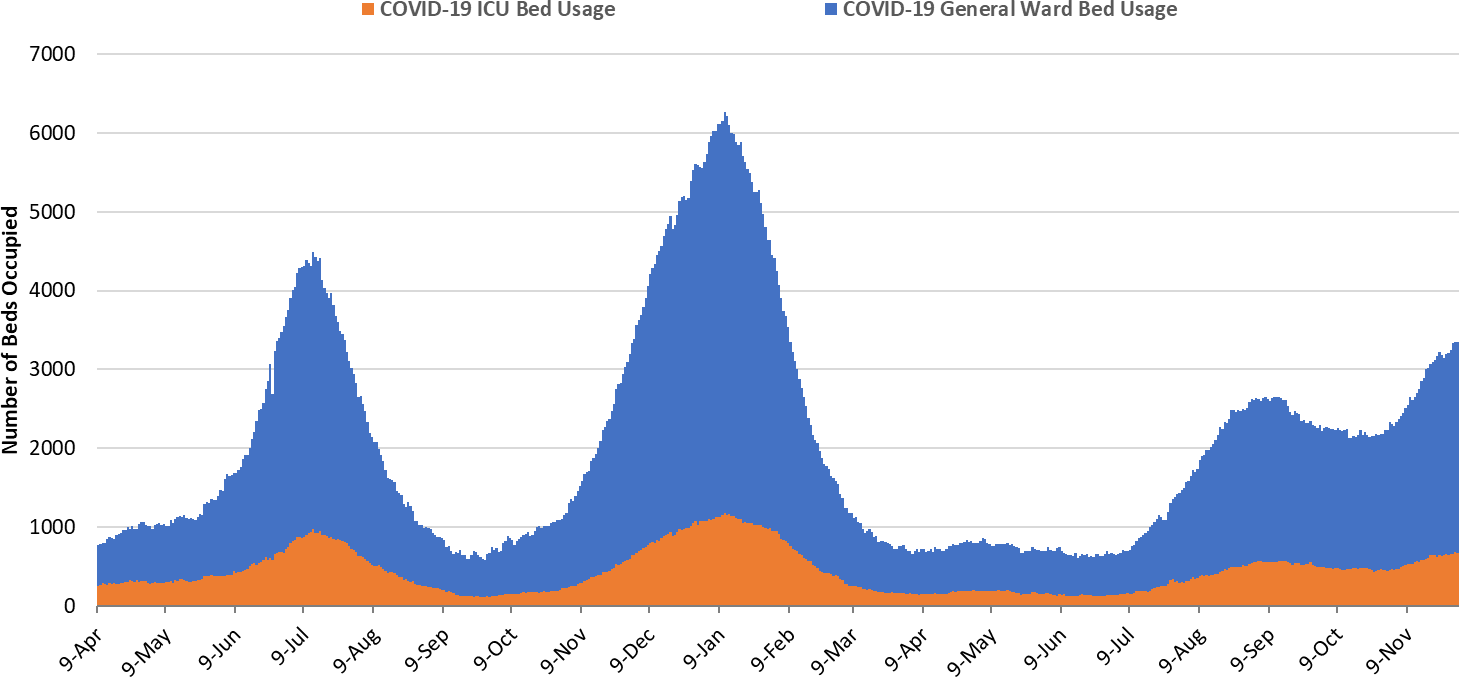
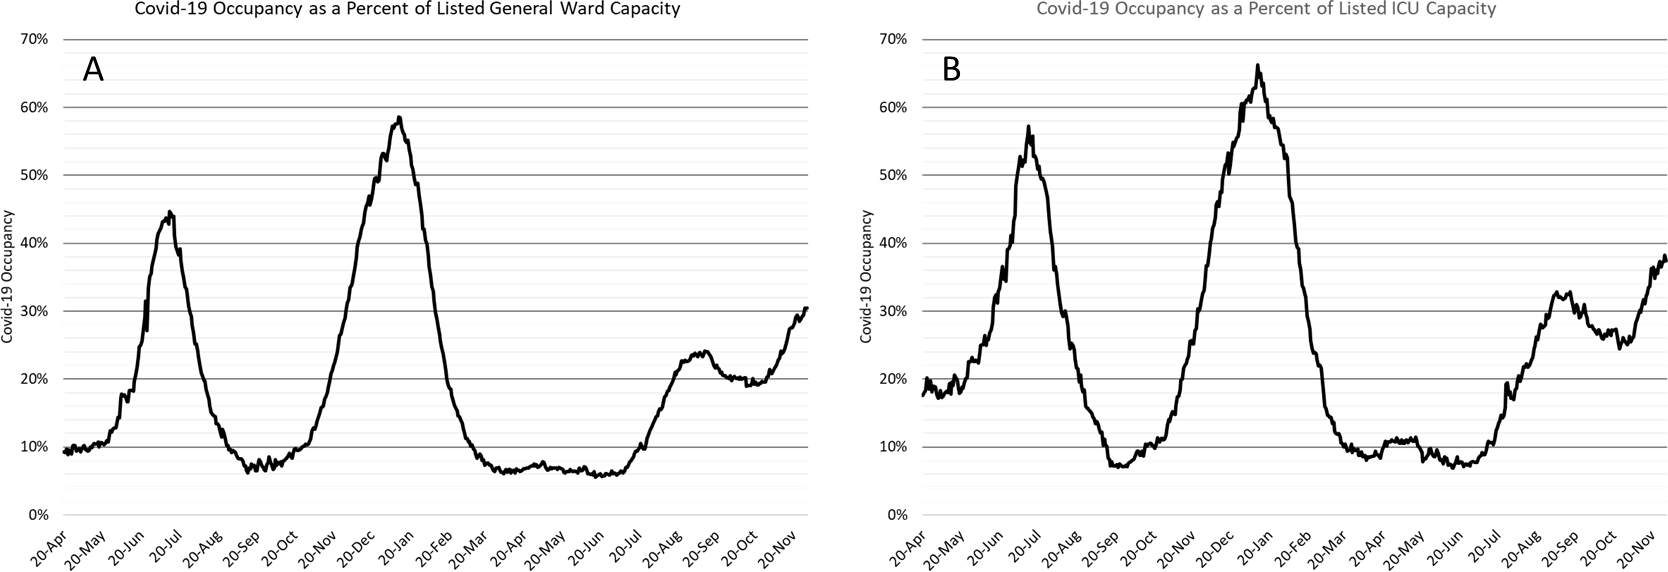
As of December 1st, 2681 (31%) of Arizona’s 8789 general ward beds were occupied by COVID-19 patients, a 5% increase from last week’s 2550 occupied beds (Figure 4 and Figure 5 Panel A). Another 464 (5%) beds remained available for use which sets a new all-time low. Six-hundred sixty-eight (668, 37%) of Arizona’s 1784 ICU beds were occupied by COVID-19 patients, a 6% increase from last week’s 633 occupied beds (Figure 4 and Figure 5 Panel B). An additional 116 (7%) ICU beds remained available for use, lower than last week’s 126 beds. Hospital occupancy lags case counts by 5 -10 days; so, we are essentially driving I-10 through a haboob.
|
Figure 4. Arizona Daily COVID-19 General Ward and ICU Census April 9, 2020 – December 1, 2021. |
While peak occupancy is unlikely to reach prior levels, the base of the Delta wave is broader. The Delta wave has seen 111 days with a combined occupancy >2000 patients whereas the summer 2020 and winter 2021 waves saw 57 and 98 days, respectively. We have now had >3000 combined occupancy for 14 days whereas the summer 2020 and winter 2021 waves saw 35 and 78 days, respectively.
|
Figure 5. COVID-19 Occupancy as a Percent of Listed General Ward (A, left) and ICU (B, right) Capacity in Arizona April 20, 2020 – December 1, 2021. |
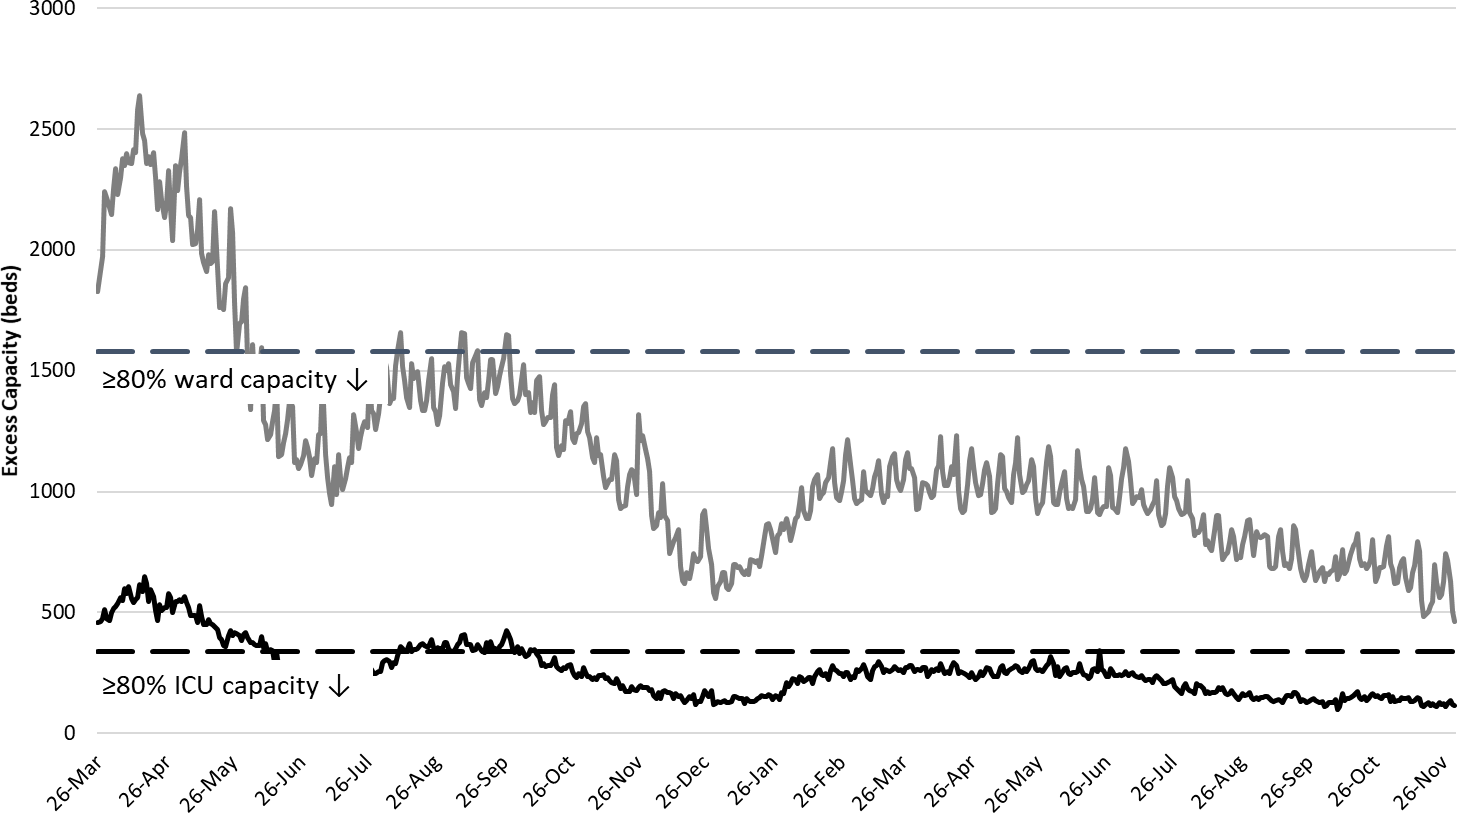
Hospital occupancy remains far above seasonal levels. Safety margins, as measured by available beds, remain near historical lows (Figure 6). In fact, the number of available ward beds fell below 500 beds for the second time this week and ICU beds will at least briefly fall below 100 in next week’s report. Hospitals should prepare for >25% ward occupancy and >30% ICU occupancy for some time to come.
|
Figure 6. Observed Excess Non-Surge General Ward and ICU Capacity in Arizona March 26, 2020 – Dec 1, 2021. |
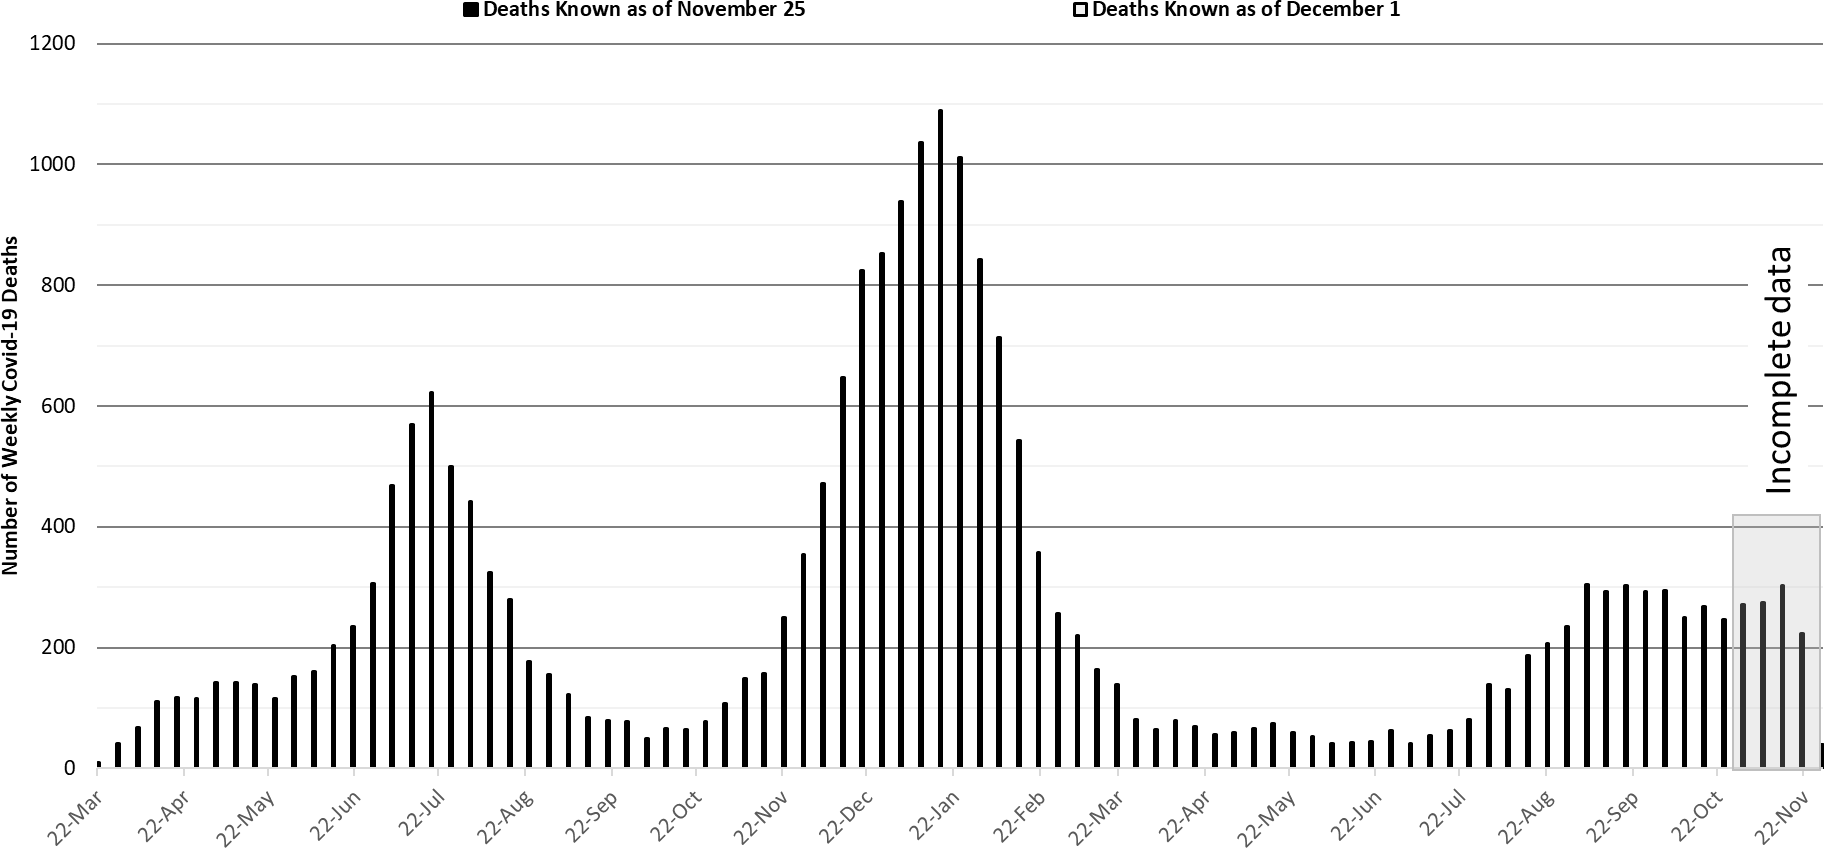
Arizona has been experiencing >200 COVID-19 deaths per week since August 22nd; and, beginning the week ending November 14th are once again >300 deaths a week (Figure 7). So far, 22561 Arizonans have lost their lives to COVID-19 making it Arizona’s leading cause of death, the only state to achieve such a distinction. A new analysis from Texas, shows COVID-19 as the 2nd leading cause of death among adults 24 – 44 years of age overall but with substantial disparities; it was the leading cause of death among Hispanics but only 6th among whites.
|
Figure 7. Weekly Arizona COVID-19 Deaths March 16, 2020 – November 28, 2021. |
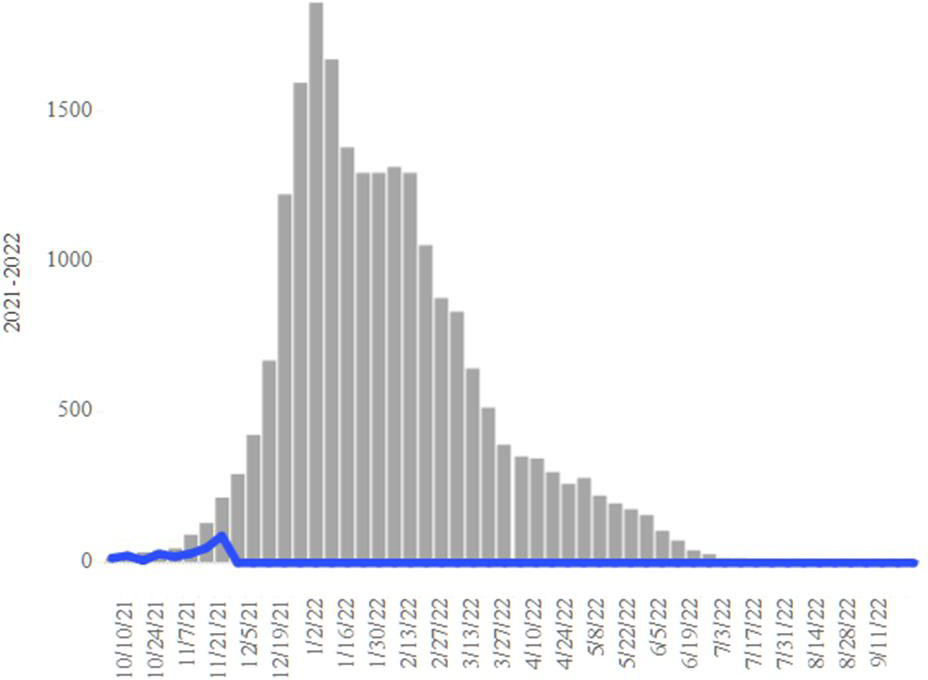
Seasonal influenza cases in Arizona (blue line) remain below the 5-year historical average (grey bars) suggesting that the feared ‘twindemic’ has yet to materialize (Figure 8). Fingers crossed that it stays that way as it one factor keeping hospitals from imploding.
|
Figure 8. Arizona Influenza Cases in 2021 (blue) versus 5-Year Historical Average (grey) |
Pima County Outlook
For the week ending November 28th, 3059 Pima County residents were diagnosed with COVID-19, also a spuriously low number due to reduced testing (Figure 9).
|
Figure 9. Weekly COVID-19 Cases in Pima County and Number of Individuals Undergoing COVID-19 Diagnostic Testing March 1, 2020 – November 28, 2021. |
Trends across the various age groups appear in Figure 10.
|
Figure 10. COVID-19 Cases in Pima County by Age Group March 7, 2020 – November 28, 2021. |
Summary
- Arizona continues to experience high levels of community transmission. Test positivity also remains high reminding us that test capacity, accessibility, and/or uptake is inadequate. Increasing case rates among older, highly vaccinated groups serves as a warning that major behavioral shifts and/or waning immunity could result in future increases in not only cases but also hospitalizations. In general, transmission will likely increase in fits-and-starts through the holidays before gradually subsiding in early 2022. While Arizona is unlikely to set new records for daily cases, the base of the delta wave will be considerably broader than any other creating substantial misery in its own way.
- As of November 28th, new cases were being diagnosed at a rate of at least 302 cases per 100K residents per week. This rate was likely much higher than reported due to reduced testing during Thanksgiving.
- Vaccination remains the most important public health priority to reduce transmission and severe illness; however, mask mandates, restrictions on indoor gatherings, and targeted business mitigations are also needed to reduce/control transmission in the short-run with the primary goal being to avoid overwhelming our critical care facilities.
- Waning vaccine immunity also makes it imperative that all adults who were previously vaccinated obtain a third shot booster, particularly those 50+ years of age. Persistently high levels of community transmission, and more importantly hospitalizations, are possible for an extended time until the supply of unvaccinated, previously uninfected adults is exhausted.
- Third shot boosters provided considerable protection against breakthrough infection https://jamanetwork.com/journals/jamainternalmedicine/fullarticle/2786890
- Risk factors for breakthrough hospitalization and death were recently elucidated in the British Medical Journal: Down’s syndrome, kidney transplantation, sickle cell disease, nursing home residents, chemotherapy, recent bone marrow or solid organ transplantation (ever), HIV/AIDS, dementia, Parkinson’s disease, neurological conditions, and liver cirrhosis. https://www.bmj.com/content/374/bmj.n2244
- Waning vaccine immunity also makes it imperative that all adults who were previously vaccinated obtain a third shot booster, particularly those 50+ years of age. Persistently high levels of community transmission, and more importantly hospitalizations, are possible for an extended time until the supply of unvaccinated, previously uninfected adults is exhausted.
- The World Health Organization has named another COVID-19 variant of concern (VOC), the Omicron variant. https://www.who.int/news/item/26-11-2021-classification-of-omicron-(b.1.1.529)-sars-cov-2-variant-of-concern
- A VOC is a variant that “through a comparative assessment, has been demonstrated to be associated with ≥1 of the following changes at a degree of global public health significance:
- Increase in transmissibility or detrimental change in COVID-19 epidemiology; OR
- Increase in virulence or change in clinical disease presentation; OR
- Decrease in effectiveness of public health and social measures or available diagnostics, vaccines, therapeutics.”
- The European CDC published a good current assessment (Dec 2): https://www.ecdc.europa.eu/en/publications-data/covid-19-threat-assessment-spread-omicron-first-update
- Here is a briefing from ground zero in South Africa (Dec 2; epidemiological data starts 18.45): https://www.youtube.com/watch?v=qMzMFmprYdg
- Omicron doesn’t fundamentally change what is needed in Arizona NOW: get vaccinated, get boosted, wear an upgraded K-95 or KN-95 mask, avoid risky indoor situations. Instead of worrying about what might happen (Omicron), we need to do more to stop what IS happening (Delta) right now in our own backyard.
- For those wanting to track variant data, here are links to genomic state data (https://pathogen.tgen.org/covidseq-tracker/) and national data (https://covid.cdc.gov/covid-data-tracker/#variant-proportions). Other surveillance methods include S-gene Target Failure (SGTF) from PCR testing and wastewater surveillance. Unfortunately, I do not have any links to publicly available data for these latter two mechanisms.
- A VOC is a variant that “through a comparative assessment, has been demonstrated to be associated with ≥1 of the following changes at a degree of global public health significance:
- COVID-19 hospital occupancy is increasing and will likely exceed 25% of all beds in the general ward and 30% of beds in the ICU for the remainder of the year. Access to care will continue to be restricted in the face of staff shortages in inpatient and outpatient settings.
- The importance of vaccination to prevent overwhelming critical care resources was highlighted by the ICNARC report on COVID-19 in Critical Care: England, Wales and Northern Ireland (26- Nov). https://www.icnarc.org/our-audit/audits/cmp/reports
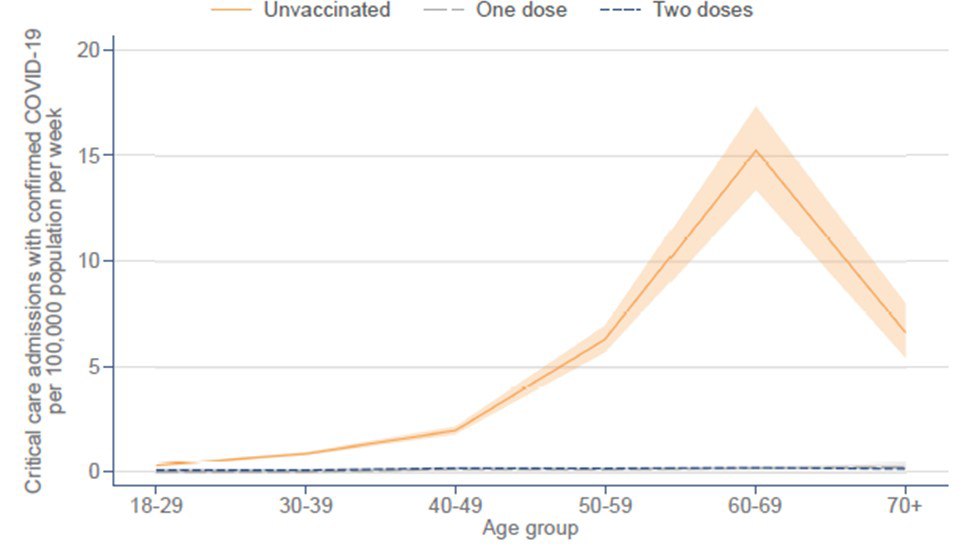
Rate of admission to critical care with confirmed COVID-19 by vaccination status for patients admitted 1 May 2021 to 31 July 2021
- Unfortunately, Merck’s new COVID-19 anti-viral, Molnupiravir (Lagevrio), has less efficacy than originally touted, from 50% reduction of hospitalization to 30%. The FDA advisory panel narrowly approved it for sale, 13 to 10. While helpful, it is not going to be the game changer we had hoped. It will not be approved for pregnant or lactating women or children. https://www.bmj.com/content/375/bmj.n2984
- The importance of vaccination to prevent overwhelming critical care resources was highlighted by the ICNARC report on COVID-19 in Critical Care: England, Wales and Northern Ireland (26- Nov). https://www.icnarc.org/our-audit/audits/cmp/reports
- Weekly COVID-19 deaths have now reached 300 per week and should remain at or above this level as long as cases exceed 20000 per week.
- So far, 22561 Arizonans have lost their lives to COVID-19.
Forecast reports to date, available as PDFs
Download PDF to view additional charts of Arizona counties, available in appendix of report.
December 3 |
2020 Reports
Based on what we know now about this pandemic, we support guidelines for social distancing to slow the spread of the virus and urge everyone to follow the recommendations provided by the Centers for Disease Control and Prevention (CDC) to protect yourself, your family, your neighbors, and your employees. Please heed the recommendations as provided by the CDC.
COVID covid coronavirus virus covid19 corona forecast model