
COVID-19 Forecast Models Report for Arizona, January 22 Update
Note this forecast page is not the most recent forecast available.
View the most current forecast report
Researcher Analyzes Arizona COVID-19 Spread Models for Decision-Makers
The following information regarding the spread of COVID-19 in Arizona was prepared by Joe Gerald, MD, PhD, a researcher at the Mel and Enid Zuckerman College of Public Health (MEZCOPH) at the University of Arizona. This information has also been reviewed by other MEZCOPH faculty.
This data were obtained from the Arizona Department of Health Services COVID-19 webpage and reflect conditions in Arizona as of January 22, 2021.
This information is intended to help guide our response to the outbreak. It is not intended to predict how this pandemic will evolve. Rather, this model extrapolates what might occur if current conditions remain unchanged. As regional authorities and healthcare providers respond, their actions are expected to mitigate the worst consequences of this pandemic.

COVID-19 Disease Outbreak Forecast
Arizona State and Pima County
Updated January 22, 2021
Disclaimer: This information represents my personal views and not those of The University of Arizona, the Zuckerman College of Public Health, or any other government entity. Any opinions, forecasts, or recommendations should be considered in conjunction with other corroborating and conflicting data. Updates can be accessed at https://publichealth.arizona.edu/news/2021/covid-19-forecast-model.
**NOTICE** Arizona remains in a public health crisis where access to critical care services is limited due to shortages of space, personnel, and critical supplies. These conditions will persist into February. Additional mitigation efforts are needed to slow the pace of viral transmission and ease the burden on hospitals and allow ongoing vaccination efforts to reach the most vulnerable.
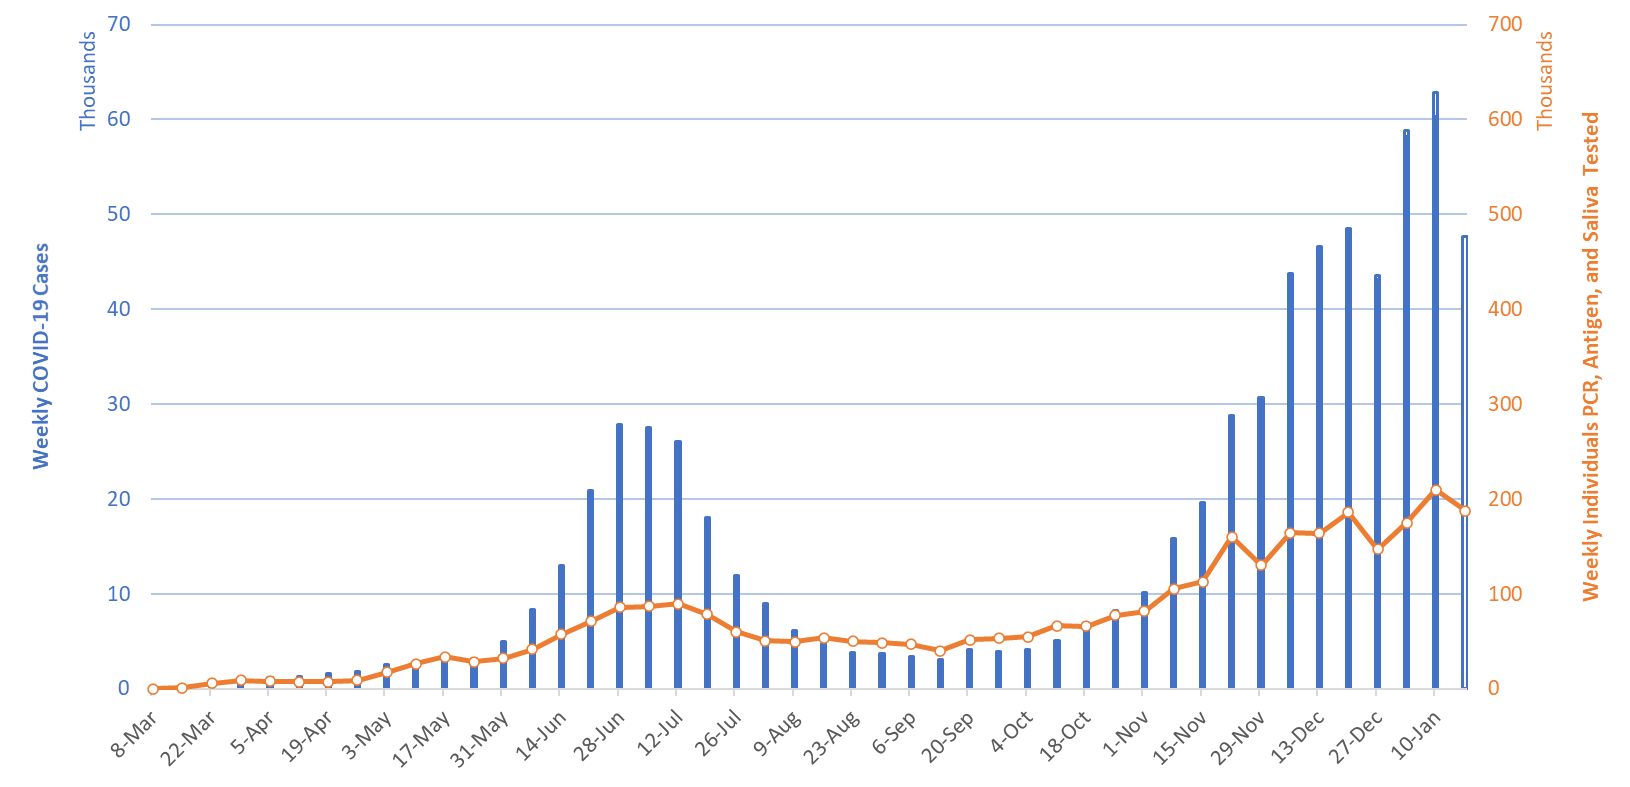
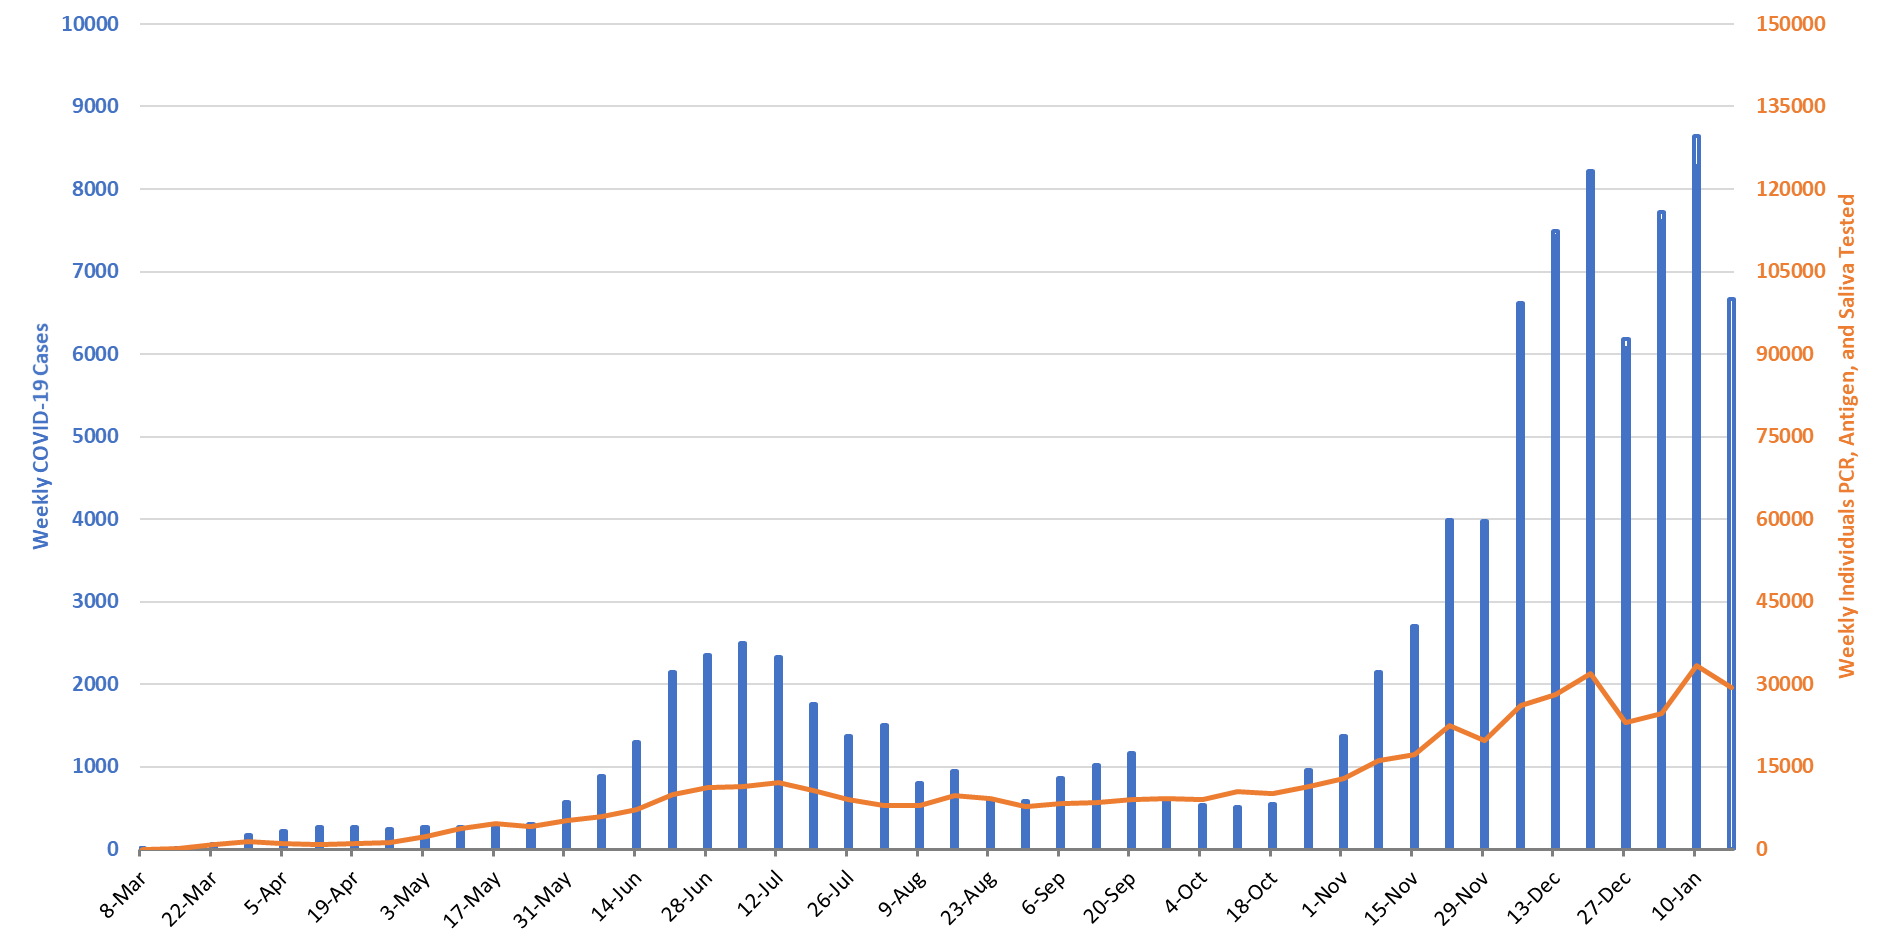
For the week ending January 17th, at least 47637 new Covid-19 cases were diagnosed in Arizona (Figure 1). This represents an unexpected 21% decrease from last week’s initial tally of 60283 cases. The prior week’s tally has since been upwardly revised by 4% (2509 cases) to 62792 cases, the highest count yet recorded.
|
Figure 1. Newly Diagnosed Covid-19 Cases in Arizona and Number of Individuals Undergoing Covid-19 Diagnostic Testing March 1 through January 17, 2021. |
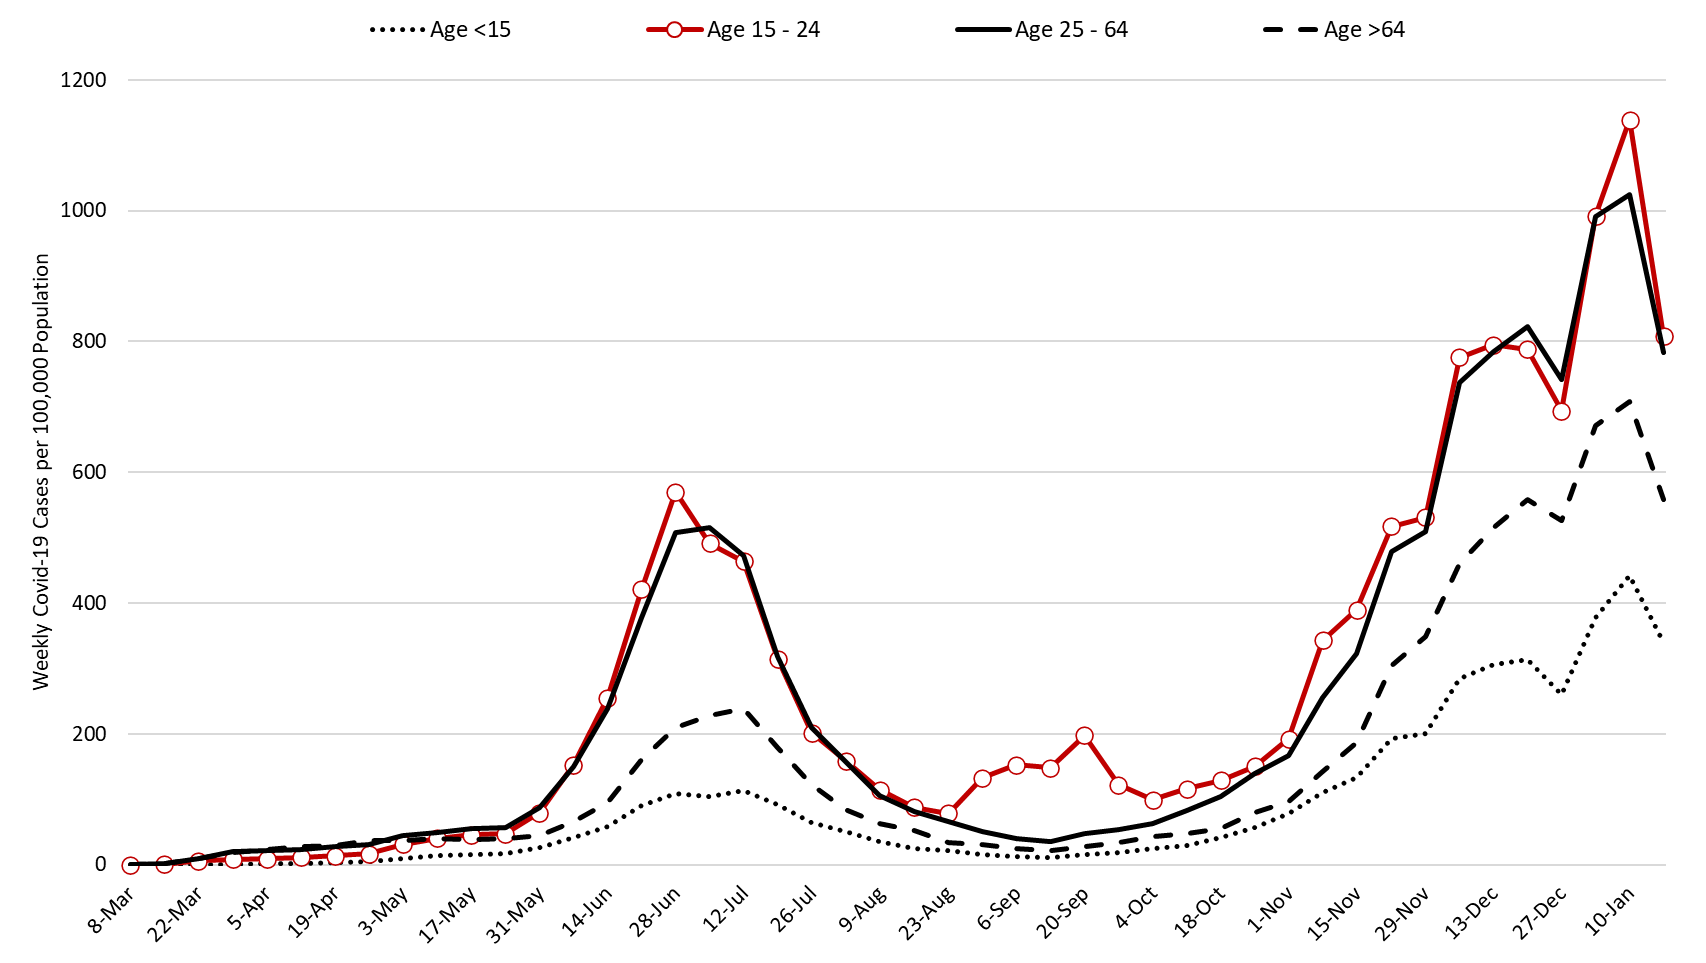
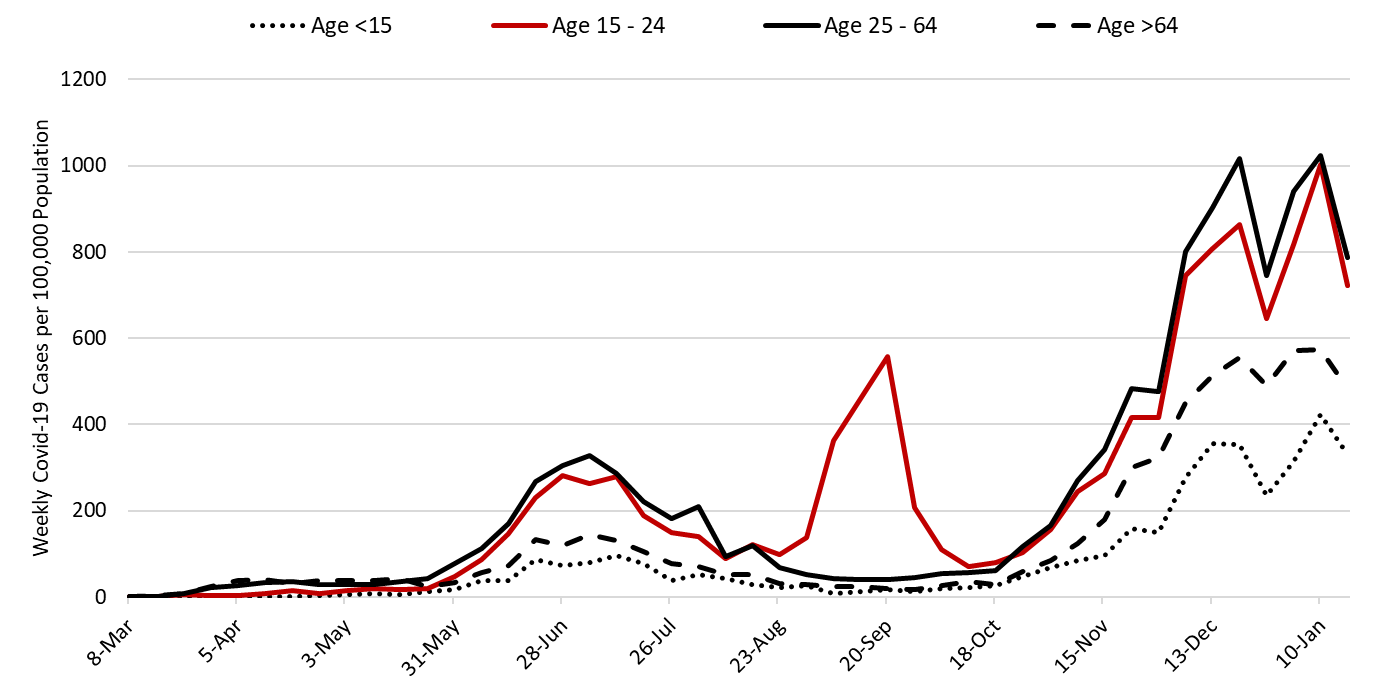
The number of Arizonans tested for Covid-19 declined from 209714 the week ending January 10th to 187573 the week ending January 17th. Test positivity continues to decline, dropping from a peak of 35% the week ending January 3rd to 30% the week ending January 17th. This lends additional evidence that viral transmission is slowing and that the decline in testing is due to slackening demand. Nevertheless, testing capacity remains woefully inadequate for the scale of the problem. The outbreak remains broadly entrenched and trends are similar across age groups (Figure 2).
Note: Data for this report was updated Friday, January 22 allowing 4 full days to adjudicate cases and keep week-over-week backfill 10%. This allows more interpretable comparisons and graphics. All comparisons are week-over-week changes. Future updates will be released on Saturdays.
|
Figure 2. Newly Diagnosed Covid-19 Cases in Arizona by Age Group March 1 through January 17, 2021. |
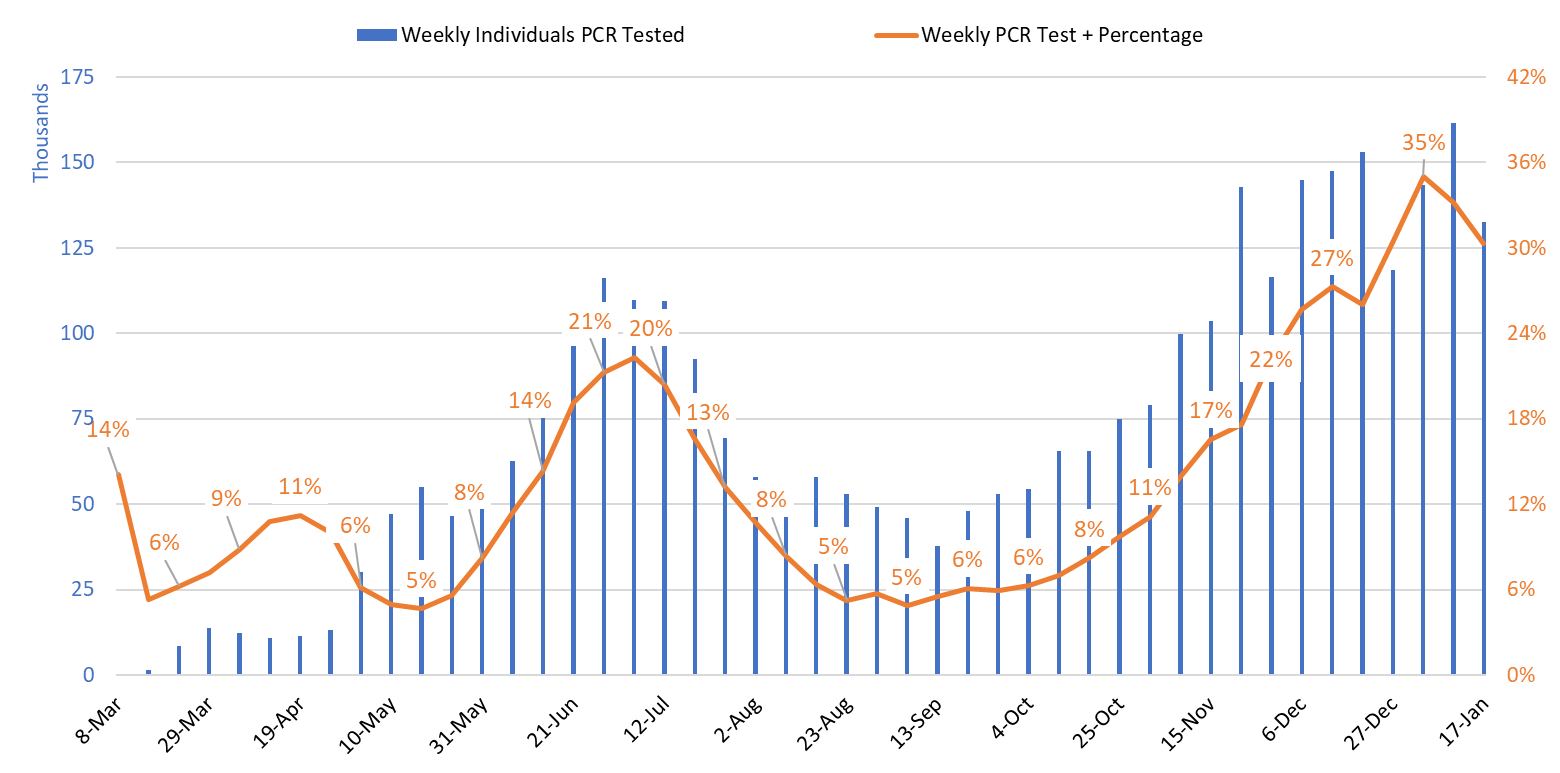
Test positivity among those undergoing traditional nasopharyngeal PCR testing decreased from 33% the week ending January 10th to 30% the week ending January 17th (Figure 3). The continued decline in positivity indicates that viral transmission is in fact slowing. Nevertheless, 30% test positivity reflects woefully inadequate testing capacity as positivity should be less than 5 – 10%.
|
Figure 3. Weekly Number Patients Undergoing Traditional Nasopharyngeal PCR Testing and Associated Percent Positivity March 1 – January 17, 2021. |
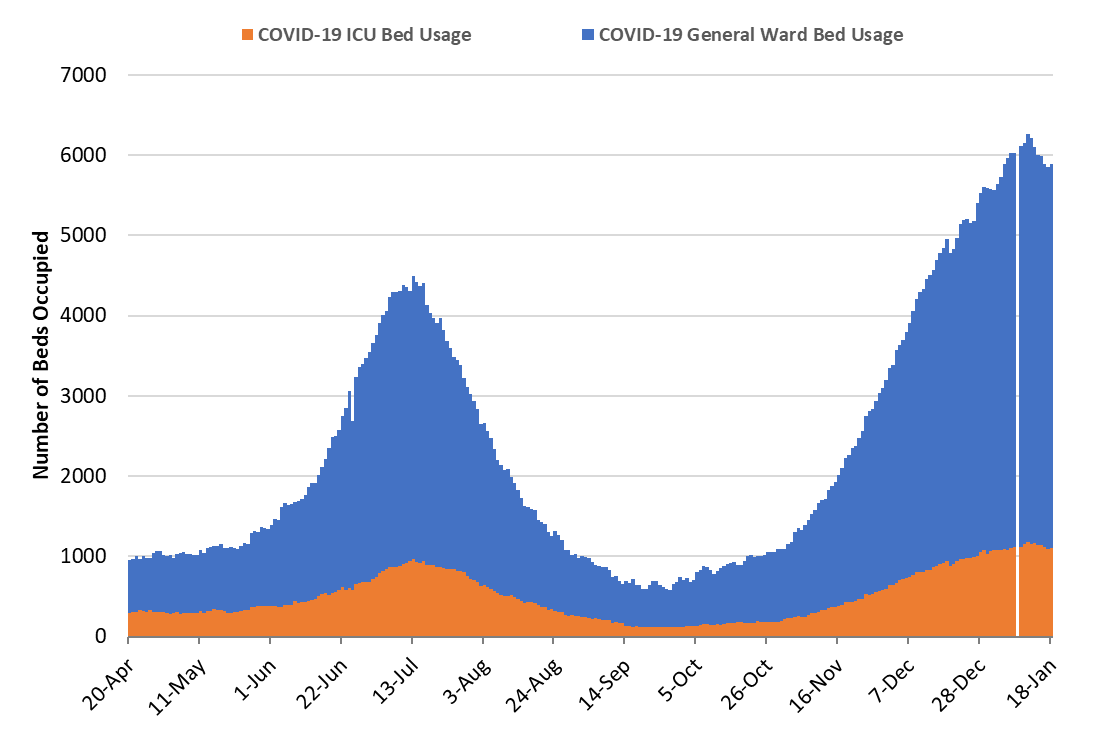
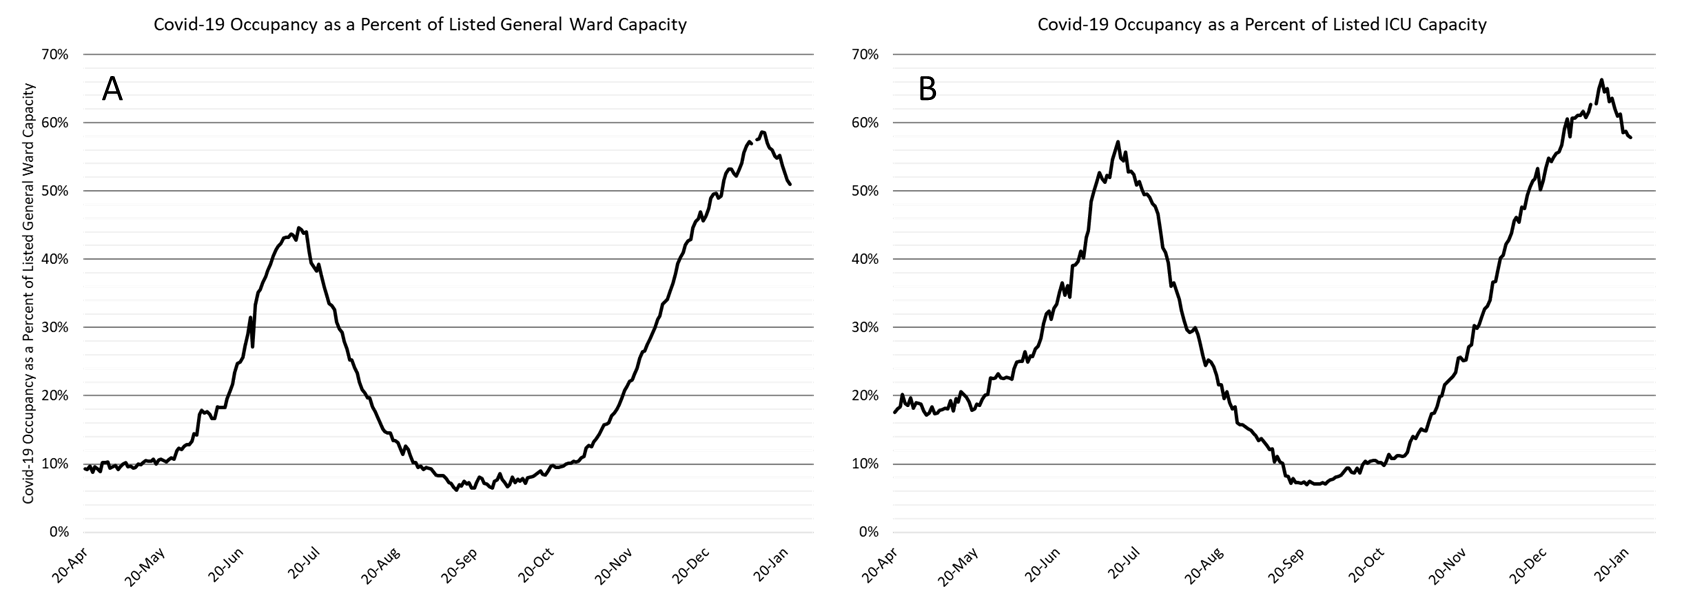
As of Jan 22nd, 4442 (51%) of Arizona’s 8723 general ward beds were occupied by Covid-19 patients, an 8% decrease from the previous week’s 4849 occupied beds (Figure 4 and Figure 5 Panel A). Another 815 (9%) beds remained available for use. The number of available beds is higher than the previous week’s 656 beds.
While still incredibly high, there are fewer Covid-19 patients in the hospital this week as compared to last. This is a welcomed change and provides further evidence that viral transmission has slowed.
|
Figure 4. Arizona Daily Covid-19 General Ward and ICU Census April 20 – January 22, 2021. |
As of January 22nd, 1049 (58%) of Arizona’s 1815 ICU beds were occupied with Covid-19 patients, an 8% decrease from the prior week’s count of 1144 patients (Figure 4 and Figure 5 Panel B). An additional 152 (8%) ICU beds remain available. This is higher than the prior week’s 138 beds.
|
Figure 5. Covid-19 Occupancy as a Percent of Listed General Ward (A, left) and ICU (B, right) Capacity in Arizona April 20 – January 22, 2021. |
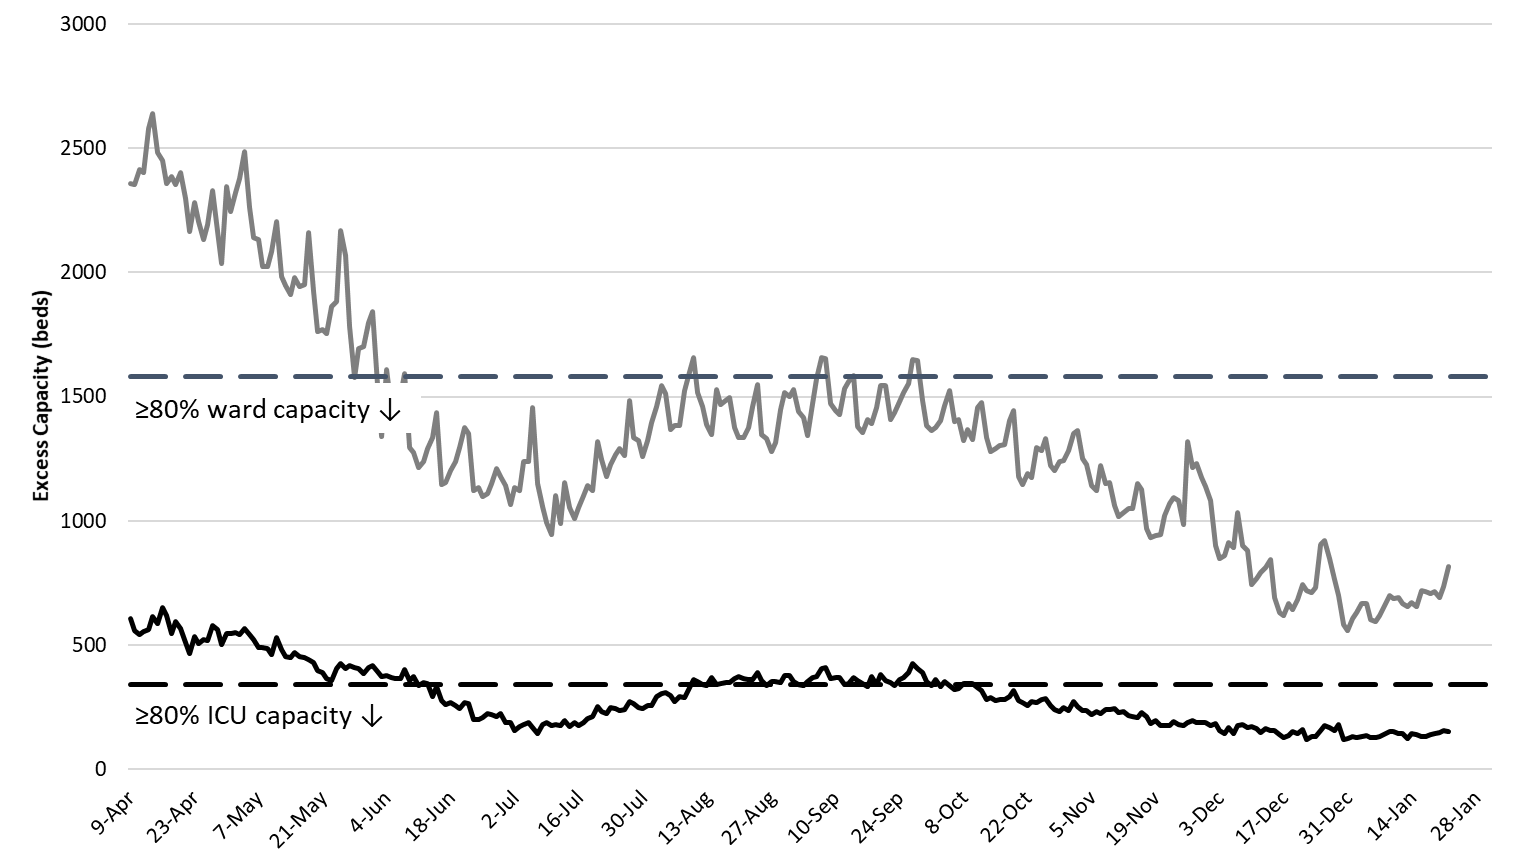
Arizona hospitals’ safety margins remain dangerously low in both the ward and ICU (Figure 6). Most hospitals are still postponing many scheduled procedures to ensure adequate capacity exists for patients with Covid-19. The hospitalization numbers and occupancy trends suggest some moderation of demand for Covid-19 care. While this is encouraging, it is still likely that capacity constraints and changes in care practices are encouraging clinicians to discharge patients from the ED or hospital with higher acuity illness than before this outbreak began. Even if this moderation persists, hospitals will remain overcrowded for the foreseeable future which will continue to compromise access to care for Covid-19 and non-Covid patients alike.
|
Figure 6. Observed Excess Non-Surge General Ward and ICU Capacity April 20 – January 22, 2021. |
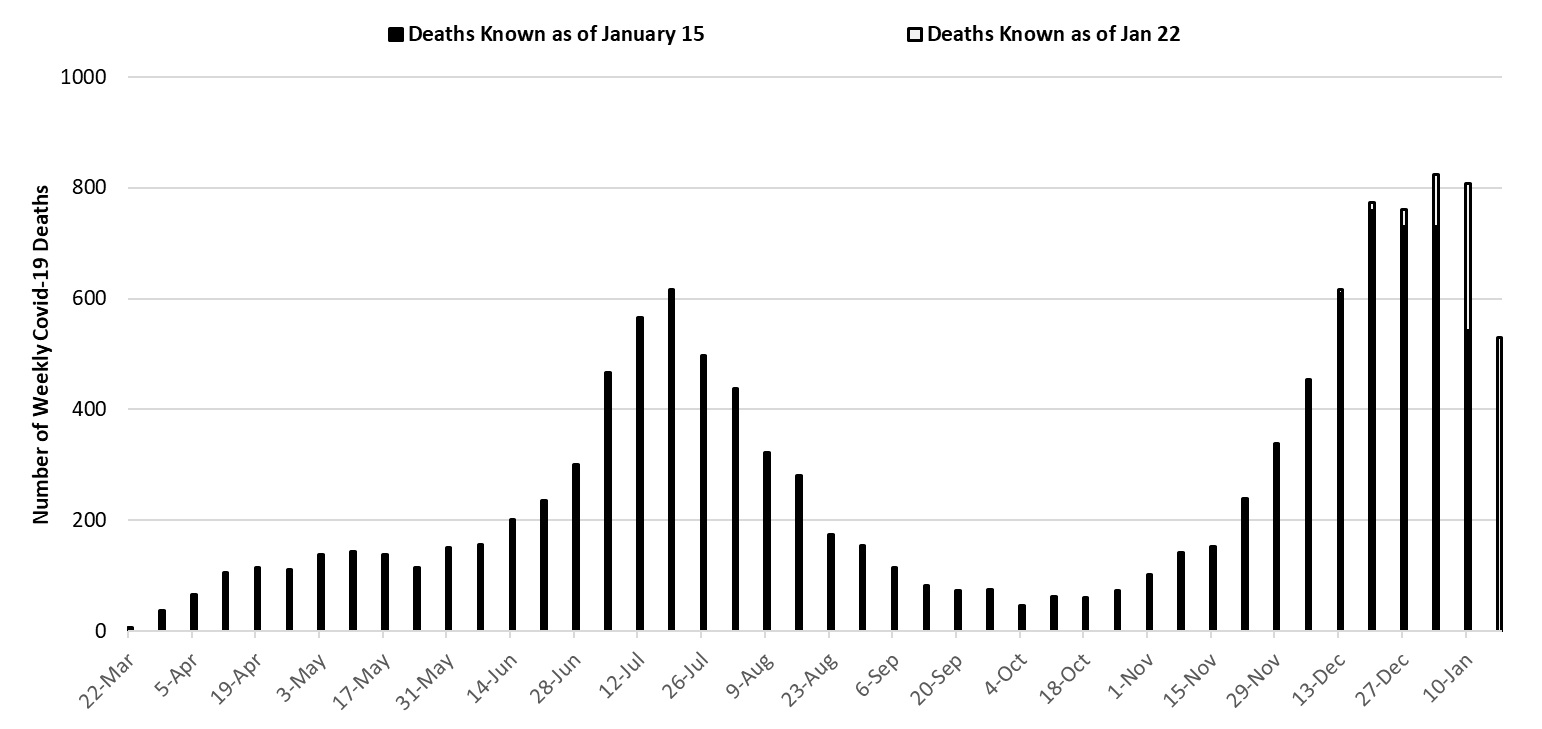
The week ending January 3rd has seen 823 deaths so far, making it Arizona’s deadliest week (Figure 7). The tally for the week of January 3rd will likely be surpassed in the coming weeks as Covid-19 deaths are expected to exceed 700 per week (100 per day) for the next several weeks before moderating. Additional weekly tallies in excess of 800 deaths per week are likely through January.
|
Figure 7. Weekly Arizona Covid-19 Deaths March 1 – January 17, 2021. |
Pima County Outlook
For the week ending January 17th, 6671 Pima County residents were diagnosed with Covid-19 (Figure 8). This represents a 19% decrease from the 8274 cases initially reported last week. Test capacity and/or uptake declined from last week.
|
Figure 8. Covid-19 Cases and Individuals Undergoing Diagnostic Testing in Pima County Mar 1 – Jan 17. |
Last week’s initial tally of 8274 cases was upwardly revised by 5% (374 cases) this week. Trends are similar across various age groups (Figure 9).
|
Figure 9. Covid-19 Cases by Age Group in Pima County from March 1 – January 17, 2021. |
Summary
- This week saw a large, unexpected decline in Covid-19 cases. This decline is unlikely to be an artifact of testing as test positivity continues to decline along with hospital and ICU occupancy. While this reprieve is a welcomed change, the SARS-CoV-2 virus continues to rampage through Arizona and remains at an appallingly high level.
- While future increases are possible, it is unlikely that cases will double over the coming weeks as previously predicted unless there is a major disruption like the more transmissible UK variant. This buys a bit more time to vaccinate Arizona’s most vulnerable.
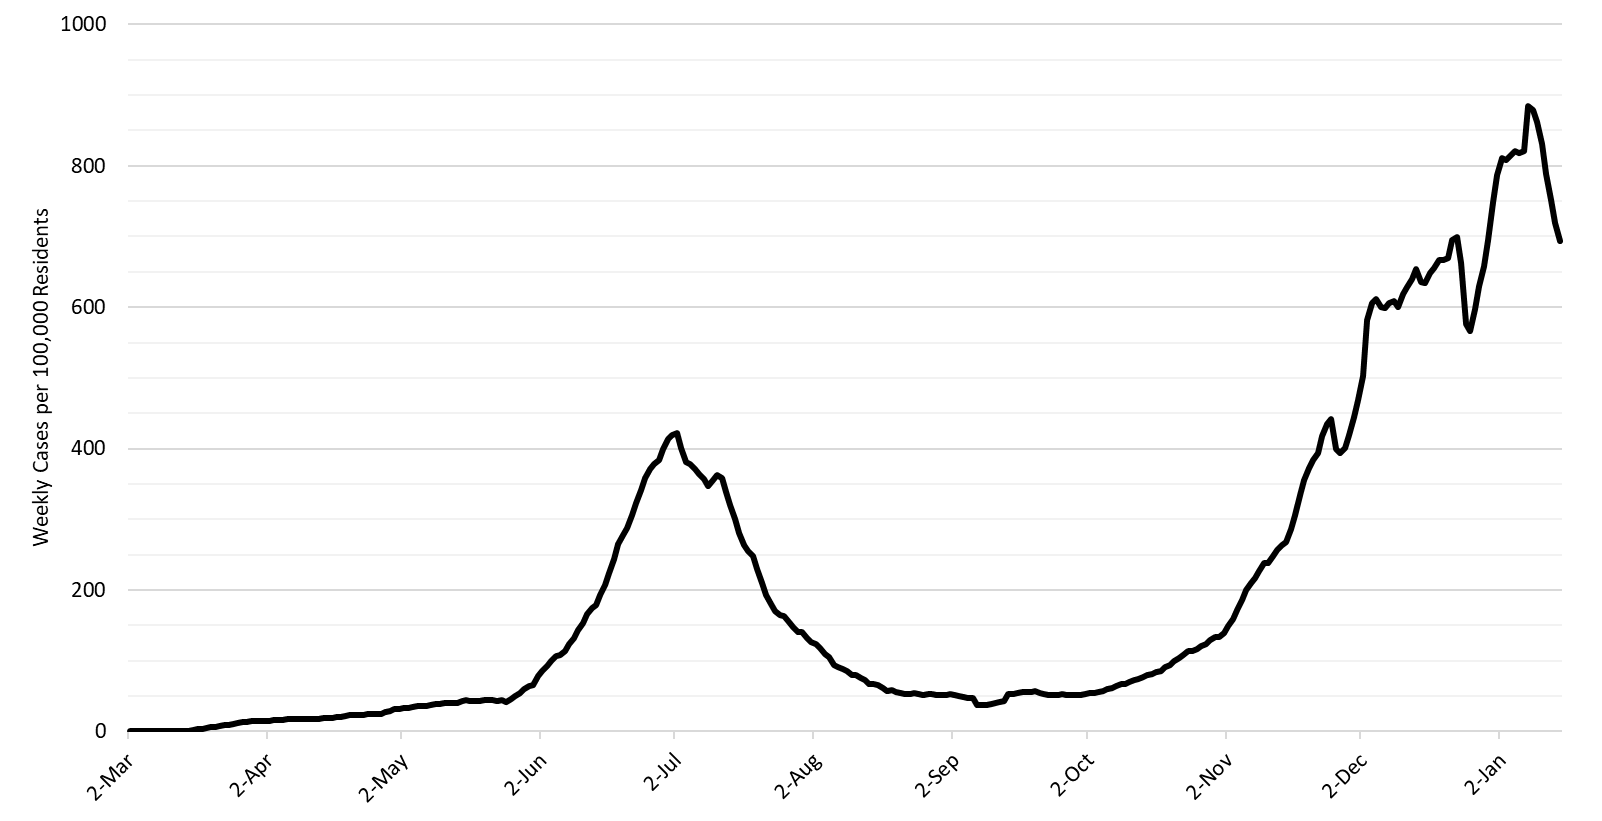
- As of January 17th, new cases were being diagnosed at a rate of 694 cases per 100,000 residents per week (Figure 10 below). This rate was declining by 200 cases per 100,000 residents per week. Despite this improvement, no other state is experiencing faster transmission than Arizona according to the CDC. Because of this, Arizona has moved up 1 position to the 8th hardest hit state since the outbreak began.
- Arizona is reporting >800 Covid-19 deaths per week (>115 per day) and this count may underestimate true fatalities by half (see Woolf, Woolf, or Weinberger). Many of these deaths were preventable if the state had more aggressively adopted evidenced-based public health practices. Arizona’s weekly tally of deaths now ranks first in the nation. Overall, we rank 10th.
- The Arizona Public Health Association release a report on all-cause mortality during the Covid-19 pandemic (link currently unavailable). The main finding is that all-cause mortality was 23% higher in 2020 than 2019 with the months of July and December being outliers with 64% and 61% higher mortality, respectively. This translates into approximately 15,000 excess deaths.
- A recent article in JAMA, reiterated the point that I made several weeks ago that Covid-19 will be at least the 3rd leading cause of death in 2020 and perhaps the leading cause in certain circumstances.
|
Figure 10. 7-Day Moving Average of Arizona Covid-19 Cases by Date of Test Collection Mar 1 – Jan 17, 2021. |
- A resumption of this summer’s targeted business closures is still warranted to further slow transmission and to mitigate overcrowded hospitals. A state-wide mask mandate is also warranted. Individuals and business who do not comply with restrictions should face sanctions.
- If such actions are taken, they must be accompanied by additional state funds to support those businesses and workers most affected by the restrictions.
- Counties and municipalities should be granted additional authority to establish and enforce alternative Covid-19 mitigation policies as they deem appropriate.
- All Arizona residents should wear a mask in public, avoid social gatherings, maintain physical distance from non-household contacts, avoid >15 minutes contact in indoor spaces, especially if physical distancing is inadequate and adherence to face masks is low.
- Hospital Covid-19 occupancy is declining in the ward and ICU. However, access to care for Covid-19 and non-Covid patients remains restricted in ways that are difficult to understand owing to changes in care practices.
- Hospitals continue to postpone many scheduled procedures to create additional capacity for Covid-19 patients at the expense of others with serious medical conditions. However, patients who would have been previously hospitalized are also undoubtedly being treated in an outpatient setting.
- Health professionals are being asked to work additional hours and assume duties outside their traditional scope of practice. Shortages and burn-out will degrade our capacity to provide critical care services over the coming weeks.
- The test positivity rate for traditional nasopharyngeal PCR testing declined for the second straight week, dropping from a peak of 35% to 30% this past week. Nevertheless, our testing capacity is wholly inadequate to the scale of the problem and other regions.
Forecast reports to date, available as PDFs
Download PDF to view additional charts of Arizona counties, available in appendix of report.
2020 Reports
Based on what we know now about this pandemic, we support guidelines for social distancing to slow the spread of the virus and urge everyone to follow the recommendations provided by the Centers for Disease Control and Prevention (CDC) to protect yourself, your family, your neighbors, and your employees. Please heed the recommendations as provided by the CDC, found at the following website: https://www.cdc.gov/coronavirus/2019-ncov/prepare/prevention.html
COVID covid coronavirus virus covid19 corona forecast model