
Weekly Arizona COVID-19 Data Report – Dr. Joe Gerald, July 30
Note this forecast page is not the most recent forecast available.
View the most current forecast report
Researcher Analyzes Arizona COVID-19 Spread Models for Decision-Makers
The following information regarding the spread of COVID-19 in Arizona was prepared by Joe Gerald, MD, PhD, a researcher at the Mel and Enid Zuckerman College of Public Health (MEZCOPH) at the University of Arizona. This information has also been reviewed by other MEZCOPH faculty.
This data were obtained from the Arizona Department of Health Services COVID-19 webpage and reflect conditions in Arizona as of July 30, 2021.
This information is intended to help guide our response to the outbreak. It is not intended to predict how this pandemic will evolve. Rather, this model extrapolates what might occur if current conditions remain unchanged. As regional authorities and healthcare providers respond, their actions are expected to mitigate the worst consequences of this pandemic.

COVID-19 Disease Outbreak Forecast
Arizona State and Pima County
Updated July 30, 2021
Disclaimer: This information represents my personal views and not those of The University of Arizona, the Zuckerman College of Public Health, or any other government entity. Any opinions, forecasts, or recommendations should be considered in conjunction with other corroborating and conflicting data. Updates can be accessed at https://publichealth.arizona.edu/news/2021/covid-19-forecast-model.
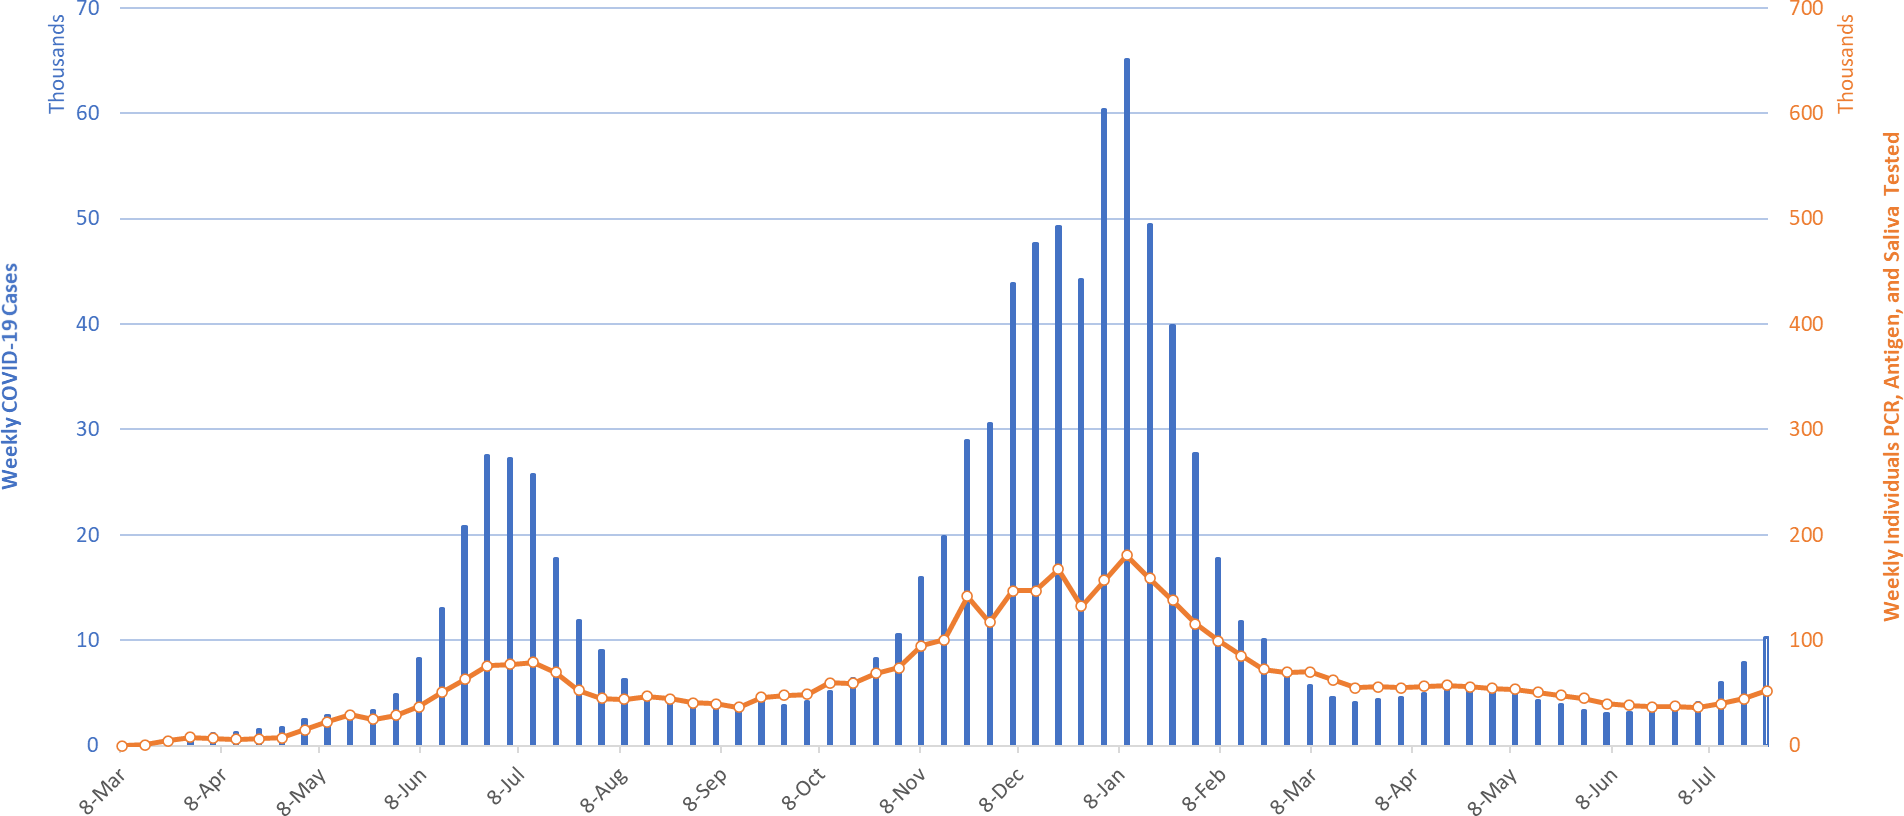
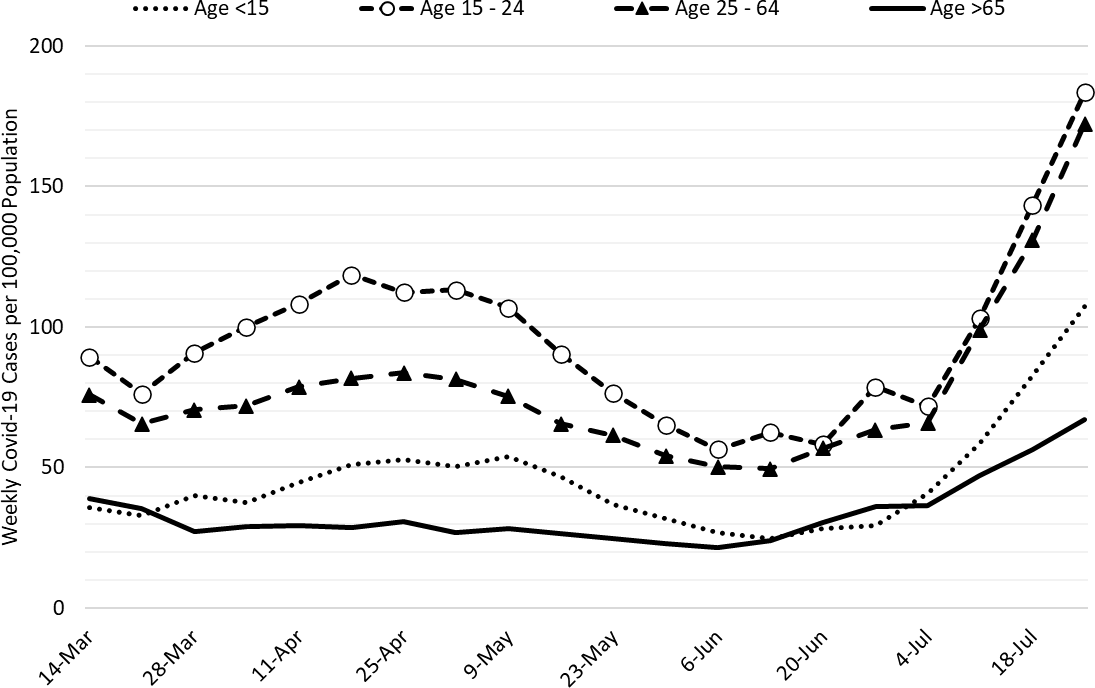
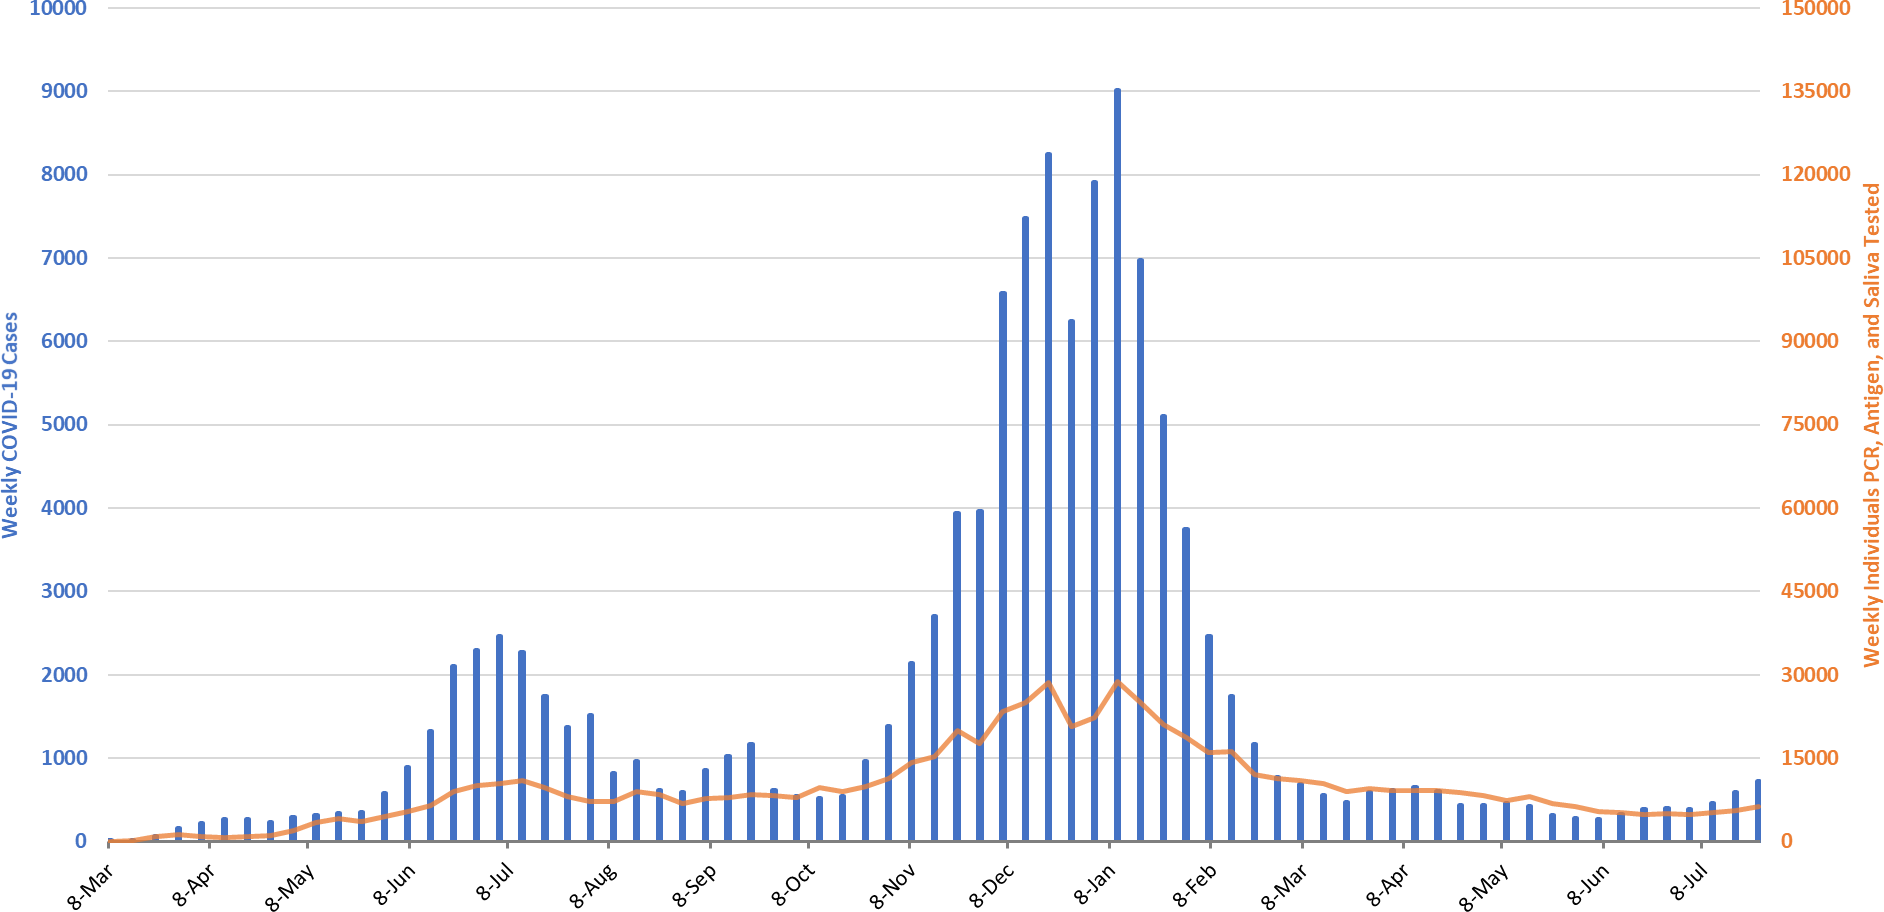
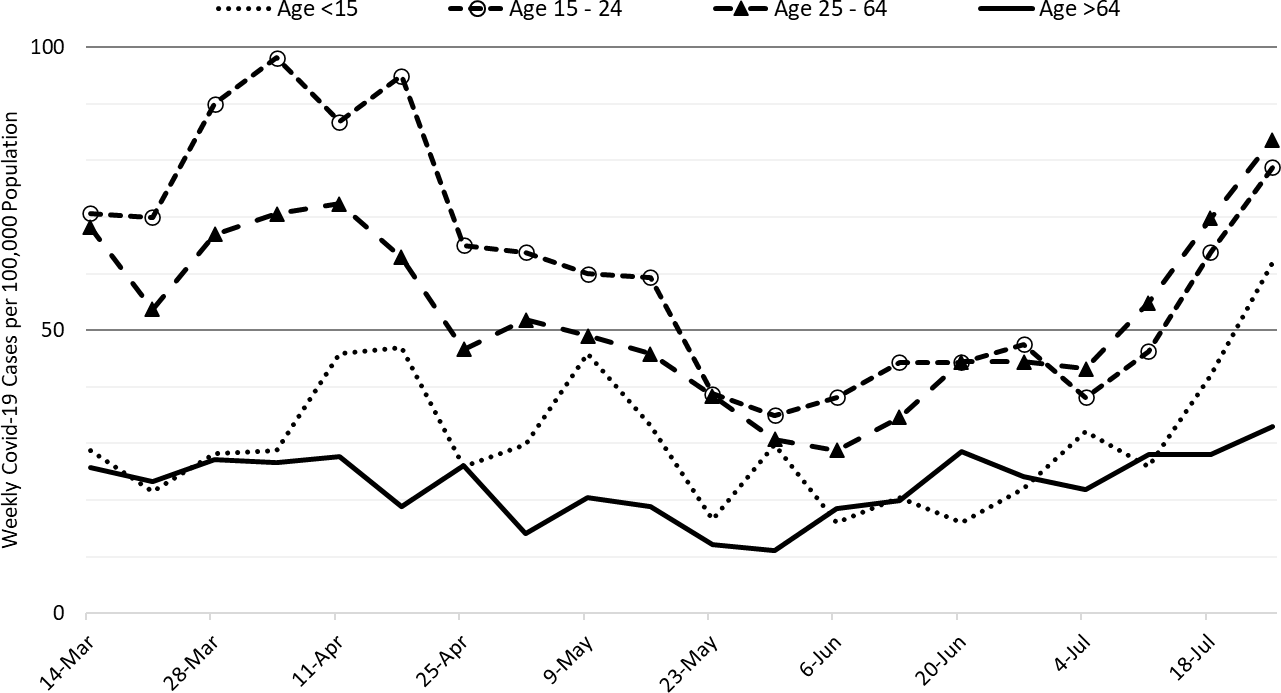
For the week ending July 25th, 10273 Arizonans were diagnosed with COVID-19, a 31% increase from last week’s initial tally of 7836 cases (Figure 1). This marks a 7th week of increasing rates with the last 3 being particularly brisk. The current rate, 141 cases per 100K residents per week, is increasing by 32 cases per 100K residents per week. While rates are about 3X higher among those 15 – 24 years of age as compared to those ≥65 years of age, 183 versus 67 cases per 100K residents per week, respectively, transmission is increasing among all age groups (Figure 2a).
|
Figure 1. Newly Diagnosed Covid-19 Cases in Arizona and Number of Individuals Undergoing Covid-19 Diagnostic Testing March 1, 2020 through July 25, 2021. |
Rates are now above the threshold marking high levels of community transmission. Unfortunately, the potential size and/or duration of this outbreak remains uncertain. At 141 cases per 100K residents, Arizona ranks 17th among the 50 states. Louisiana, Florida, Arkansas, and Mississippi are currently leading the pack with rates 2 – 3X higher than ours: 539, 463, 373, and 336 cases per 100K residents per week, respectively. Fortunately, these rates remain below the peaks seen in these states during the January 2021 outbreak.
According to the CDC, 55% of Arizona adults have received 2-doses of vaccine while another 9% have received 1-dose. For a bit of perspective, only 43% of adults were vaccinated against influenza in the 2019-2020 season so we are doing better than usual, but still not good enough. On a positive note, about 70 thousand vaccine doses were administered last week which is about 10 thousand more than the prior week. As slow and frustrating as our vaccination efforts may seem, it is important we continue the hard work of vaccine outreach.
|
Figure 2a. Newly Diagnosed Covid-19 Cases in Arizona by Age Group March 7 – July 25, 2021. |
Resumption of in-person instruction (K-12 and universities) in the face of high community transmission, low vaccination rates, prohibition of universal masking, lack of surveillance testing, and minimal physical distancing will undoubtedly lead to frequent school-related outbreaks and accelerating community transmission. While rates were similar this time last year, 156 versus 141 cases per 100K residents per week, conditions were improving not worsening, -87 versus +32 cases per 100K residents per week. For this reason, August is likely to be a difficult month.
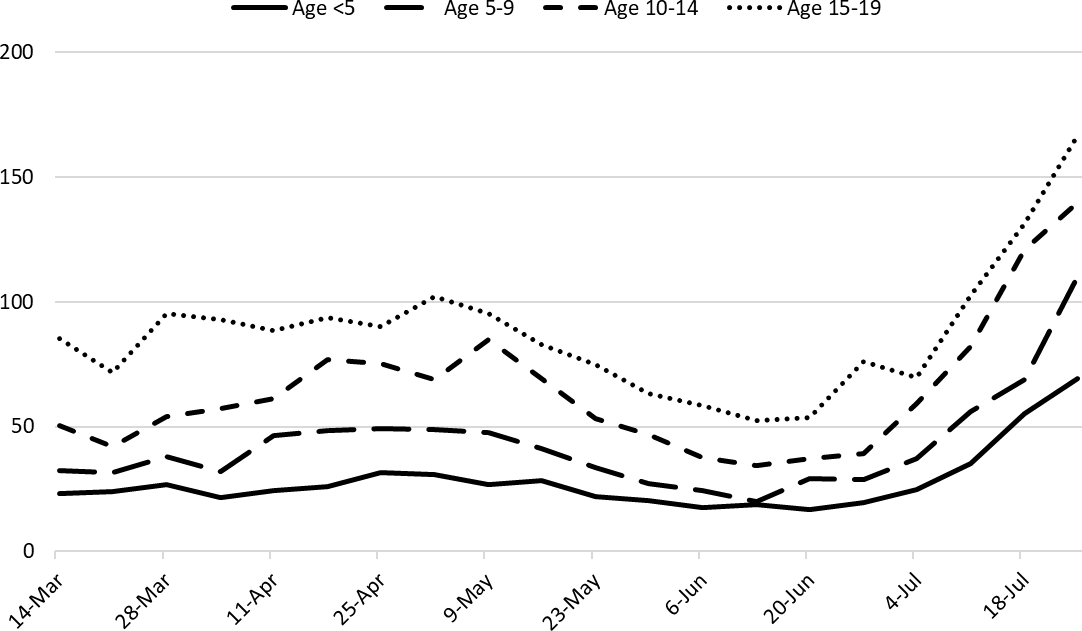
As K – 12 schools are resuming in-person instruction, it is useful to consider trends in childhood case rates (Figure 2b). As discussed in prior reports, children 15 – 19 years of age have case rates that approximate those of adults while prepubertal children have lower rates. Even though mask wearing in classrooms is recommended by the CDC (unvaccinated) and the American Academy of Pediatrics (everyone), but our state isn’t going to follow suit. Yet another reason to keep supporting vaccination efforts.
|
Figure 2b. Newly Diagnosed Covid-19 Cases in Arizona by Age Group March 7 – July 25, 2021. |
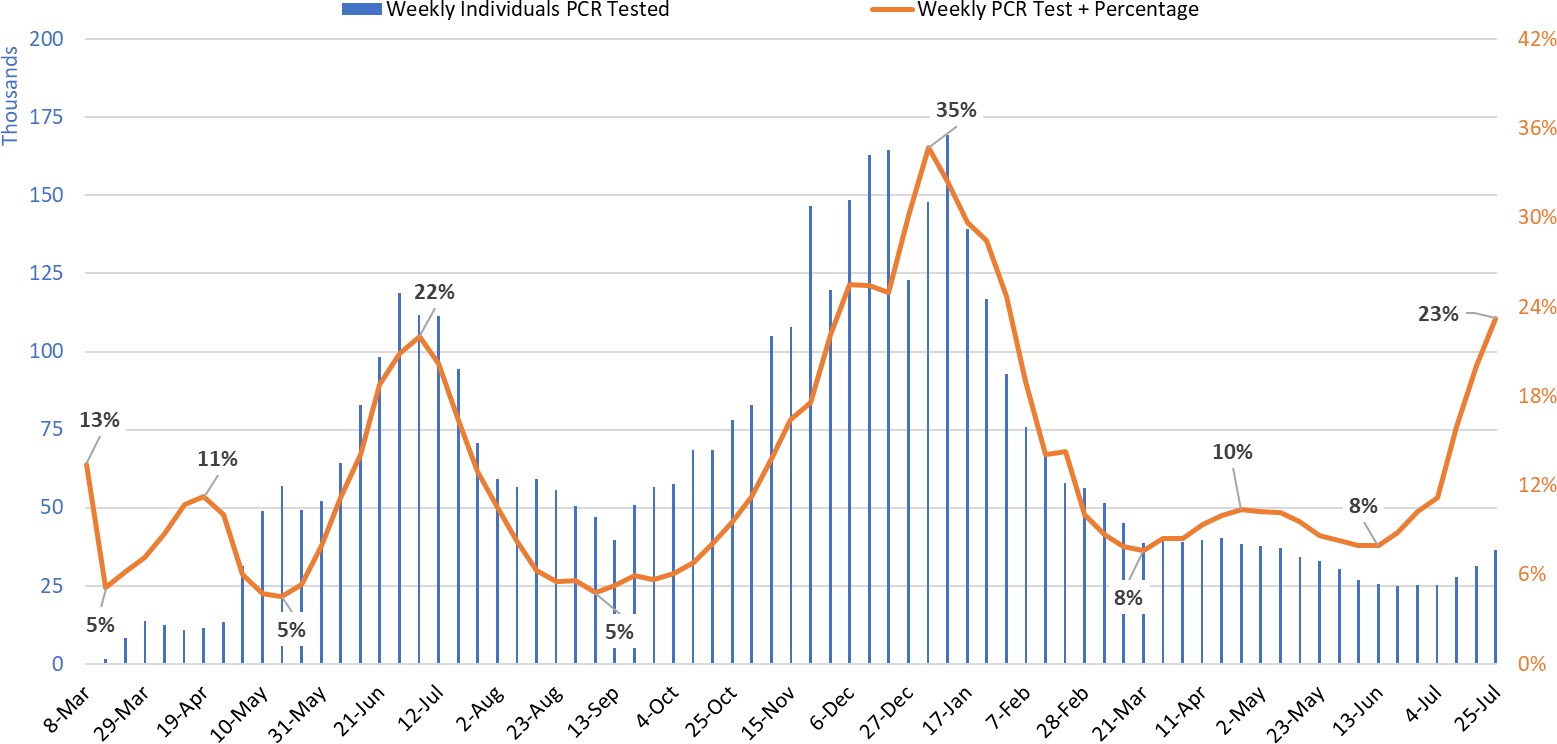
Test positivity among those undergoing traditional nasopharyngeal PCR testing rose to 23% this week, another meaningful week-to-week increase (Figure 3). This level indicates testing is inadequate for optimal public health practice and means many cases are going undiagnosed.
|
Figure 3. Weekly Number Patients Undergoing Traditional Nasopharyngeal PCR Testing and Associated Percent Positivity March 1, 2020 – July 25, 2021. |
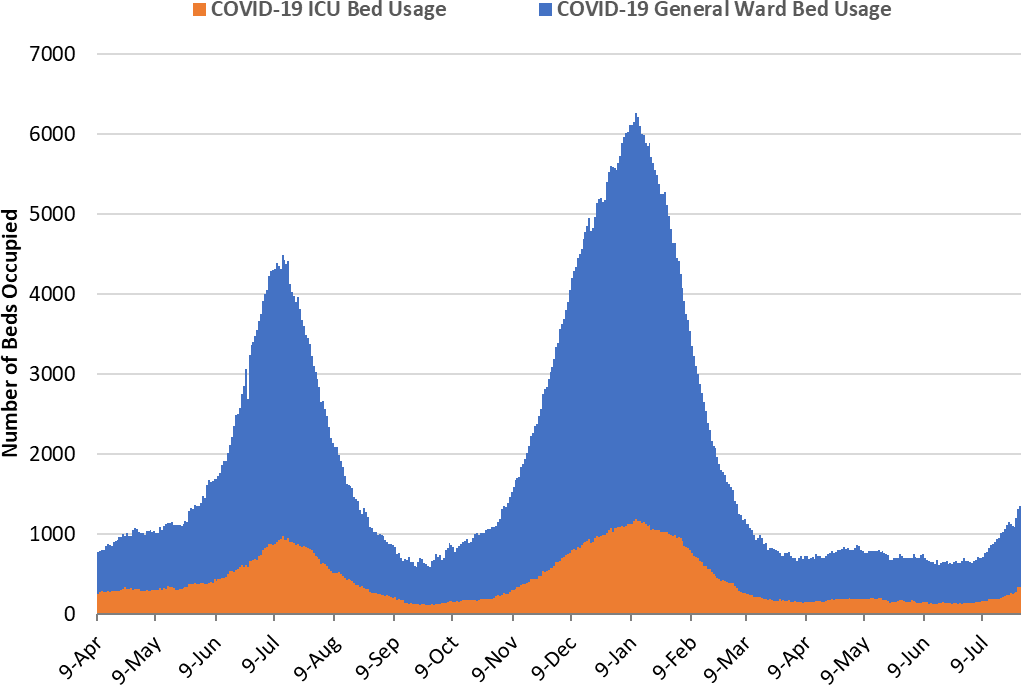
As of July 28th, 1019 (13%) of Arizona’s 8651 general ward beds were occupied by Covid-19 patients, a 17% increase from the previous week’s 868 occupied beds (Figure 4 and Figure 5 Panel A). Another 964 (11%) beds remained available for use. The number of available beds is higher than the previous week’s 861 beds.
|
Figure 4. Arizona Daily Covid-19 General Ward and ICU Census April 9, 2020 – July 28, 2021. |
As of July 28th, 335 (22%) of Arizona’s 1726 ICU beds were occupied with Covid-19 patients, an 41% increase from the prior week’s count of 237 patients (Figure 4 and Figure 5 Panel B). An additional 186 (13%) ICU beds remained available for use, lower than last week’s 217 beds.
|
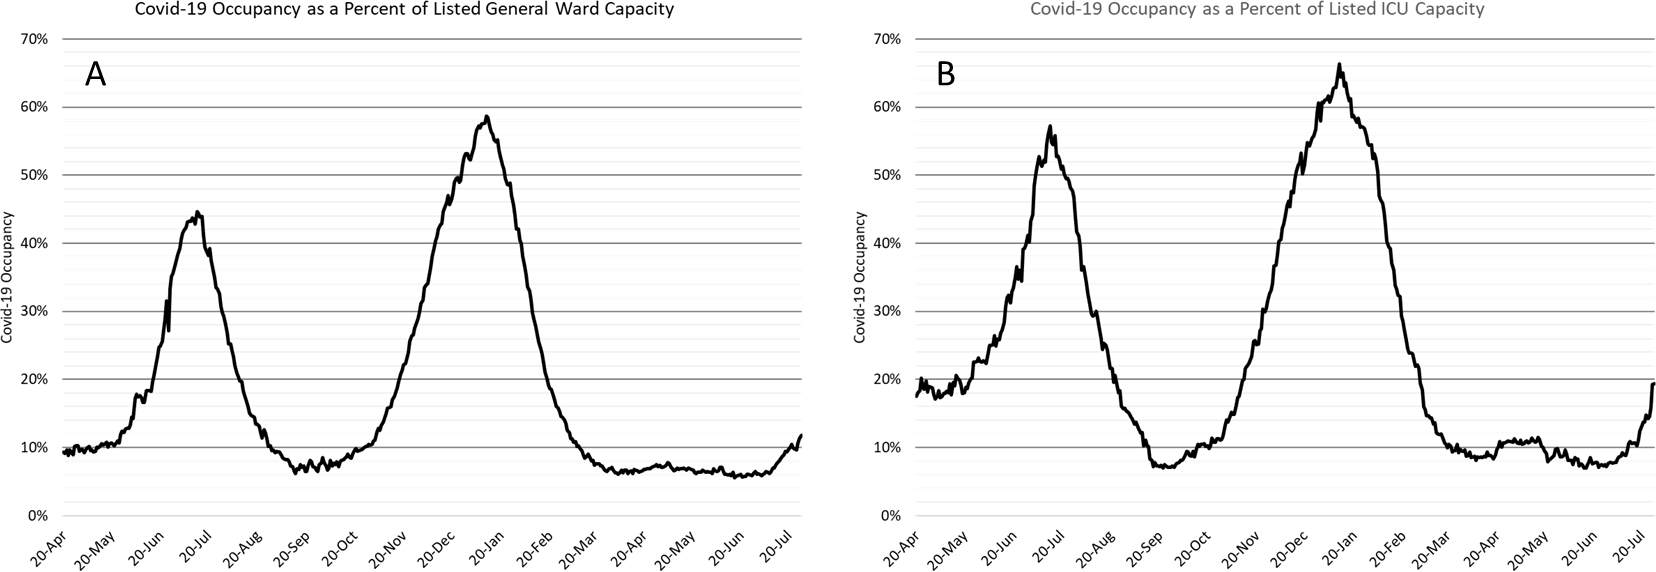
Figure 5. Covid-19 Occupancy as a Percent of Listed General Ward (A, left) and ICU (B, right) Capacity in Arizona April 20, 2020 – July 28, 2021. |
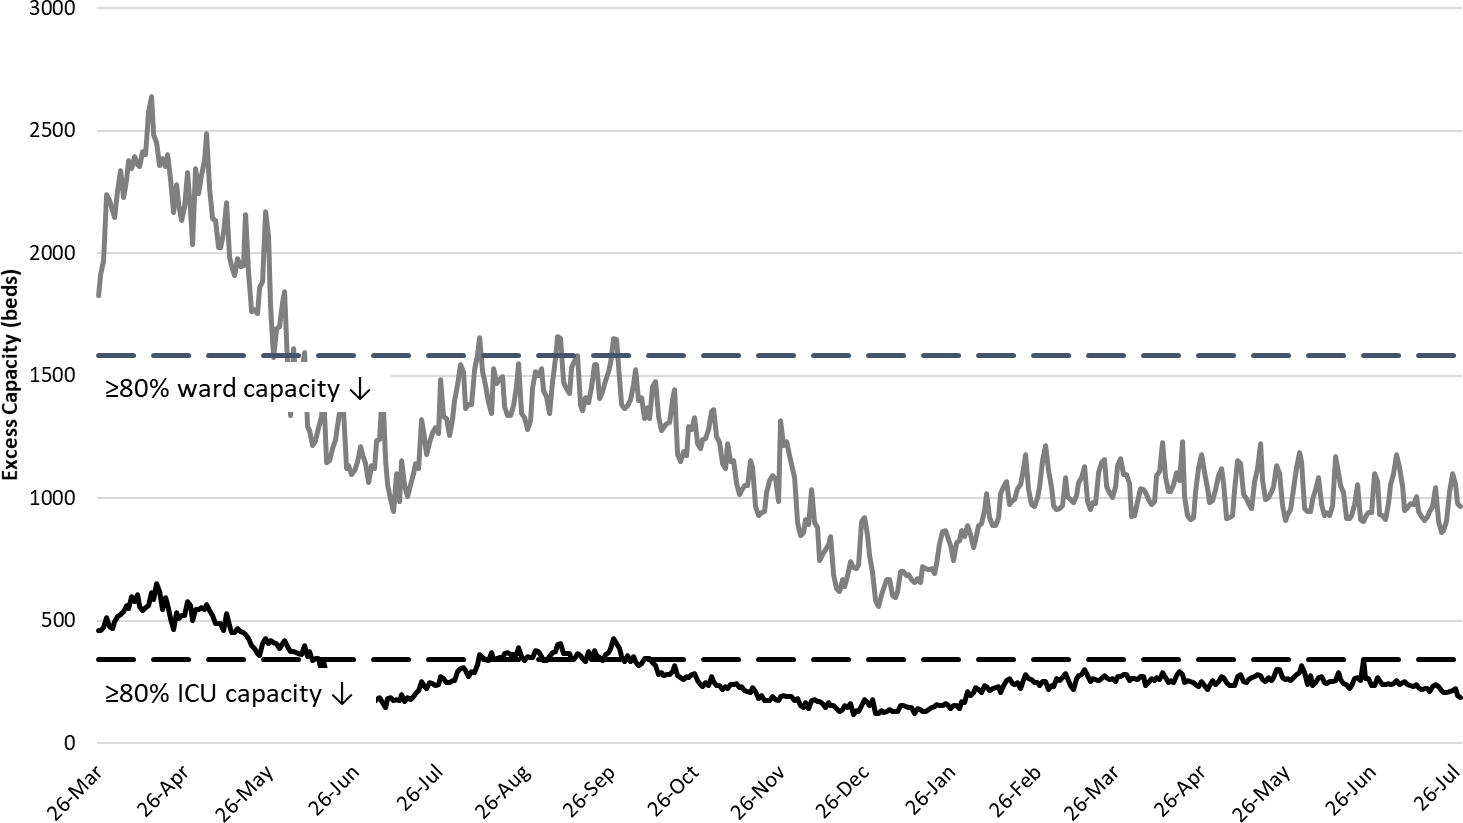
Arizona hospital occupancy remains above seasonal levels. Improvements in ward and ICU occupancy remain stalled at ≥85% occupancy (Figure 6). Undoubtedly, some medically necessary procedures that were previously postponed are still being rescheduled to address the backlog of care. Occupancy will need to fall 70- 75% before conditions will be back to “normal.” However, hospitals should be prepared for >10% COVID-19 occupancy for the foreseeable future as viral transmission remains at high levels.
|
Figure 6. Observed Excess Non-Surge General Ward and ICU Capacity March 26, 2020 – July 28, 2021. |
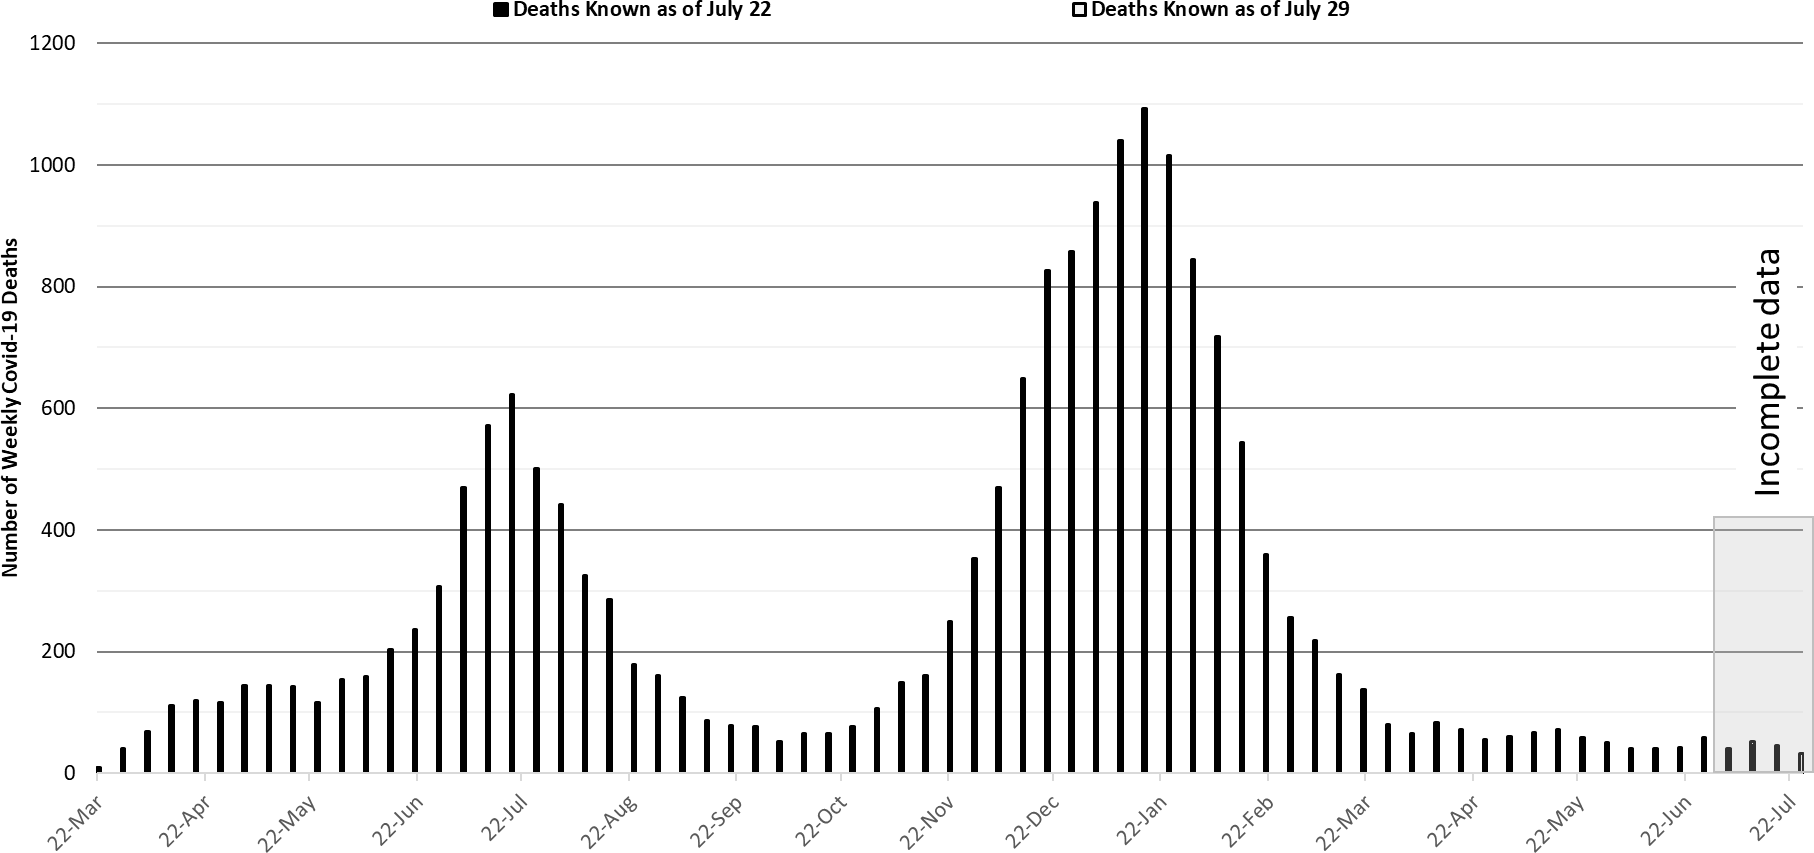
The week ending January 17, 2021 remains Arizona’s deadliest with 1093 deaths (Figure 7a). Weekly deaths now tally about 50 and are expected to rise with increased case rates. The age-standardized case fatality rate remains about 1.5% (Figure 7b), meaning that in 3 – 4 weeks Arizona could be seeing >100 deaths per week.
|
Figure 7a. Weekly Arizona Covid-19 Deaths March 16, 2020 – July 25, 2021. |
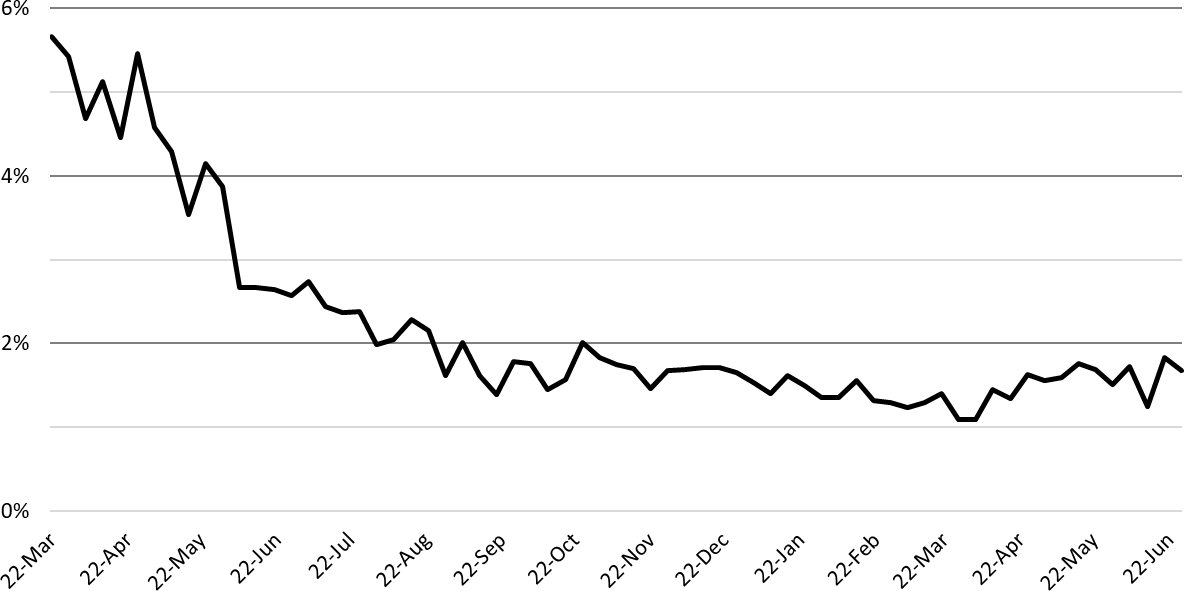
|
Figure 7b. Age-Standardized COVID-19 Case Fatality Rate March 22, 2020 – June 27, 2021. |
Pima County Outlook
For the week ending July 25th, 722 Pima County residents were diagnosed with Covid-19 (Figure 8). This is a 25% increase from the 577 cases initially reported last week.
|
Figure 8. Covid-19 Cases and Individuals Undergoing Testing in Pima County Mar 1, 2020 – July 25, 2021 |
New cases are being diagnosed at a rate of 69 cases per 100K residents per week. This rate is increasing by 13 cases per 100K residents per week. Pima County’s rates remain lower than the state average. Trends across the various age groups appear in Figure 9.
|
Figure 9. Covid-19 Cases by Age Group in Pima County from March 14 – July 25, 2021. |
Summary
- This past week saw another marked increase in viral transmission. Arizona is now experiencing high levels of transmission that will be sustained for weeks to come.
- As of July 25th, new cases were being diagnosed at a rate of 141 cases per 100,000 residents per week. The rate is increasing at 32 cases per 100,000 residents per week. Another wave of cases and hospitalizations, caused by the increasing prevalence of the Delta variant is now certain. The Delta variant now accounts for >75% of all cases.
- Vaccination remains the most important public health priority to reduce viral transmission and severe illness. With this marked acceleration in transmission, mandating masks in indoor spaces, including classrooms, and limiting large gatherings is warranted to reduce transmission in public settings.
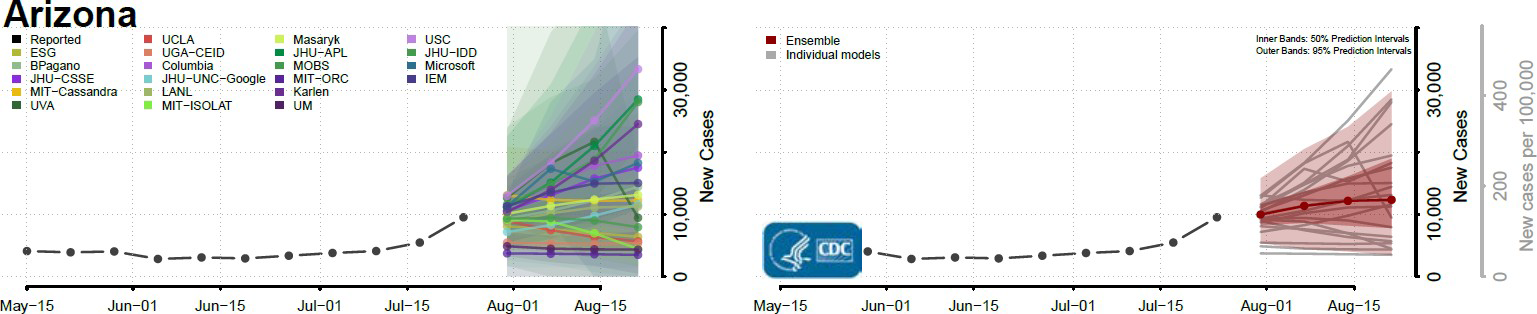
- Resumption of in-person instruction in K – 12 schools and universities in August is expected to lead to frequent school-associated outbreaks and will undoubtedly increase community transmission. With a straight face, the CDC now forecasts that cases in Arizona will decrease, stay the same, or increase over the next 4-weeks (immediately below). Thanks a lot!
- Hospital COVID-19 occupancy is increasing and is likely to exceed 10% of all beds in the general ward and 20% of beds in the ICU for many weeks. Access to care remains somewhat restricted as occupancy remains unseasonably high. Once again, elective procedures are likely to be postponed.
- Arizona is now experiencing 50 deaths per week. This amount will increase in the coming weeks and could exceed 100 per week by the middle-to-end of August.
- According to the CDC, 55% of Arizona adults have received at least 2-doses of vaccine while another 9% have received 1-dose.
- Despite evidence of limited immune escape to the Delta variant, especially before completion of the full vaccination sequence, vaccination continues to provide extraordinarily high levels of protection from severe illness.
- The CDC revised its mask guidance for vaccinated individuals in part due to a large outbreak in Massachusetts where the majority of cases was among fully vaccinated residents. Fully vaccinated individuals should mask when indoors in public spaces where community transmission is high or substantial. If exposed to a known case, individuals should be tested in 3 – 5 days regardless of symptoms and wear a mask for 14 days post-exposure.
Forecast reports to date, available as PDFs
Download PDF to view additional charts of Arizona counties, available in appendix of report.
2020 Reports
Based on what we know now about this pandemic, we support guidelines for social distancing to slow the spread of the virus and urge everyone to follow the recommendations provided by the Centers for Disease Control and Prevention (CDC) to protect yourself, your family, your neighbors, and your employees. Please heed the recommendations as provided by the CDC.
COVID covid coronavirus virus covid19 corona forecast model