
Weekly Arizona COVID-19 Data Report – Dr. Joe Gerald, October 15
Note this forecast page is not the most recent forecast available.
View the most current forecast report
Researcher Analyzes Arizona COVID-19 Spread Models for Decision-Makers
The following information regarding the spread of COVID-19 in Arizona was prepared by Joe Gerald, MD, PhD, a researcher at the Mel and Enid Zuckerman College of Public Health (MEZCOPH) at the University of Arizona. This information has also been reviewed by other MEZCOPH faculty.
This data were obtained from the Arizona Department of Health Services COVID-19 webpage and reflect conditions in Arizona as of October 15, 2021.
This information is intended to help guide our response to the outbreak. It is not intended to predict how this pandemic will evolve. Rather, this model extrapolates what might occur if current conditions remain unchanged. As regional authorities and healthcare providers respond, their actions are expected to mitigate the worst consequences of this pandemic.

COVID-19 Disease Outbreak Forecast
Arizona State and Pima County
Updated October 15, 2021
Disclaimer: This information represents my personal views and not those of The University of Arizona, the Zuckerman College of Public Health, or any other government entity. Any opinions, forecasts, or recommendations should be considered in conjunction with other corroborating and conflicting data. Updates can be accessed at https://publichealth.arizona.edu/news/2021/covid-19-forecast-model.
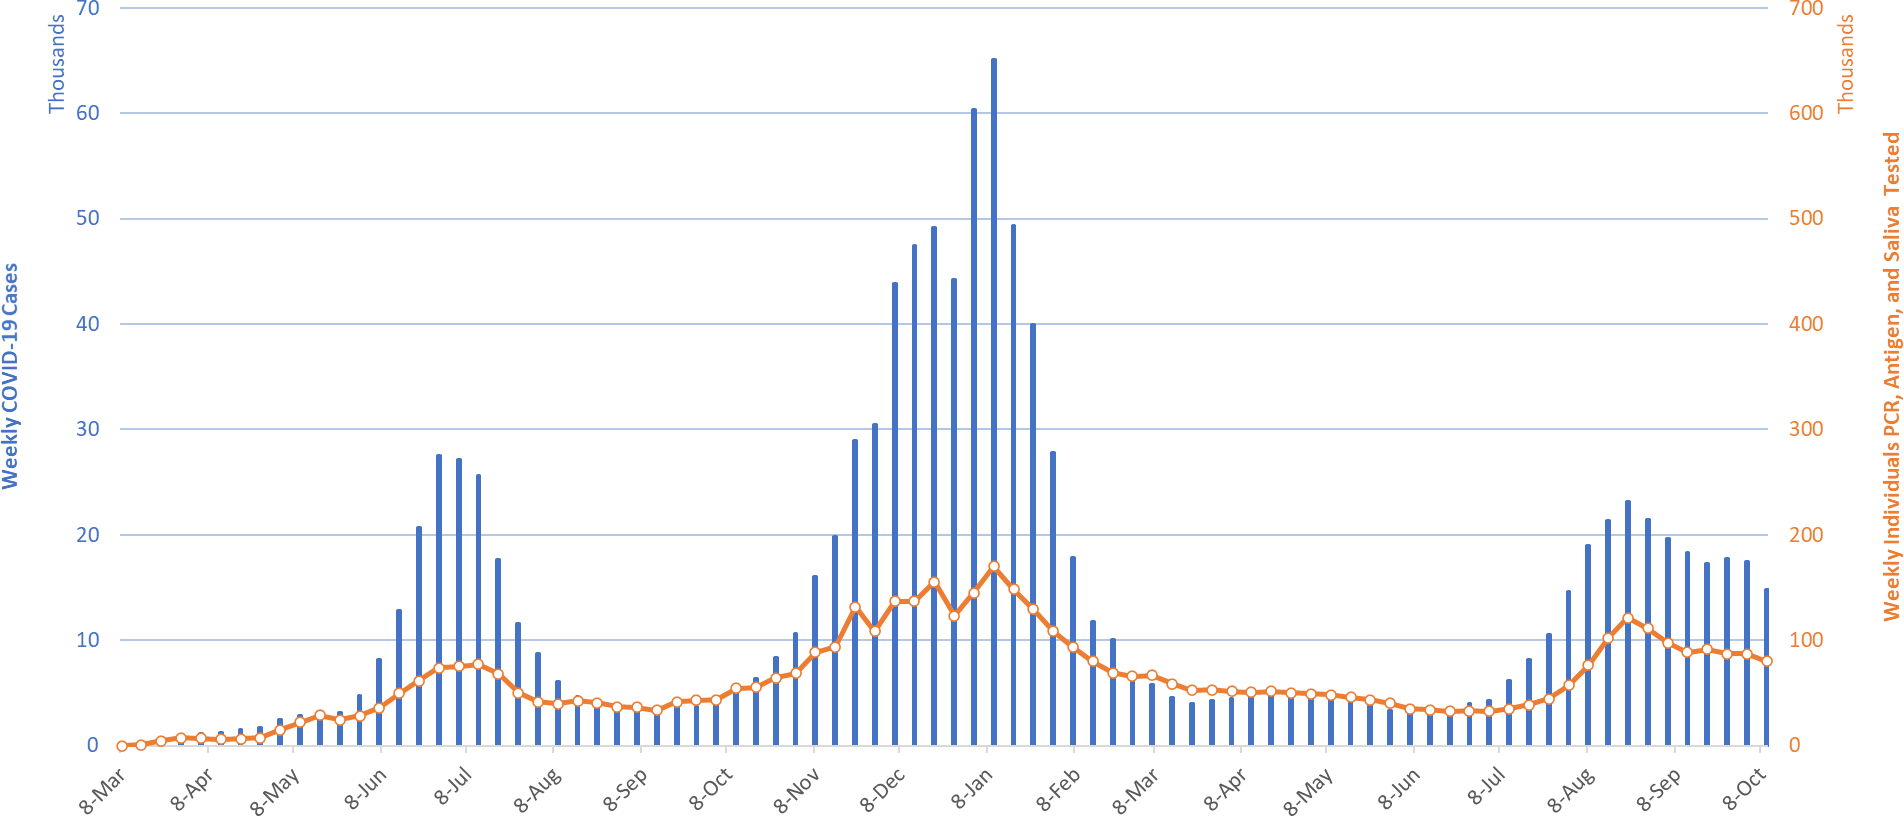
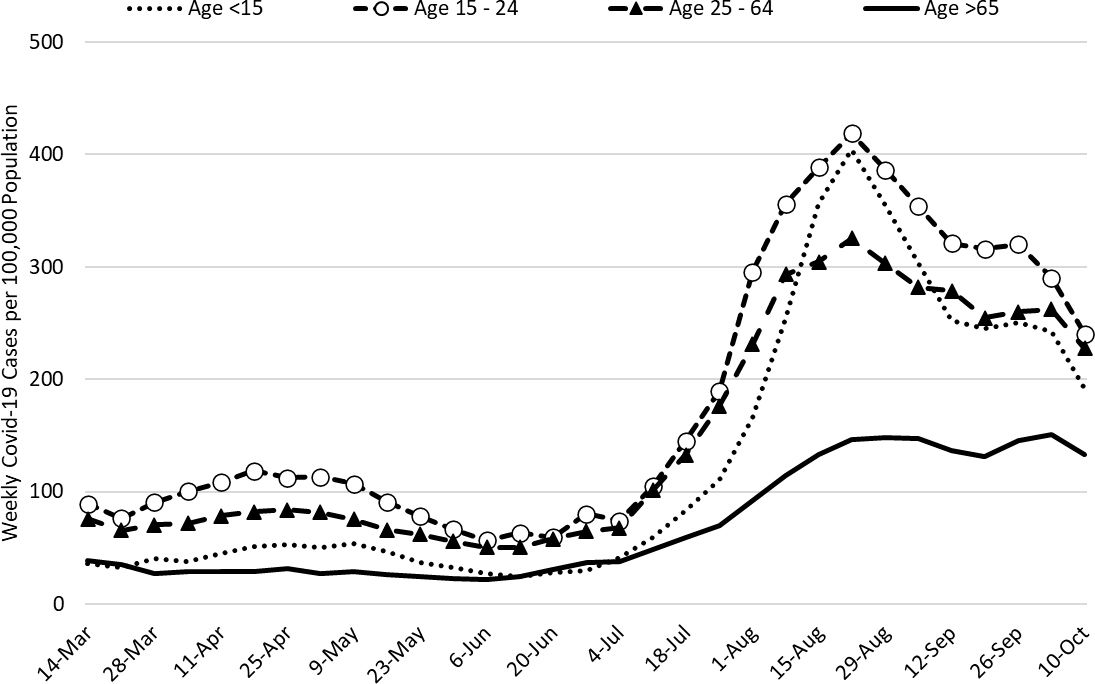
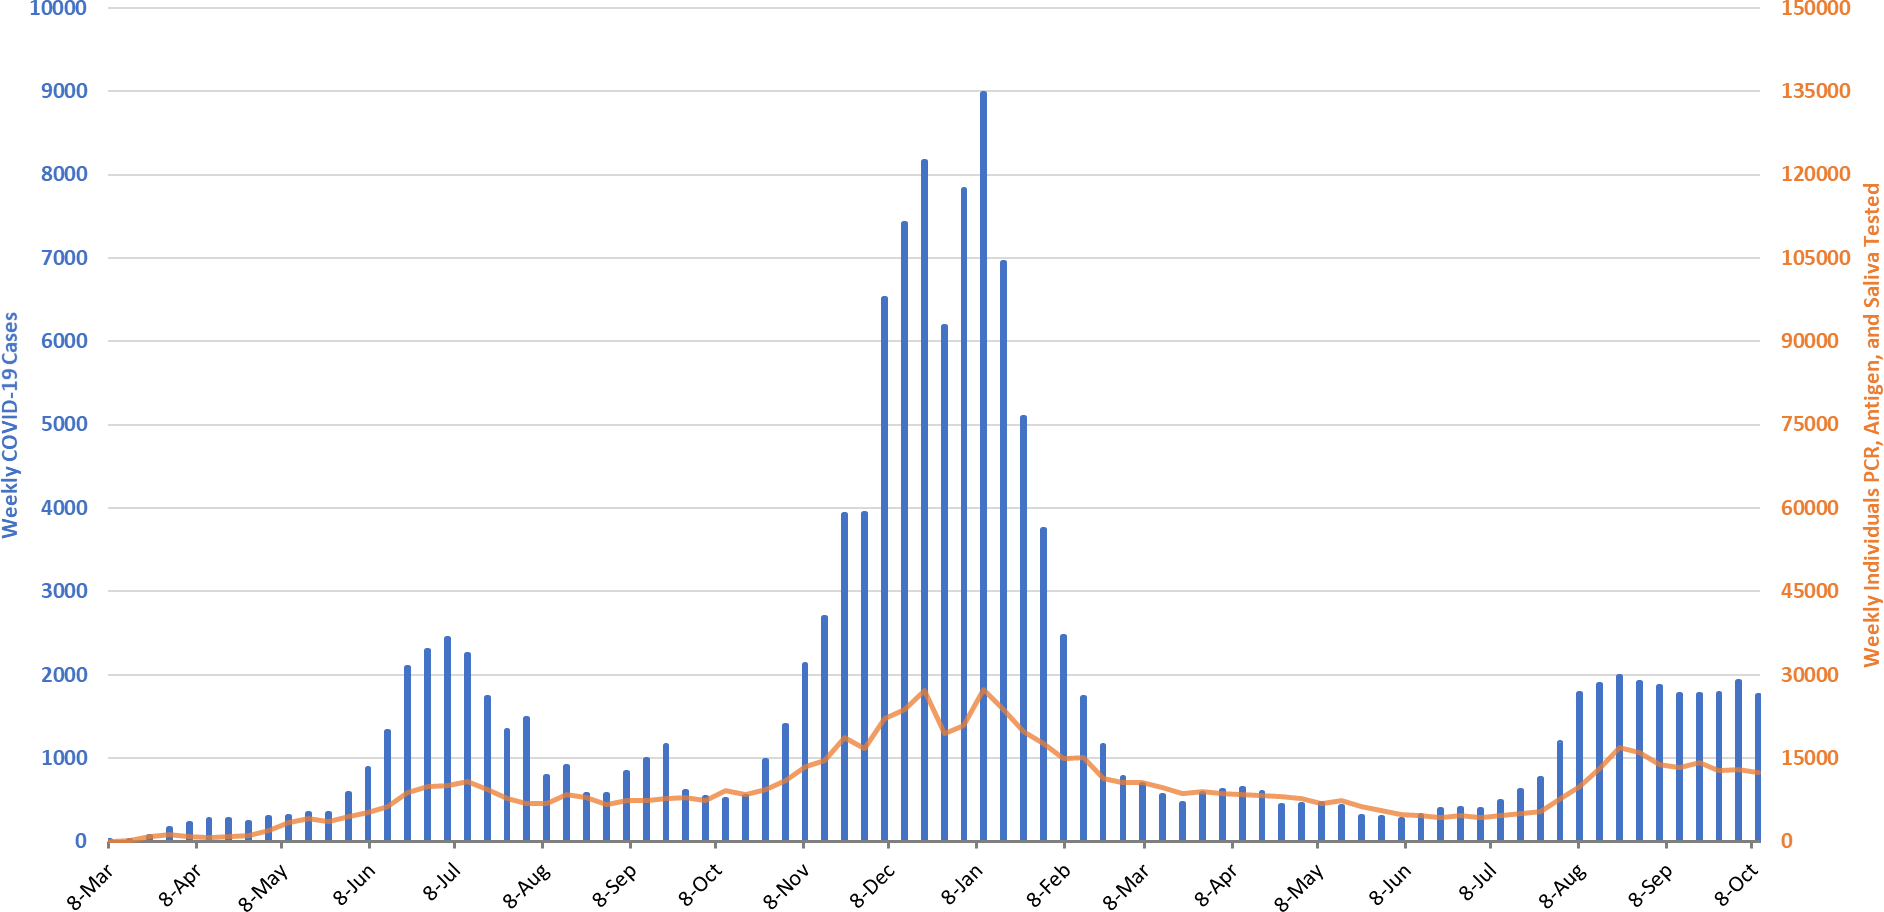
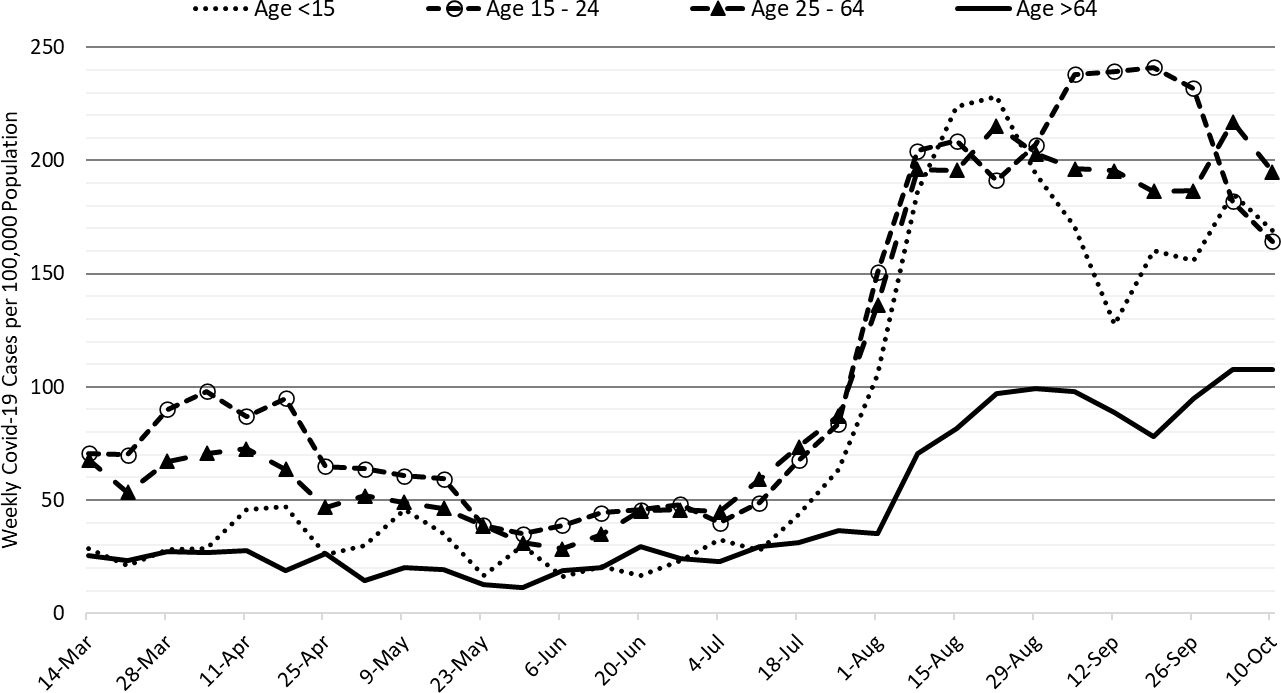
For the week ending October 10th, 14791 Arizonans were diagnosed with COVID-19, a 14% decrease from last week’s initial tally of 17133 cases (Figure 1). Hopefully, this marks a period of faster resolution that will allow us to exit the high transmission category in November. The current case rate, 203 cases per 100K residents per week, is decreasing by 33 cases per 100K residents per week. Case rates remain highest among those 15 – 24 years and lowest among those >65 years, 240 versus 133 cases per 100K residents, respectively (Figure 2a below).
|
Figure 1. Weekly COVID-19 Cases in Arizona and Number of Individuals Undergoing COVID-19 Diagnostic Testing March 1, 2020 – October 10, 2021. |
Arizona continues to experience a high number of cases, hospitalizations, and deaths. With waning vaccine efficacy and a potentially short duration of acquired immunity, herd immunity is not achievable. As winter approaches, more previously vaccinated and previously infected individuals will become susceptible. While these individuals will remain well protected from severe outcomes, they will contribute to community transmission meaning unvaccinated Arizonans will not be able to avoid infection by “free riding” on high levels of community immunity. The decision to remain unvaccinated carries a much greater risk than getting vaccinated does. Hopefully, Merck’s preliminary, promising new antiviral will be available before the end of the year.
Arizona’s national ranking on new cases is 23rd out of 50 states with the nation’s leaders being Alaska (843), Montana (576), Wyoming (501), Idaho (480), and North Dakota (475). According to the CDC, 63% of Arizona’s adult population is fully vaccinated and another 10% have received one dose. Nationally, 13% of those 65+ years have received a third dose booster. This week the FDA vaccine advisory committee recommend boosters for Moderna and J&J too. The ADHS Vaccine Dashboard shows weekly doses delivered locally fell to 85K doses, many of which are likely third dose boosters.
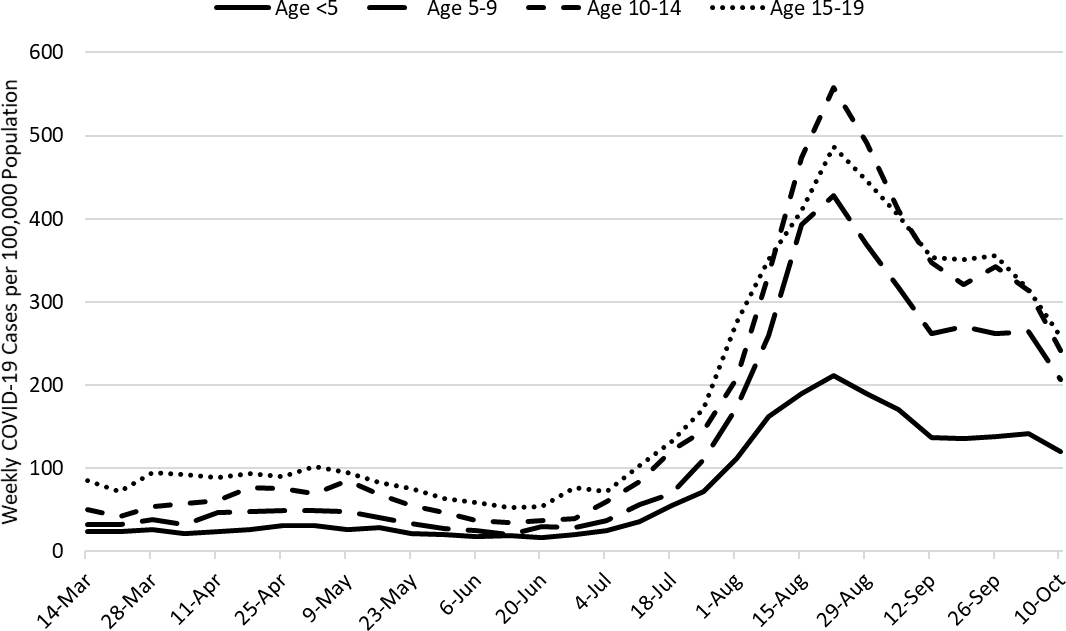
Figure 2a shows quickening improvements among all groups. Worryingly, cases among those 65+ remain quite high despite high levels of vaccination among this group. Among school-age children, transmission is declining rapidly (Figure 2b). ASU, MCDPH, and PCHD researchers recently provided strong evidence supporting K – 12 mask mandates; Arizona schools without mandates had 3.5 times the odds of a school outbreak (95%CI 1.8 – 6.9) as compared to those with a mandate. The Arizona Supreme Court is expected hear oral arguments on the State’s prohibition of school mask mandates during the first week of November. A new, small, pre-Delta study of households with school employees or school children provides interesting data on well-defined transmission chains.
|
Figure 2a. COVID-19 Cases in Arizona by Age Group March 7 – October 10, 2021. |
|
Figure 2b. COVID-19 Cases in Arizona among Children by Age Group March 7 – October 10, 2021. |
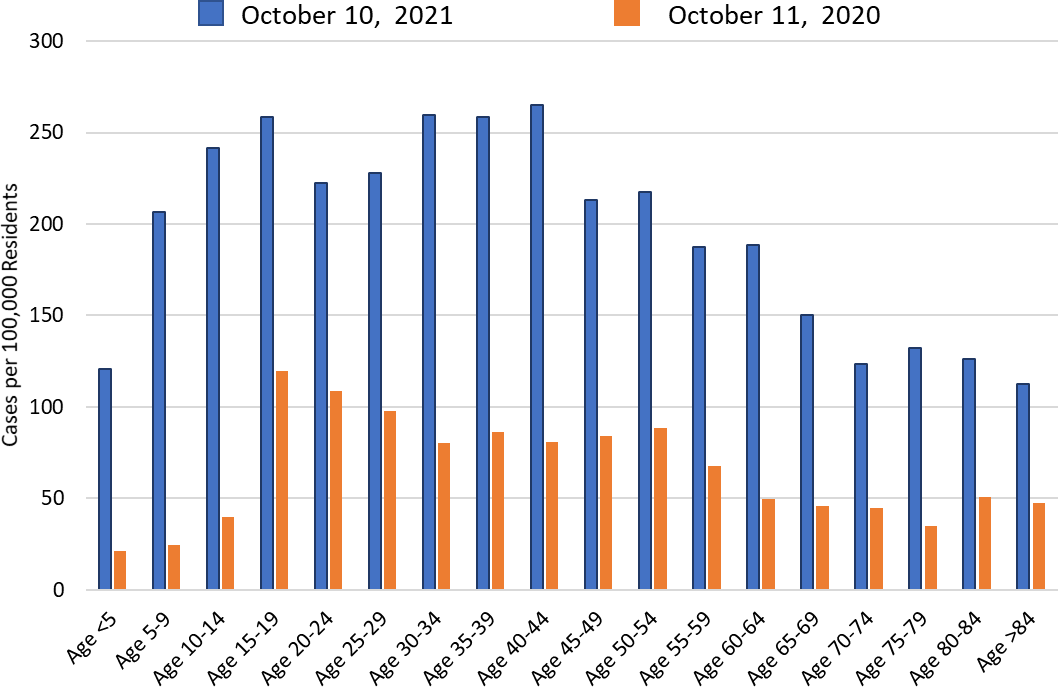
Comparing this year with last, overall community transmission remains higher this year, particularly among children (Figure 2c). Since mid-September, new case identifications on the UA COVID-19 Dashboard have declined briskly with only a small number of new daily cases being identified this past week.
|
Figure 2c. COVID-19 Cases in Arizona by Age Group Week Ending October 11, 2020 versus October 10, 2021. |
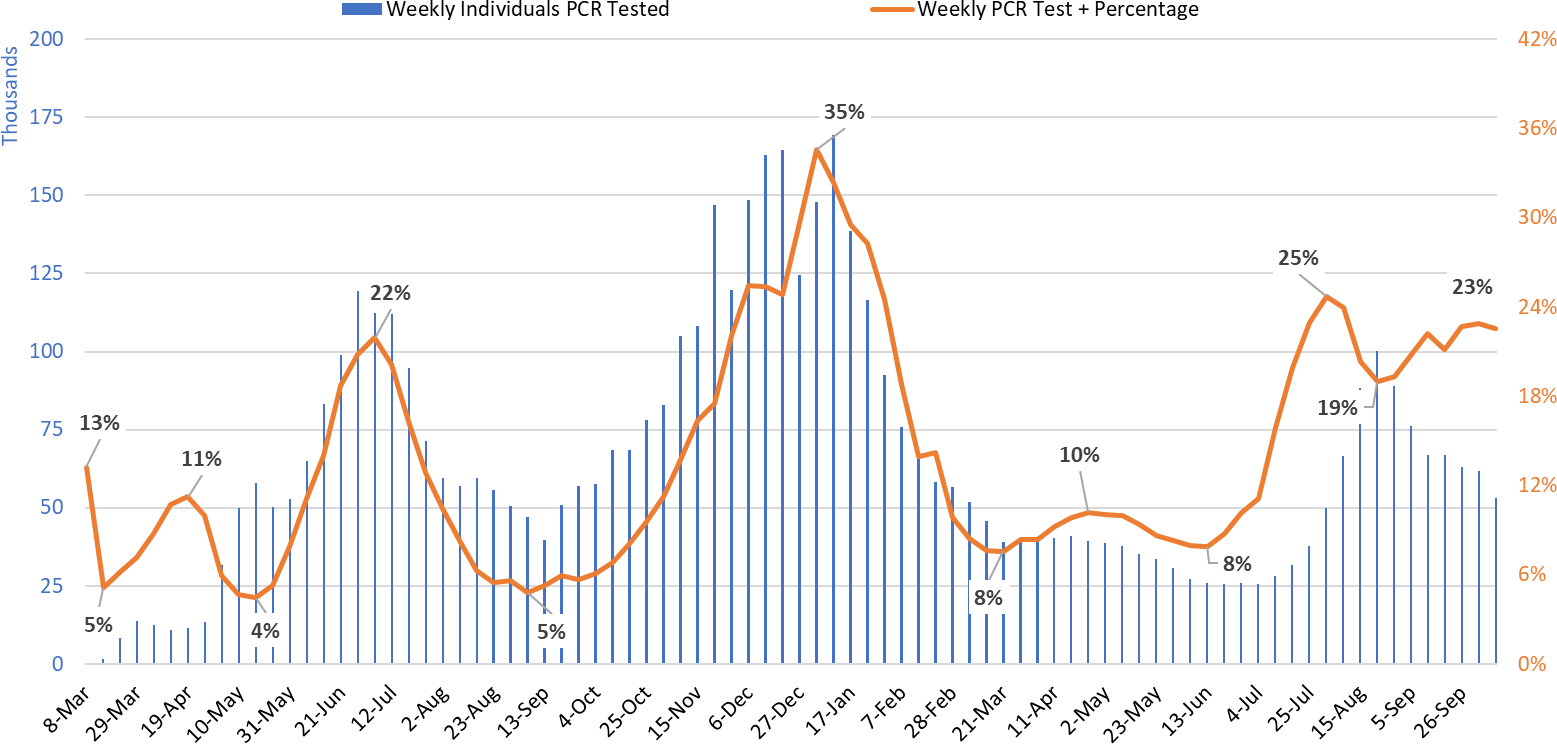
Test positivity remains at 23% this week on a smaller base of clinical tests (Figure 3). Testing is inadequate for public health practice and many cases are going undiagnosed. It is unclear how much at-home testing is supplanting clinical testing. Even so, test positivity in the clinical setting remains an important barometer of transmission.
|
Figure 3. Weekly Number of Patients Undergoing Traditional Nasopharyngeal PCR Testing and Associated Percent Positivity March 1, 2020 – October 10, 2021. |
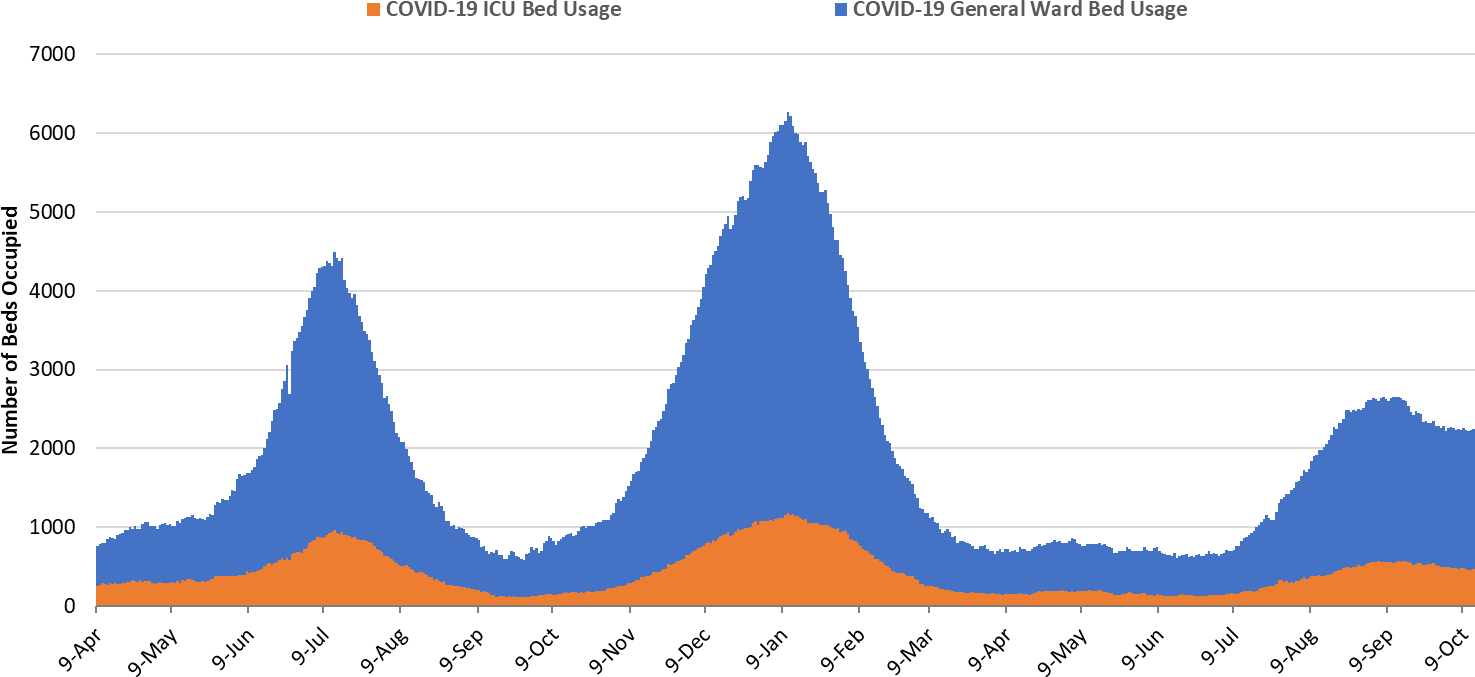
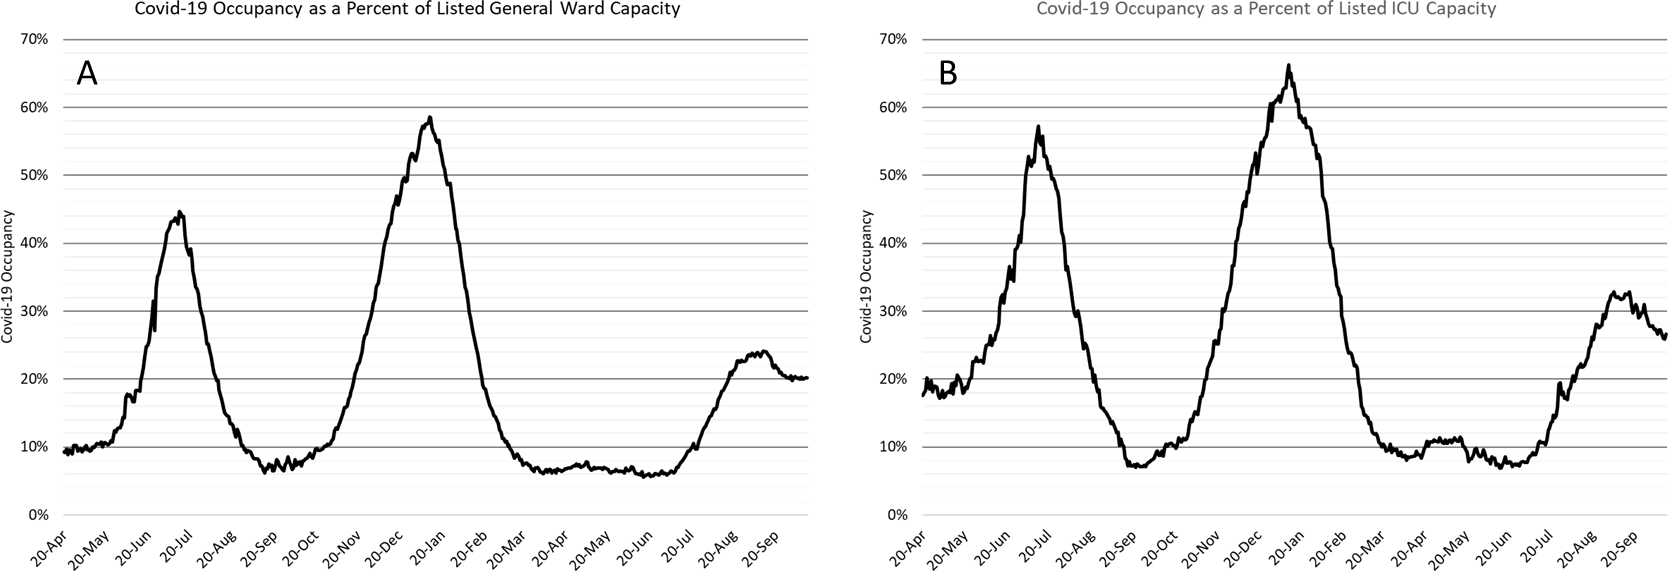
As of October 13th, 1769 (20%) of Arizona’s 8763 general ward beds were occupied by COVID-19 patients, a 0% increase from last week’s 1762 occupied beds (Figure 4 and Figure 5 Panel A). Another 674 (8%) beds remained available for use. The number of available ward beds is similar to last week’s 669 beds. Four-hundred seventy-one (471, 27%) of Arizona’s 1767 ICU beds were occupied by COVID-19 patients, a 1% decrease from last week’s 477 occupied beds (Figure 4 and Figure 5 Panel B). An additional 144 (8%) ICU beds remained available for use, slightly more than last week’s 126 beds. As a lagging indicator, hospital COVID-19 occupancy is now slowly declining, more so in the ICU than general ward.
|
Figure 4. Arizona Daily COVID-19 General Ward and ICU Census April 9, 2020 – October 13, 2021. |
While peak occupancy with this third wave never reached levels seen in the prior two, the base of the wave has the potential to be broader. For example, the summer 2020 and winter 2021 waves saw 57 and 98 days with combined ward and ICU occupancy >2000 patients, respectively. The current summer 2021 wave has so far seen 62 days with a combined occupancy >2000 patients. This persistent base of COVID-19 occupancy will have important implications for hospitals as they attempt to meet high season demands between October and February.
|
Figure 5. COVID-19 Occupancy as a Percent of Listed General Ward (A, left) and ICU (B, right) Capacity in Arizona April 20, 2020 – October 13, 2021. |
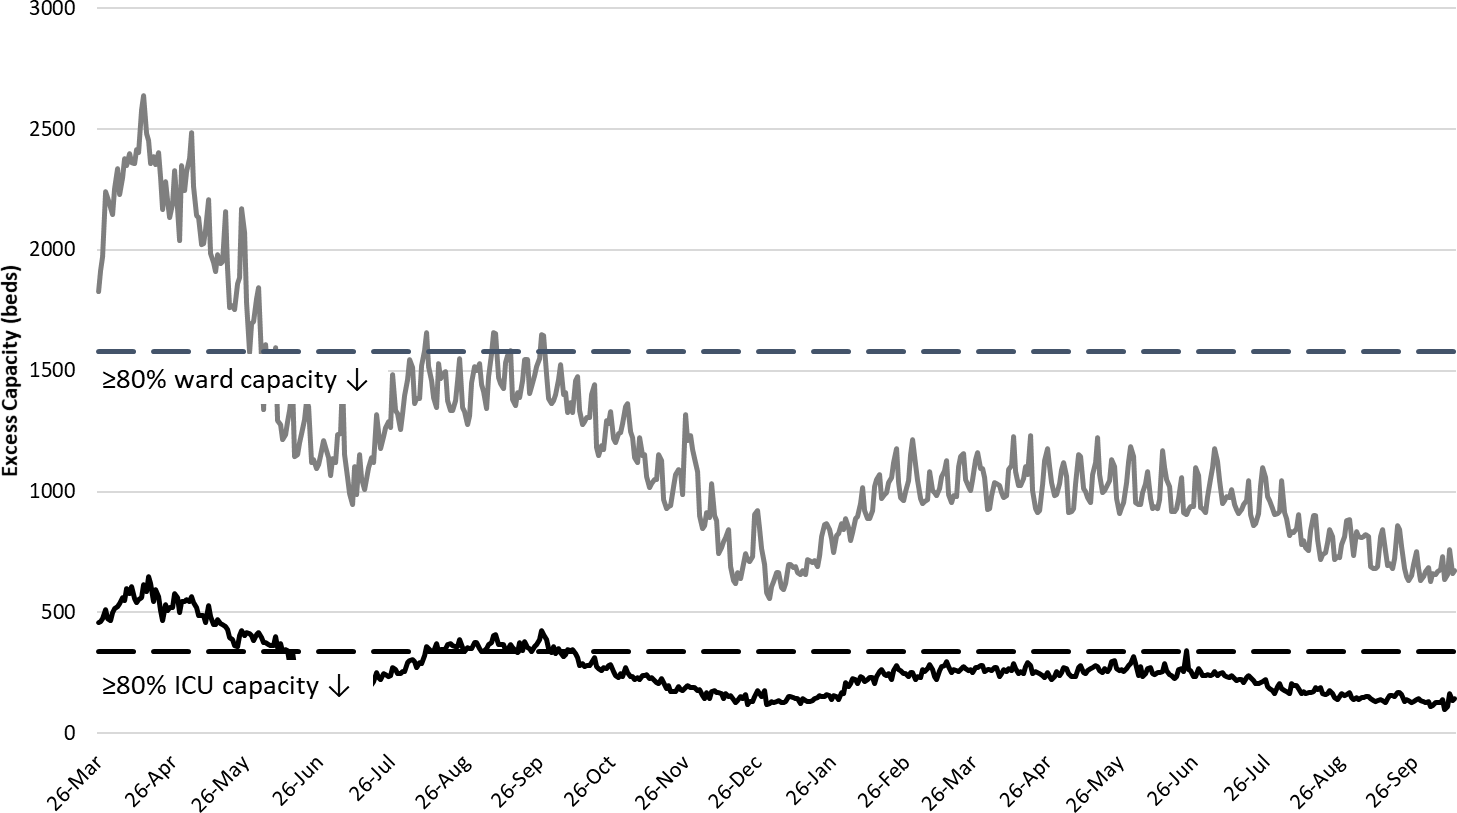
Arizona hospital occupancy remains far above seasonal levels. Safety margins, as measured by excess available beds, remain quite low (Figure 6). Because COVID-19 occupancy is improving slowly, hospitals should be prepared for >20% ward occupancy and >25% ICU occupancy for another week or two.
|
Figure 6. Observed Excess Non-Surge General Ward and ICU Capacity in Arizona March 26, 2020 – Oct 13, 2021. |
Arizona has been experiencing >200 COVID-19 deaths per week since August 22nd. The week ending September 5th has now recorded 300 deaths (Figure 7). The week ending September 12th is close behind with 281 recorded deaths. So far, at least 20500 Arizonans have lost their lives to COVID-19.
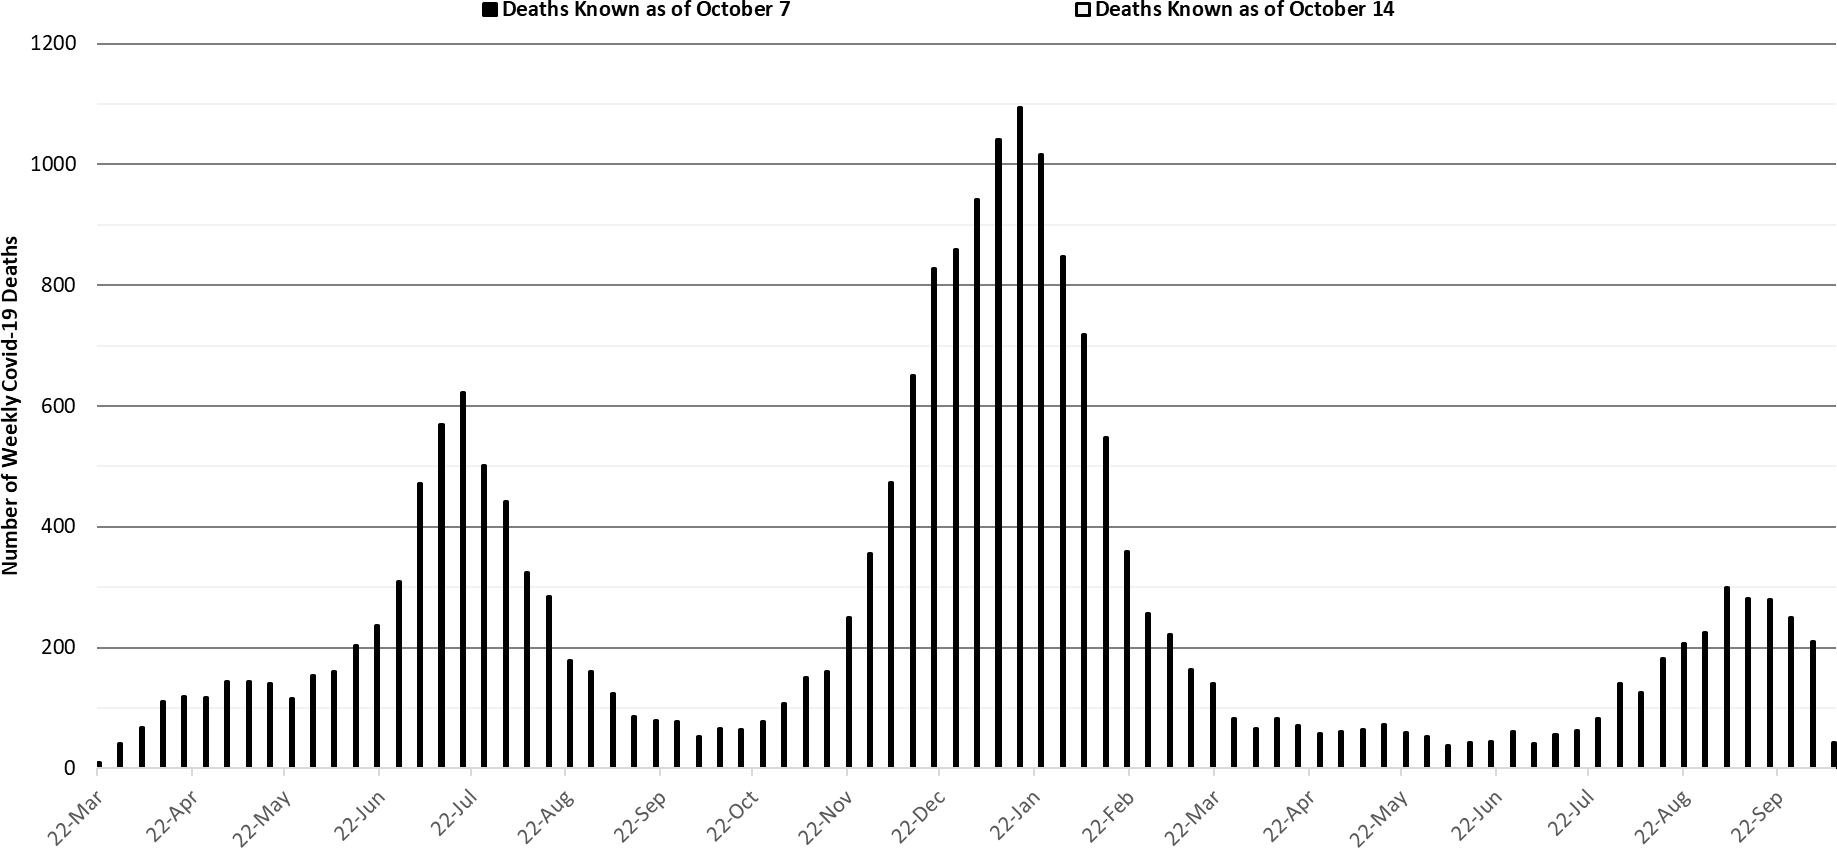
|
Figure 7. Weekly Arizona COVID-19 Deaths March 16, 2020 – October 10, 2021. |
Pima County Outlook
For the week ending October 10th, 1761 Pima County residents were diagnosed with COVID-19 a 7% decrease from last week’s initial tally (Figure 8).
|
Figure 8. Weekly COVID-19 Cases in Pima County and Number of Individuals Undergoing COVID-19 Diagnostic Testing March 1, 2020 – October 10, 2021. |
New cases are being diagnosed at a rate of 168 cases per 100K residents per week and this rate is decreasing by 16 cases per 100K residents per week. Trends across the various age groups appear in Figure 9.
|
Figure 9. COVID-19 Cases in Pima County by Age Group March 7, 2020 – October 10, 2021. |
Summary
- Arizona continues to experience high levels of community transmission with case rates modestly improving. Test positivity remains stubbornly high reminding us that test capacity, accessibility, and/or uptake is inadequate to meet public health needs. Plateauing among older, highly vaccinated groups serves as a warning that major behavioral shifts or waning immunity could result in future increases.
- As of October 10th, new cases were being diagnosed at a rate of 203 cases per 100K residents per week. The rate was decreasing by 33 cases per 100K residents per week.
- With waning vaccine efficacy and a potentially short duration of acquired immunity, the unvaccinated cannot “free ride” on high levels of community immunity. This means that persistently high levels of transmission, and more importantly hospitalizations, are possible for an extended time until the supply of unvaccinated, previously uninfected adults is exhausted.
- Vaccination remains the most important public health priority to reduce transmission and severe illness; however, mask mandates, restrictions on indoor gatherings, and targeted business mitigations are still needed to reduce/control transmission in the short-run with the primary goal being to avoid overwhelming our critical care facilities and reducing pressure for new vaccine-escape variants.
- CDC currently recommends third dose Pfizer booster shots for all 65+ years and those 50-64 at risk for severe illness. The FDA vaccine advisory panel recommended to approve similar recommendations for those vaccinated with Moderna and J&J as well. https://www.cdc.gov/coronavirus/2019-ncov/vaccines/booster-shot.html
- Third dose boosters induce similar symptoms to those of the second shot: https://www.cdc.gov/mmwr/volumes/70/wr/mm7039e4.htm?s_cid=mm7039e4_w
- Recent reports indicate that vaccine immunity to infection falls against Delta by 6 months. Because immunity against severe illness is long lasting, infections among the vaccinated will have less impact providing hope of an end-game where we can (mostly) live with SARS-CoV-2.
- https://www.thelancet.com/journals/lancet/article/PIIS0140-6736(21)02183-8/fulltext
- https://www.nejm.org/doi/full/10.1056/NEJMoa2114583
- https://www.nejm.org/doi/full/10.1056/NEJMoa2114114
- https://www.nejm.org/doi/full/10.1056/NEJMoa2110362
- https://www.thelancet.com/journals/lanres/article/PIIS2213-2600(21)00380-5/fulltext
- https://www.nejm.org/doi/full/10.1056/NEJMoa2113017
- Breakthrough infections among health care works is associated with neutralizing antibody levels. High variability among members of each group means it will be difficult to use such knowledge clinically. https://www.nejm.org/doi/full/10.1056/NEJMoa2109072
- For those residing in unvaccinated households, considerable benefit accrues if any one member becomes vaccinated. So, there is something you can do even if others remain hesitant. https://jamanetwork.com/journals/jamainternalmedicine/fullarticle/2785141
- CDC currently recommends third dose Pfizer booster shots for all 65+ years and those 50-64 at risk for severe illness. The FDA vaccine advisory panel recommended to approve similar recommendations for those vaccinated with Moderna and J&J as well. https://www.cdc.gov/coronavirus/2019-ncov/vaccines/booster-shot.html
- COVID-19 hospital occupancy is slowly improving. Nevertheless, occupancy is likely to exceed 20% of all beds in the general ward and 25% of beds in the ICU for another week or so. Access to care will remain restricted in the face of staff shortages in inpatient and outpatient settings.
- Weekly COVID-19 deaths continue to exceed 200 per week. The week ending September 5th has now recorded 300 deaths. Hopefully, this will be the first and only time during this third wave.
Forecast reports to date, available as PDFs
Download PDF to view additional charts of Arizona counties, available in appendix of report.
2020 Reports
Based on what we know now about this pandemic, we support guidelines for social distancing to slow the spread of the virus and urge everyone to follow the recommendations provided by the Centers for Disease Control and Prevention (CDC) to protect yourself, your family, your neighbors, and your employees. Please heed the recommendations as provided by the CDC.
COVID covid coronavirus virus covid19 corona forecast model