
Weekly Arizona COVID-19 Data Report – Dr. Joe Gerald, October 22
Note this forecast page is not the most recent forecast available.
View the most current forecast report
Researcher Analyzes Arizona COVID-19 Spread Models for Decision-Makers
The following information regarding the spread of COVID-19 in Arizona was prepared by Joe Gerald, MD, PhD, a researcher at the Mel and Enid Zuckerman College of Public Health (MEZCOPH) at the University of Arizona. This information has also been reviewed by other MEZCOPH faculty.
This data were obtained from the Arizona Department of Health Services COVID-19 webpage and reflect conditions in Arizona as of October 22, 2021.
This information is intended to help guide our response to the outbreak. It is not intended to predict how this pandemic will evolve. Rather, this model extrapolates what might occur if current conditions remain unchanged. As regional authorities and healthcare providers respond, their actions are expected to mitigate the worst consequences of this pandemic.

COVID-19 Disease Outbreak Forecast
Arizona State and Pima County
Updated October 22, 2021
Disclaimer: This information represents my personal views and not those of The University of Arizona, the Zuckerman College of Public Health, or any other government entity. Any opinions, forecasts, or recommendations should be considered in conjunction with other corroborating and conflicting data. Updates can be accessed at https://publichealth.arizona.edu/news/2021/covid-19-forecast-model.
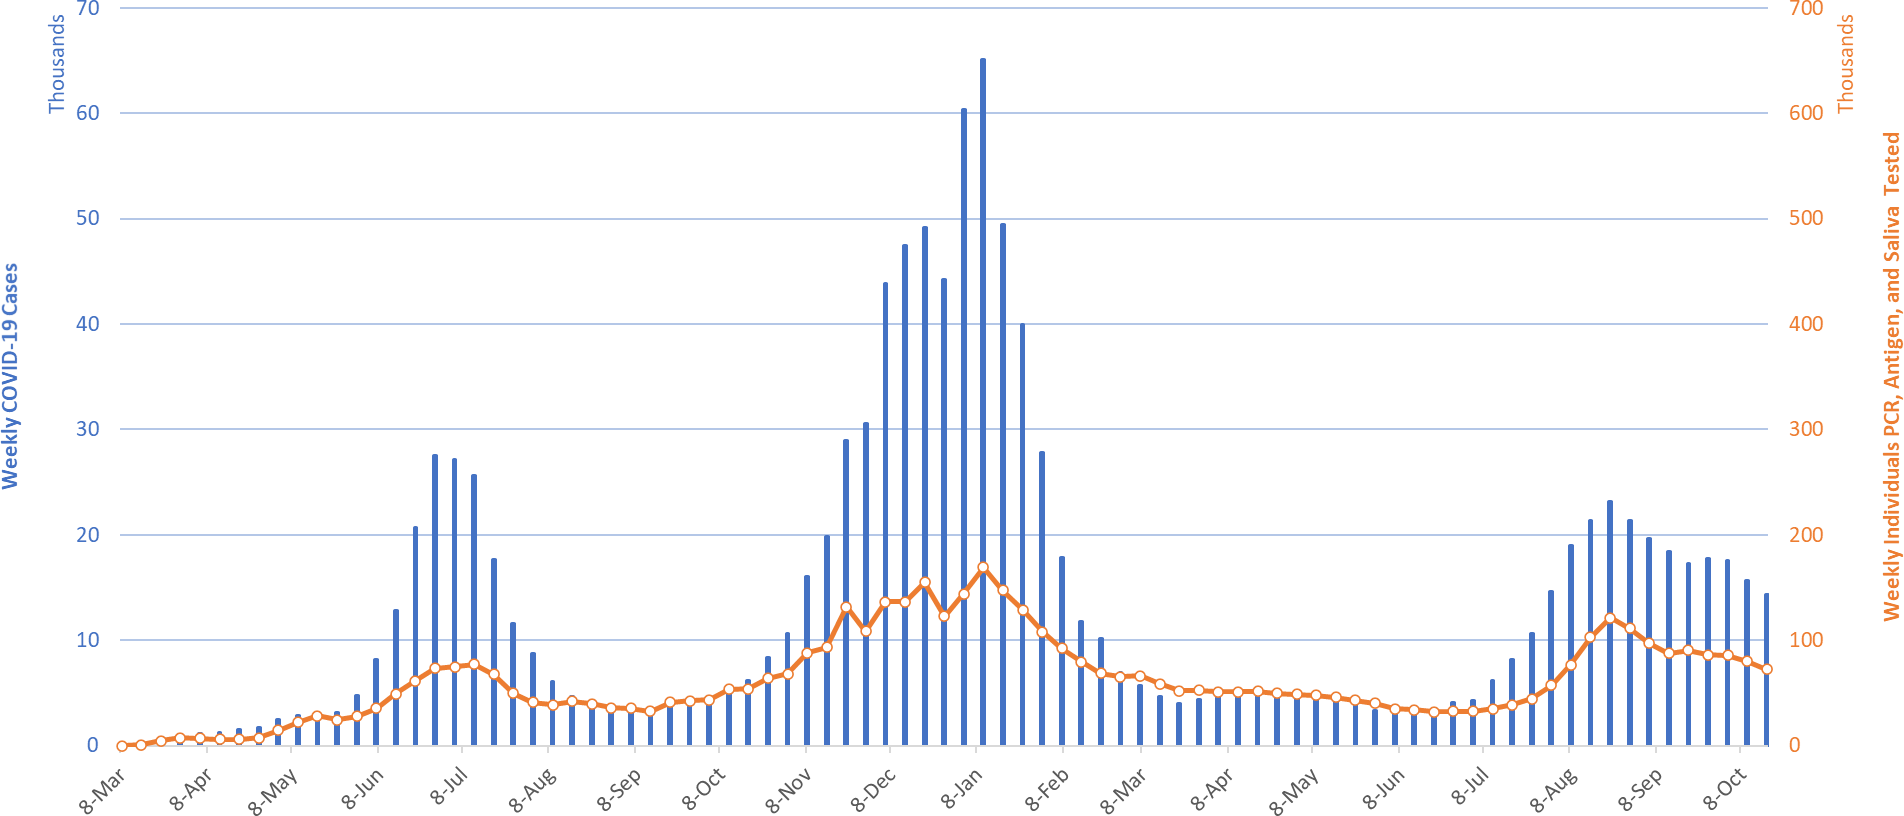
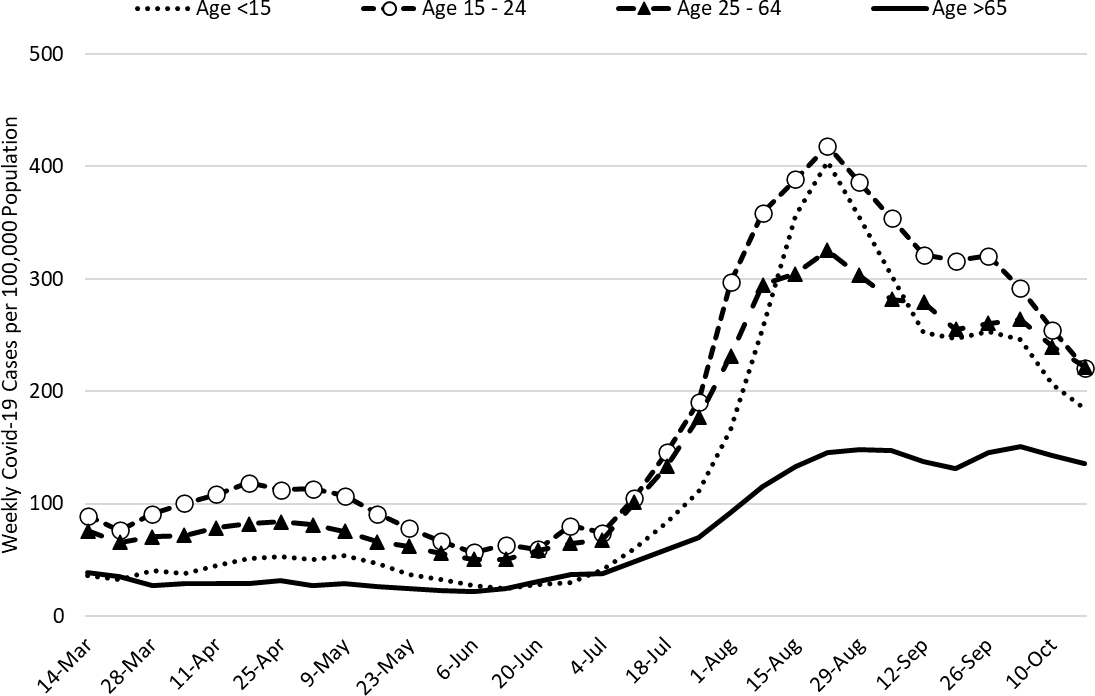
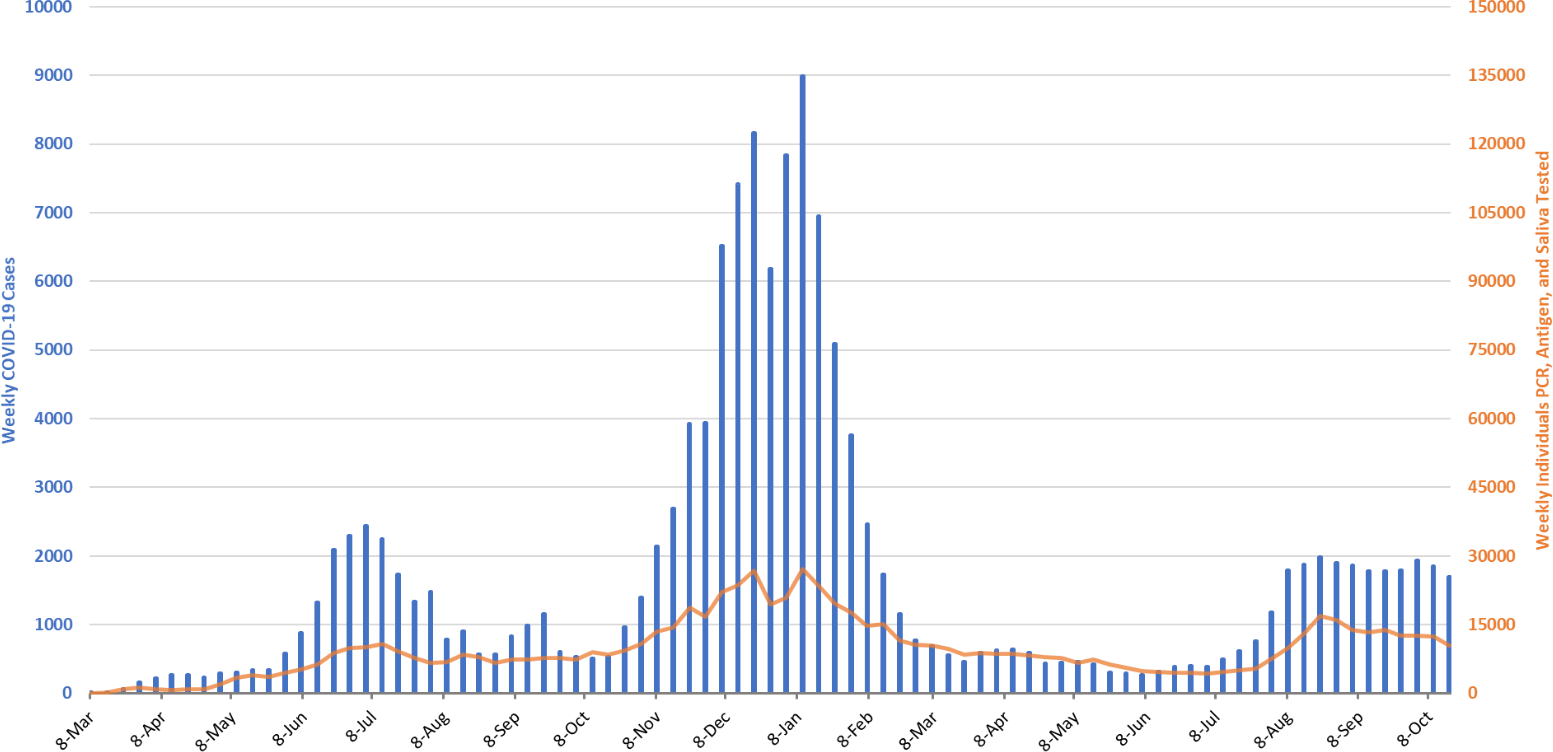
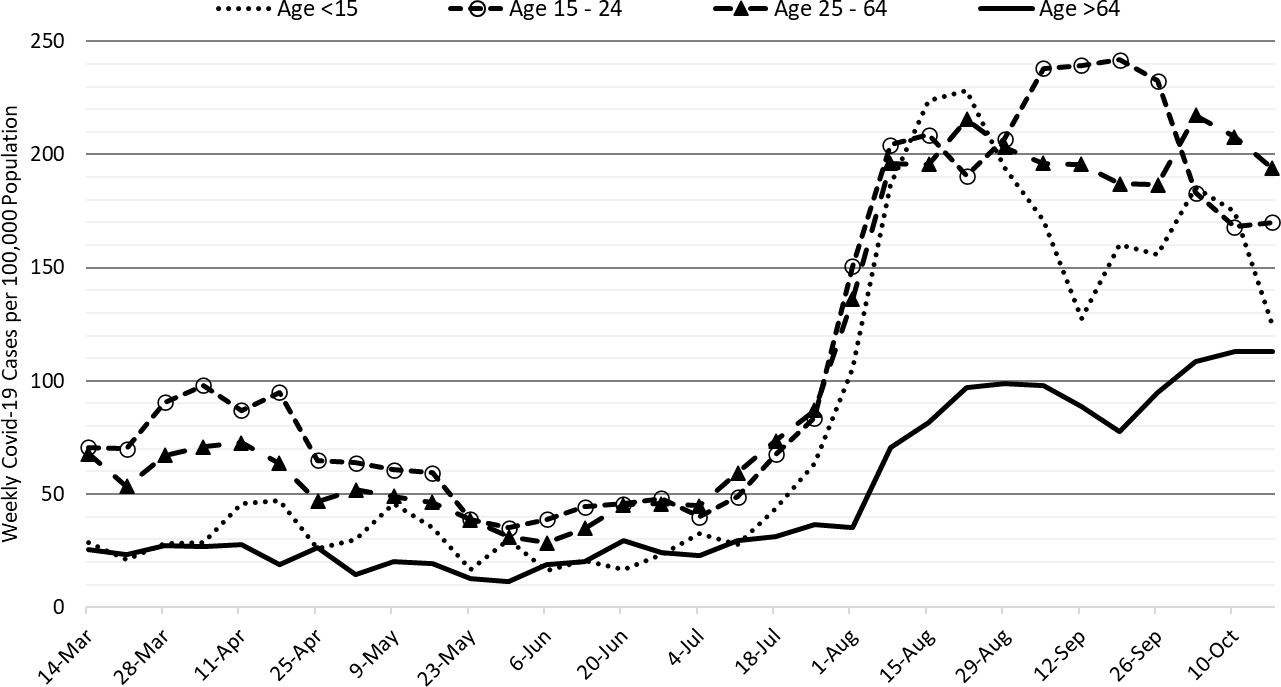
For the week ending October 17th, 14338 Arizonans were diagnosed with COVID-19, a 9% decrease from last week’s revised tally (Figure 1). Over the past week, 896 cases were added to last week’s initial tally of 14791 cases, a large revision by recent standards. While last week’s report painted a more optimistic assessment than reality, case counts continue to decline. The current case rate, 197 cases per 100K residents per week, is decreasing by 19 cases per 100K residents per week. In a bit of a change, rates among those 25 – 64 and 15 – 24 years are now tied, 222 versus 221 cases per 100K residents, respectively (Figure 2a following page). Rates among those 65+ years trail all other age groups at 136 cases per 100K residents per week.
|
Figure 1. Weekly COVID-19 Cases in Arizona and Number of Individuals Undergoing COVID-19 Diagnostic Testing March 1, 2020 – October 17, 2021. |
Redundant, but still true → Arizona continues to experience a high number of cases, hospitalizations, and deaths. With waning vaccine efficacy and a potentially short duration of acquired immunity, herd immunity is not achievable. As winter approaches, more previously vaccinated and previously infected individuals will become susceptible. While these individuals will remain protected from severe outcomes, they will contribute to community transmission. Unvaccinated Arizonans will not be able to avoid infection by “free riding” on high levels of community immunity. The decision to remain unvaccinated carries a much greater risk than getting vaccinated does. Hopefully, Merck’s new antiviral molnupiravir will be available before the end of the year.
Arizona’s new case rate ranks 21st out of 50 states. The nation’s leaders remain Alaska (757), Montana (558), Wyoming (518), Idaho (461), and North Dakota (439). According to the CDC, 63% of Arizona’s adult population is fully vaccinated and another 9% have received one dose. Only 15% of Arizonans 65+ years have received a booster, placing us 38th overall (not so good). This week the FDA and CDC endorsed new booster recommendations with broader and more consistent guidance for eligibility and endorsing a “mix and match” strategy among the 3 vaccines.” The ADHS Vaccine Dashboard shows weekly doses delivered locally fell to 78K doses, many of which are third dose boosters.
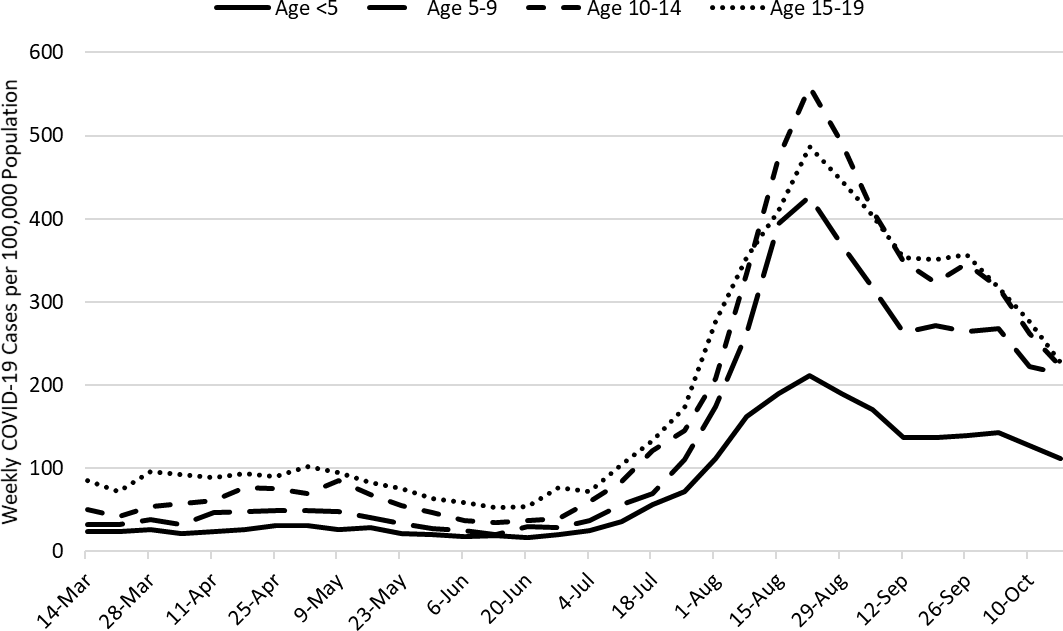
Figure 2a shows continued improvements among children and adults except for those 65+ years which remain stubbornly elevated despite high levels of vaccination among this group. Among school-age children, transmission continues to decline (Figure 2b). ASU, MCDPH, and PCHD researchers recently provided strong evidence supporting K – 12 mask mandates; Arizona schools without mandates had 3.5 times the odds of a school outbreak (95%CI 1.8 – 6.9) as compared to those with a mandate. The Arizona Supreme Court is expected hear oral arguments on the State’s prohibition of school mask mandates during the first week of November. A new, small, pre-Delta study of households with school employees or school children provides interesting data on well-defined transmission chains.
|
Figure 2a. COVID-19 Cases in Arizona by Age Group March 7 – October 17, 2021. |
|
Figure 2b. COVID-19 Cases in Arizona among Children by Age Group March 7 – October 17, 2021. |
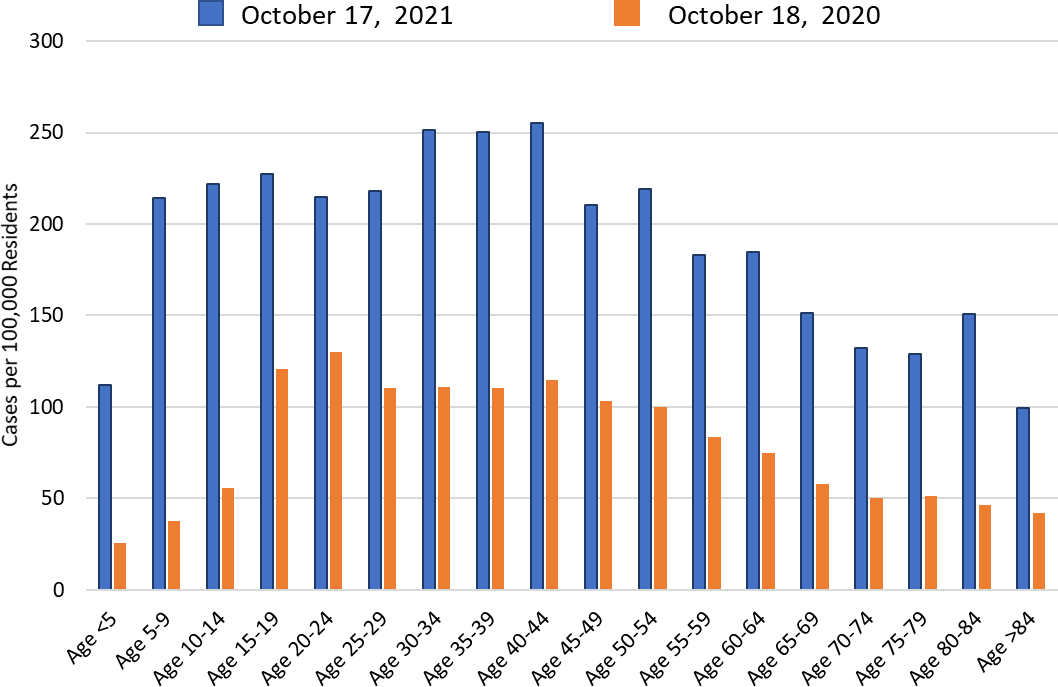
Despite the knowledge and ability to do better, absolute rates of community transmission remain higher this year than last among all age groups but particularly among children (Figure 2c). If there is any good news it is that the trajectories are quite different with improvements being observed this year while rates were worsening this time last year. Hopefully, our paths should intersect some time in November.
|
Figure 2c. COVID-19 Cases in Arizona by Age Group Week Ending October 18, 2020 versus October 17, 2021. |
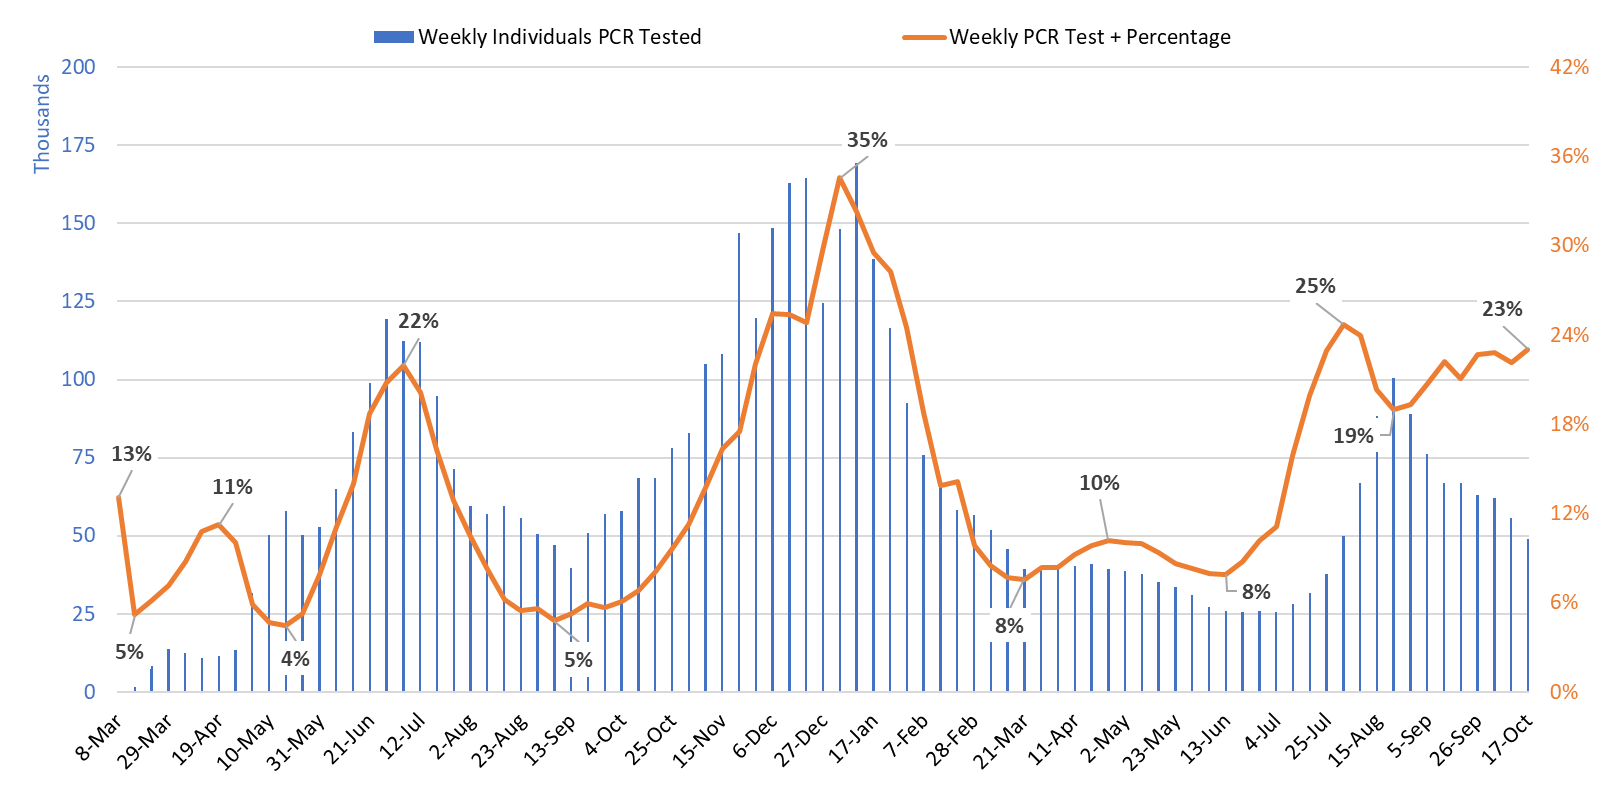
Test positivity, at 23%, continues to edge up on a smaller base of clinical tests (Figure 3). Testing is inadequate for public health practice and many cases are going undiagnosed. The trend since the peak in early August has been radically different from the resolution of the past 2 waves which saw consistently declining positivity. Not sure what explains the difference or what significance to attach to it.
|
Figure 3. Weekly Number of Patients Undergoing Traditional Nasopharyngeal PCR Testing and Associated Percent Positivity March 1, 2020 – October 17, 2021. |
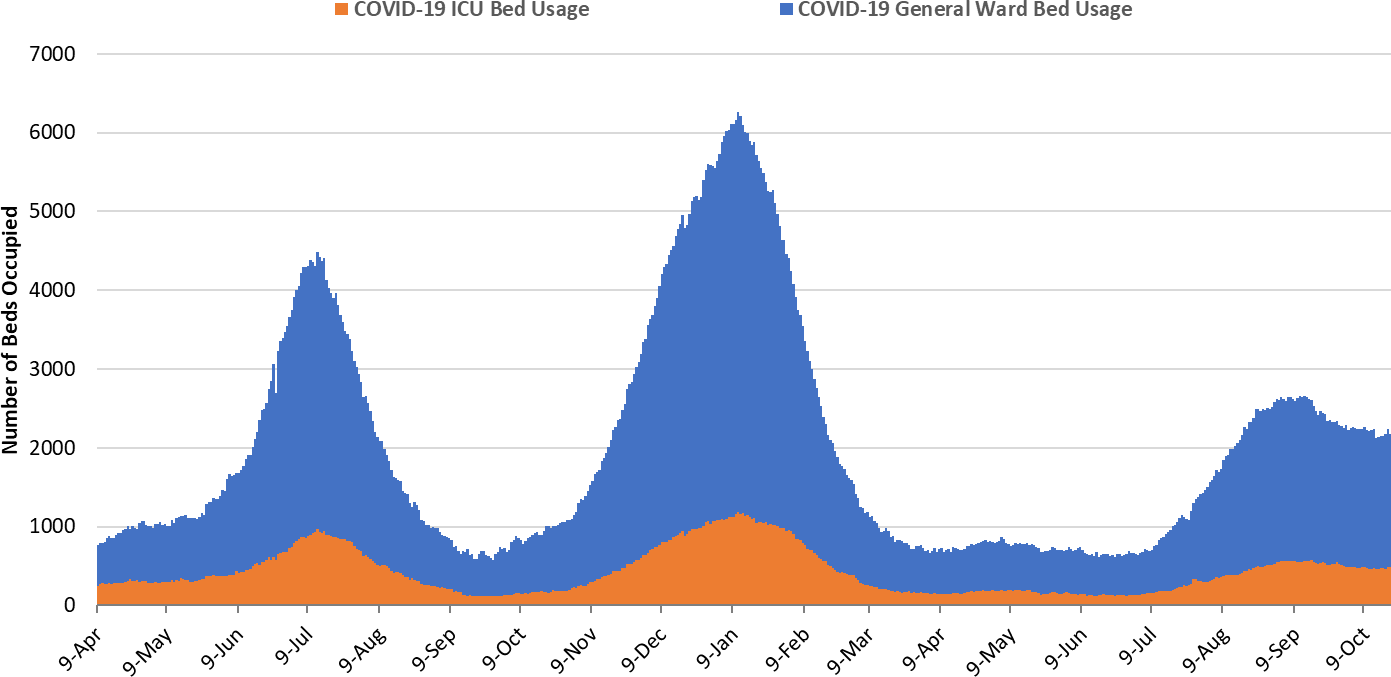
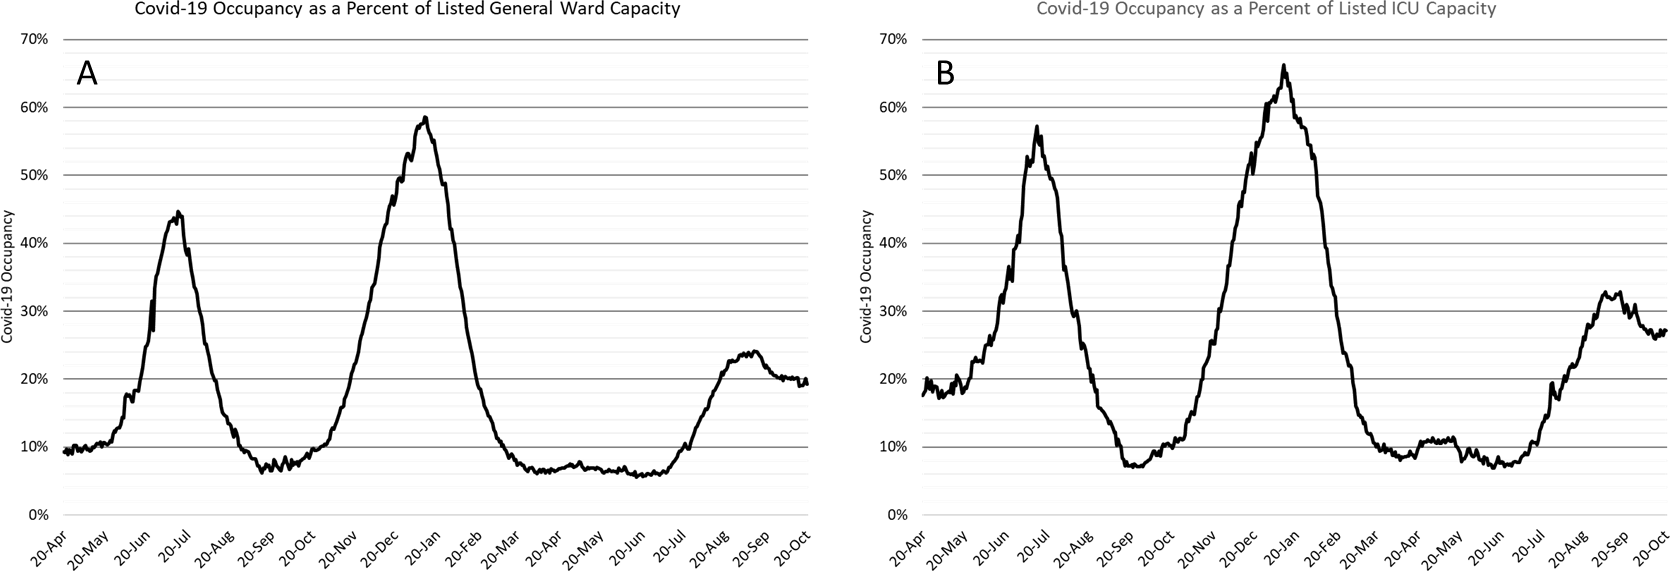
As of October 20th, 1688 (19%) of Arizona’s 8754 general ward beds were occupied by COVID-19 patients, a 5% decrease from last week’s 1769 occupied beds (Figure 4 and Figure 5 Panel A). Another 695 (8%) beds remained available for use. The number of available ward beds is higher than last week’s 674 beds. Four- hundred eighty-two (482, 27%) of Arizona’s 1774 ICU beds were occupied by COVID-19 patients, a 2% increase from last week’s 471 occupied beds (Figure 4 and Figure 5 Panel B). An additional 142 (8%) ICU beds remained available for use, similar to last week’s 144 beds.
|
Figure 4. Arizona Daily COVID-19 General Ward and ICU Census April 9, 2020 – October 20, 2021. |
While peak occupancy with this third wave never reached levels seen in the prior two, the base of the wave has the potential to be broader. For example, the summer 2020 and winter 2021 waves saw 57 and 98 days with combined ward and ICU occupancy >2000 patients, respectively. So far, this current wave has seen 69 days with a combined occupancy >2000 patients. This persistent base of COVID-19 occupancy will have important implications for hospitals as they attempt to meet high season demands until February.
|
Figure 5. COVID-19 Occupancy as a Percent of Listed General Ward (A, left) and ICU (B, right) Capacity in Arizona April 20, 2020 – October 20, 2021. |
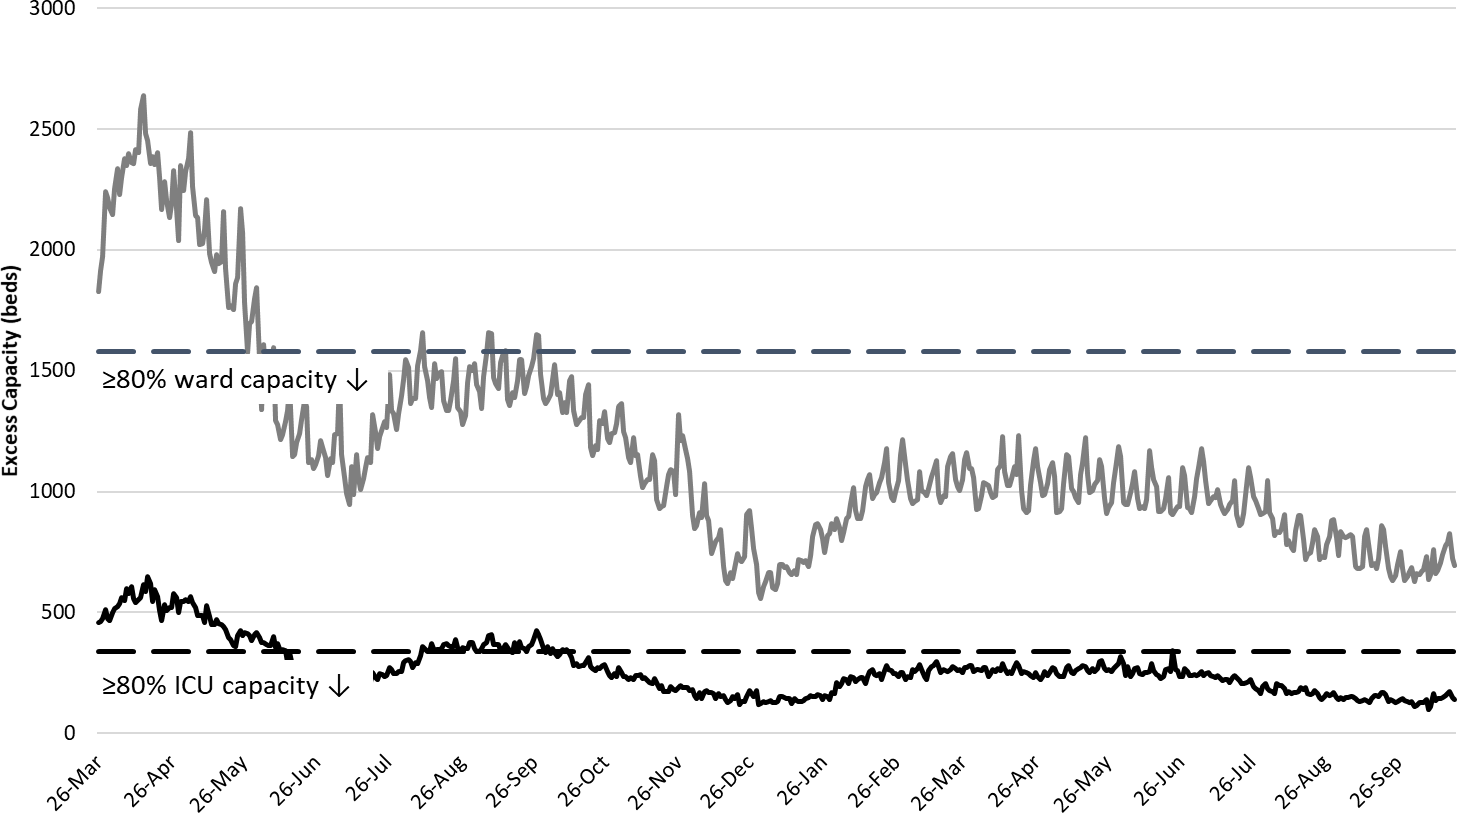
Arizona hospital occupancy remains far above seasonal levels. Safety margins, as measured by excess available beds, remain quite low (Figure 6). Because COVID-19 occupancy is improving slowly, hospitals should be prepared for 15 - 20% ward occupancy and 20 - 25% ICU occupancy for some time.
|
Figure 6. Observed Excess Non-Surge General Ward and ICU Capacity in Arizona March 26, 2020 – Oct 20, 2021. |
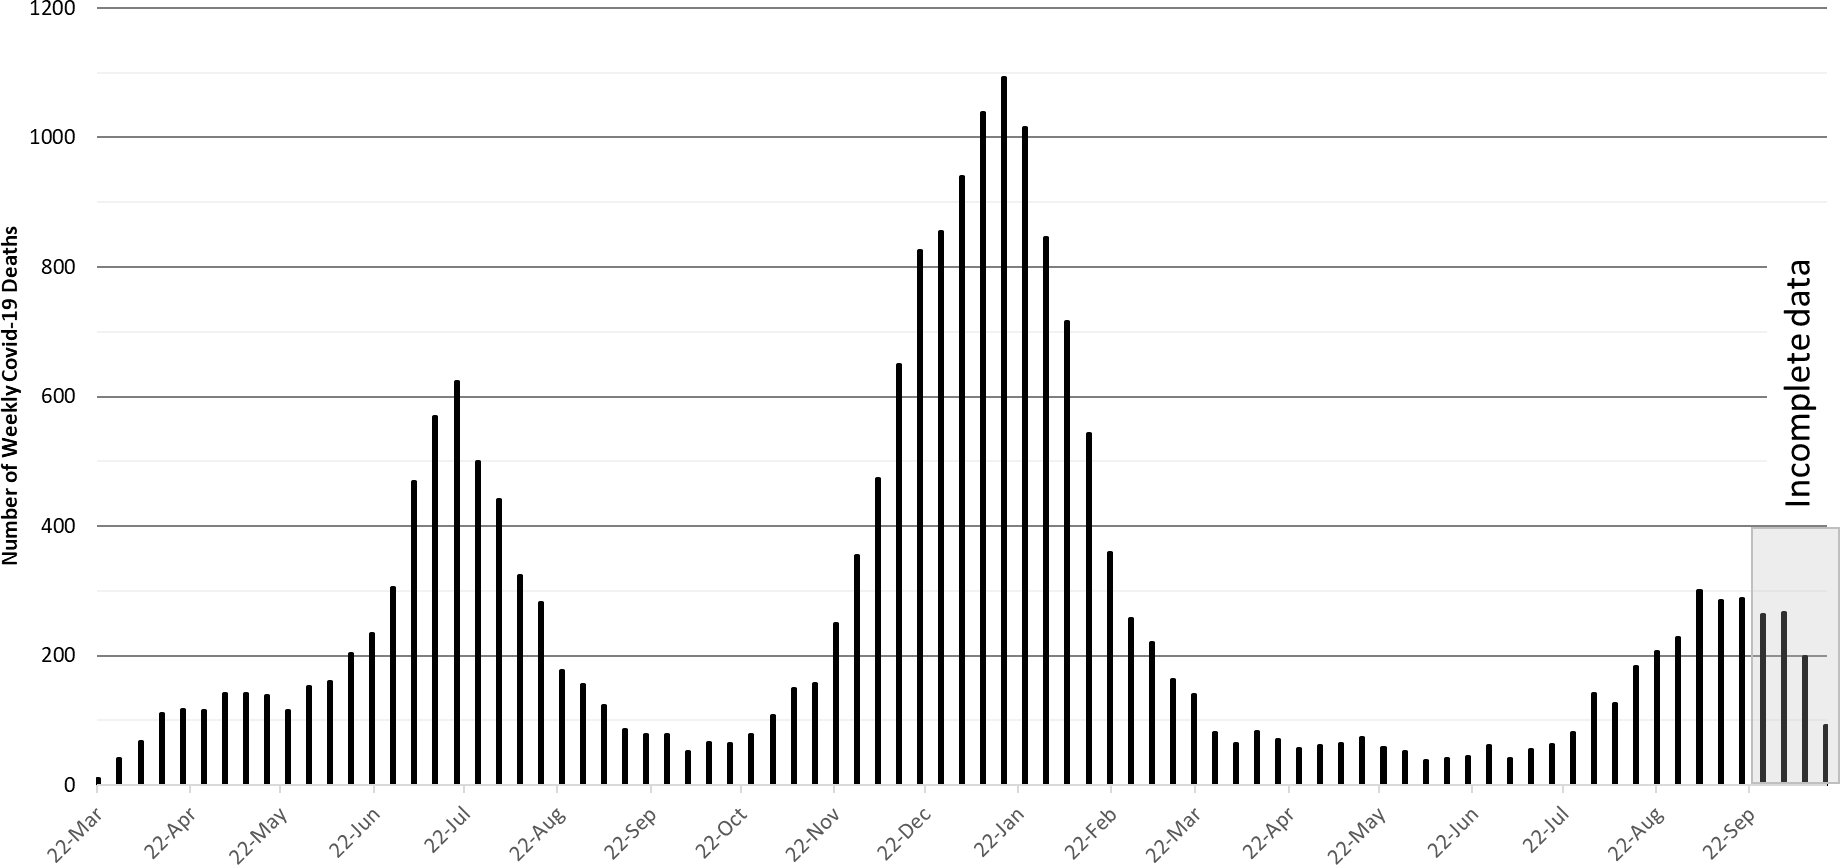
Arizona has been experiencing >200 COVID-19 deaths per week since August 22nd. The week ending September 5th has now recorded 300 deaths (Figure 7). The weeks ending September 12th and 19th are close behind with 286 and 289 deaths, respectively. At least 20850 Arizonans have lost their lives to COVID-19.
|
Figure 7. Weekly Arizona COVID-19 Deaths March 16, 2020 – October 17, 2021. |
Pima County Outlook
For the week ending October 17th, 1695 Pima County residents were diagnosed with COVID-19 a 4% decrease from last week’s initial tally (Figure 8).
|
Figure 8. Weekly COVID-19 Cases in Pima County and Number of Individuals Undergoing COVID-19 Diagnostic Testing March 1, 2020 – October 17, 2021. |
New cases are being diagnosed at a rate of 162 cases per 100K residents per week and this rate is decreasing by 15 cases per 100K residents per week. Trends across the various age groups appear in Figure 9.
|
Figure 9. COVID-19 Cases in Pima County by Age Group March 7, 2020 – October 17, 2021. |
Summary
- Arizona continues to experience high levels of community transmission with case rates modestly improving. Test positivity remains stubbornly high reminding us that test capacity, accessibility, and/or uptake is inadequate to meet public health needs. Plateauing among older, highly vaccinated groups serves as a warning that major behavioral shifts or waning immunity could result in future increases.
- As of October 17th, new cases were being diagnosed at a rate of 197 cases per 100K residents per week. The rate was decreasing by 19 cases per 100K residents per week. For some reason, data backfill is once again an issue making it more difficult to assess trends in real-time.
- With waning vaccine efficacy and a potentially short duration of acquired immunity, the unvaccinated cannot “free ride” on high levels of community immunity. This means that persistently high levels of transmission, and more importantly hospitalizations, are possible for an extended time until the supply of unvaccinated, previously uninfected adults is exhausted.
- A shout-out to my colleague, Kate Ellingson, PhD, with her first-authored paper in the JAMA Health Forum on preliminary results from the AZ-HEROES study of COVID-19 infection among health care workers, first responders, and essential workers in Arizona. A lot of UA folks in the author list. Short-story, first responders (fire/EMS, police, corrections) experienced a higher burden of infections than health care workers or essential workers.
- Vaccination remains the most important public health priority to reduce transmission and severe illness; however, mask mandates, restrictions on indoor gatherings, and targeted business mitigations are still needed to reduce/control transmission in the short-run with the primary goal being to avoid overwhelming our critical care facilities and reducing pressure for new vaccine-escape variants.
- The FDA/CDC now recommends booster shots for all 3 vaccine brands; they have also broadened the language for booster eligibility.
- For those residing in unvaccinated households, considerable benefit accrues if any one member becomes vaccinated. So, there is something you can do (get vaccinated) even if others remain hesitant.
- COVID-19 hospital occupancy is slowly improving. Nevertheless, occupancy is likely to exceed 15% of all beds in the general ward and 20% of beds in the ICU for weeks to come. Access to care will remain restricted in the face of staff shortages in inpatient and outpatient settings.
- Weekly COVID-19 deaths continue to exceed 200 per week. The week ending September 5th has now recorded 300 deaths. Hopefully, this will be the first and only time during this third wave.
- Check out an updated COVID-19 Mortality in Arizona report sponsored by the Arizona Public Health Association. Not a pretty picture any way you look at it. COVID-19 mortality surpassed the two historical leaders, cardiovascular disease and cancer. Comparisons with Washington and Colorado reinforce the narrative that it didn’t have to be. Public policy matters!!
Forecast reports to date, available as PDFs
Download PDF to view additional charts of Arizona counties, available in appendix of report.
2020 Reports
Based on what we know now about this pandemic, we support guidelines for social distancing to slow the spread of the virus and urge everyone to follow the recommendations provided by the Centers for Disease Control and Prevention (CDC) to protect yourself, your family, your neighbors, and your employees. Please heed the recommendations as provided by the CDC.
COVID covid coronavirus virus covid19 corona forecast model