
Weekly Arizona COVID-19 Data Report – February 18
Note this forecast page is not the most recent forecast available.
View the most current forecast report
Researcher Analyzes Arizona COVID-19 Spread Models for Decision-Makers
The following information regarding the spread of COVID-19 in Arizona was prepared by Joe Gerald, MD, PhD, a researcher at the Mel and Enid Zuckerman College of Public Health (MEZCOPH) at the University of Arizona. This information has also been reviewed by other MEZCOPH faculty.
This data were obtained from the Arizona Department of Health Services COVID-19 webpage and reflect conditions in Arizona as of February 18, 2022.
This information is intended to help guide our response to the outbreak. It is not intended to predict how this pandemic will evolve. Rather, this model extrapolates what might occur if current conditions remain unchanged. As regional authorities and healthcare providers respond, their actions are expected to mitigate the worst consequences of this pandemic.

COVID-19 Disease Outbreak Forecast
Arizona State and Pima County
Updated February 18, 2022
Disclaimer: This information represents my personal views and not those of The University of Arizona, the Zuckerman College of Public Health, or any other government entity. Any opinions, forecasts, or recommendations should be considered in conjunction with other corroborating and conflicting data. Updates can be accessed at https://publichealth.arizona.edu/news/2021/covid-19-forecast-model.
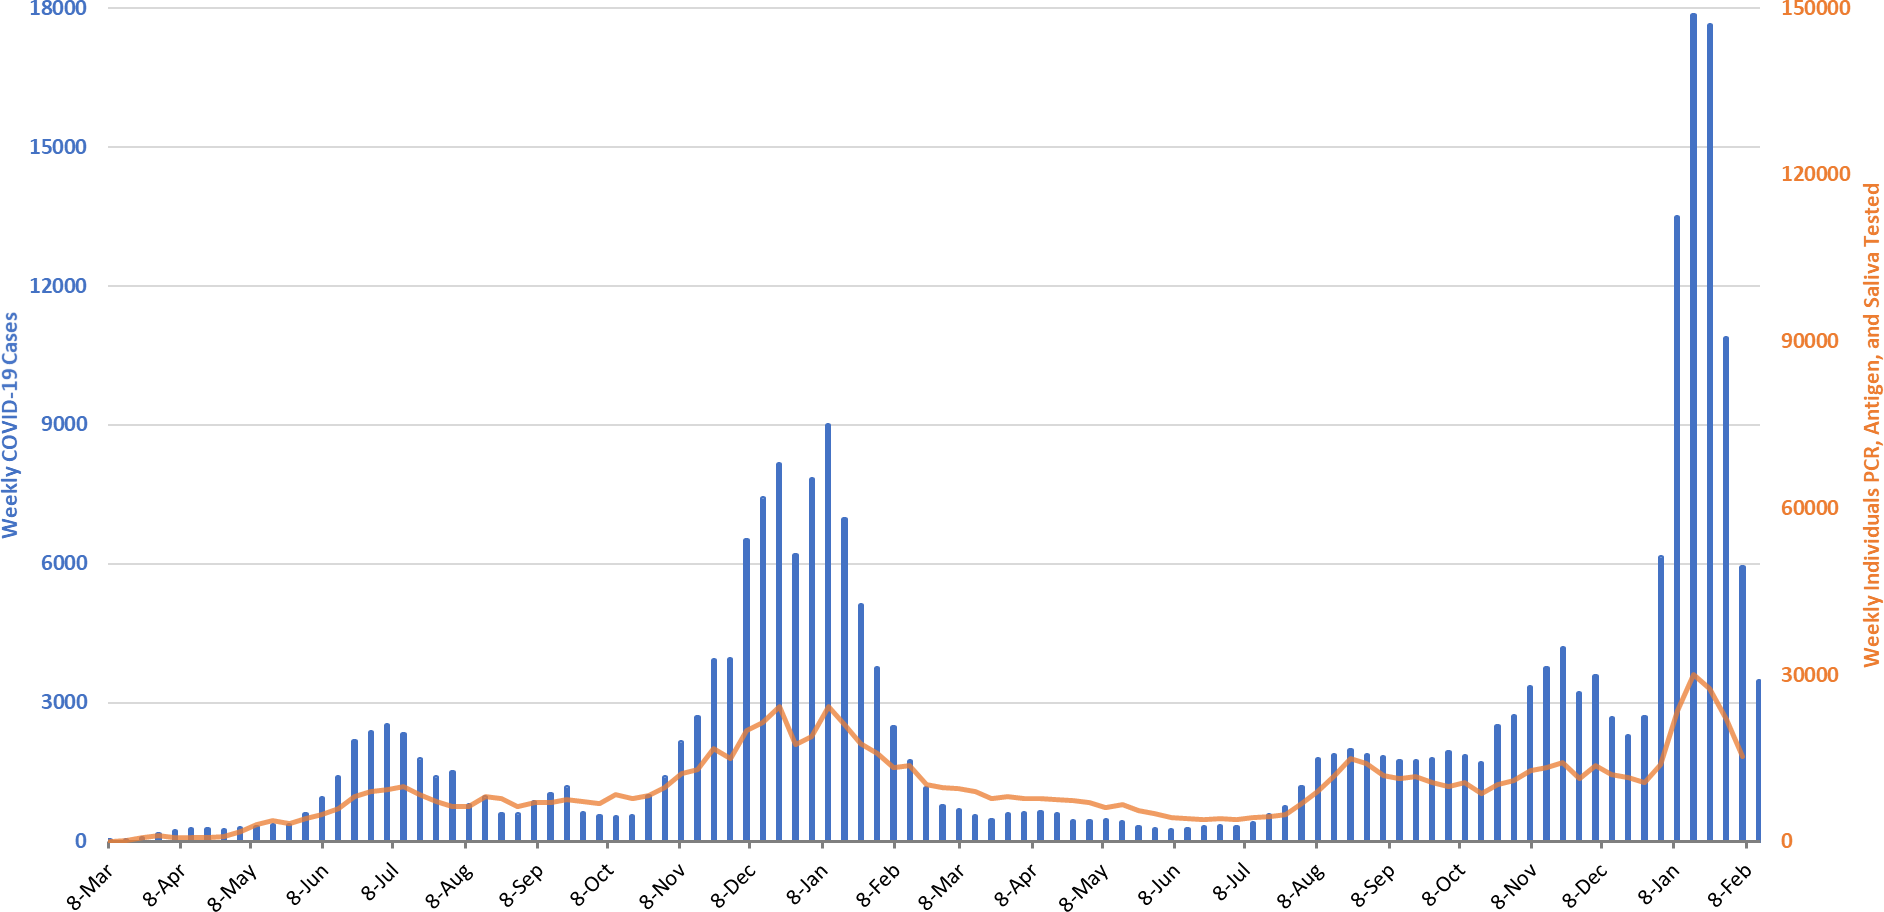
Figure 1. Weekly COVID-19 Cases in Arizona and Number of Individuals Undergoing COVID-19 Diagnostic Testing March 1, 2020 – February 13, 2022.
For the week ending February 13th, at least 21842 Arizonans were diagnosed with COVID-19, a 46% decrease from the 40267 cases reported the prior week (Figure 1). This week’s tally is now smaller than the June 2020 peak (28009 cases). Arizona’s new case ranking fell to 18th place with the nation’s leaders being Alaska (615), Idaho (608), West Virginia (552), Kentucky (519), and Montana (486). Because the risk of contracting Omicron remains high, it is still too soon for institutions and/or individuals to safely relax their mitigation practices.
Cases are currently being diagnosed at a rate of at 300 cases per 100K residents per week. Omicron peaked statewide about January 15th at 2026 cases per 100K residents per week. The CDC threshold demarcating high levels of transmission is 100 cases per 100K residents per week. If current trends hold, the state should fall below this threshold the first or second week of March. In a reversal this week, rates are now highest among those >65 years and lowest among those 15 years, 334 and 232 cases per 100K residents, respectively (Figure 2a following page).
According to the CDC, 42% of Arizona adults and 58% of its seniors have obtained a third dose booster. The ADHS Vaccine Dashboard shows weekly doses delivered fell to 65K doses indicating progress is grinding to a halt. The CDC recommends everyone ≥12 years who received Pfizer primary sequence should receive a booster; ≥18 years if they received the Moderna primary sequence. Disappointingly, Pfizer postponed its FDA request for approval in children 6 months – 5 years to await data on third dose efficacy.
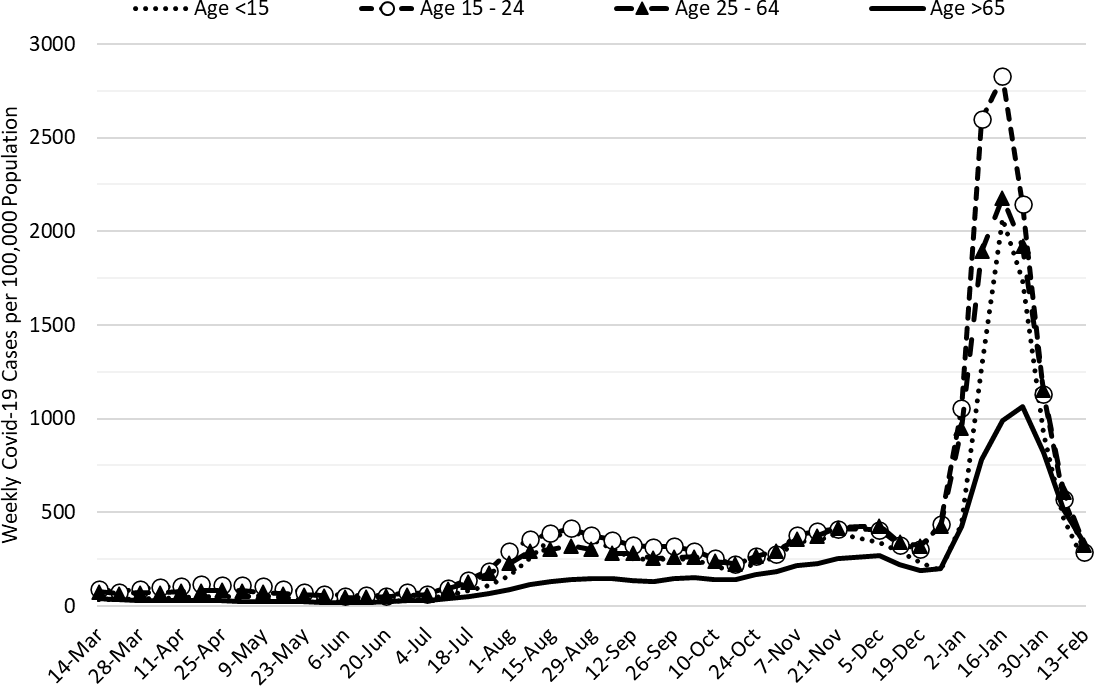
Figure 2a. COVID-19 Cases in Arizona by Age Group March 7, 2021 – February 13, 2022 (Data from week ending November 28 suppressed).
Figure 2a shows transmission among all age groups is decreasing with relatively little separation among age groups.
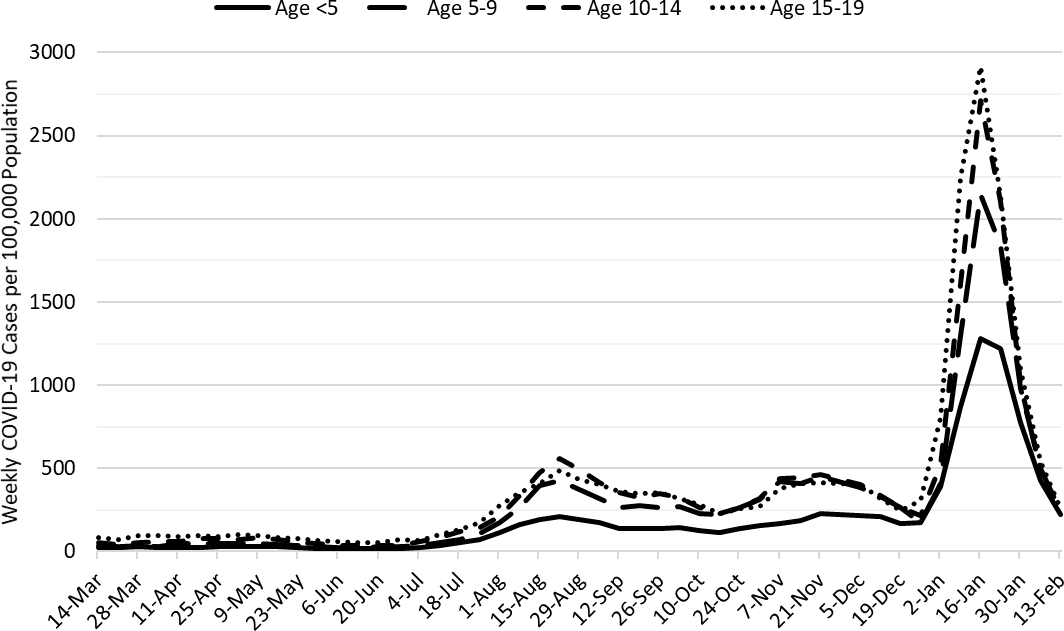
Figure 2b. COVID-19 Weekly Incidence in Arizona among children March 7, 2021 – February 13, 2022.
Figure 2b shows that transmission among children is also declining across all age groups.
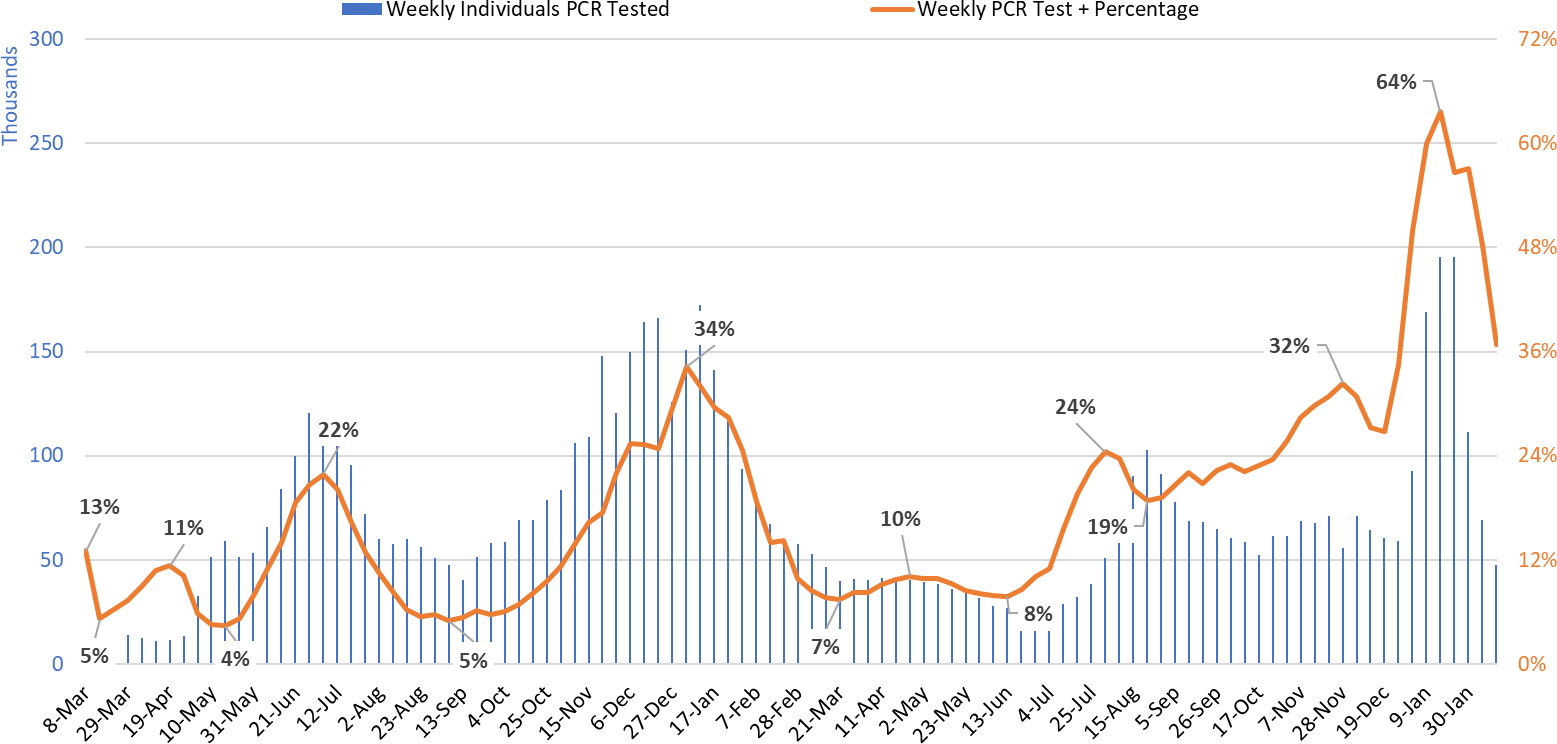
Figure 3. Weekly Number of Patients Undergoing Traditional Nasopharyngeal PCR Testing and Associated Percent Positivity March 1, 2020 – February 13, 2022.
Test positivity fell again this week but remains high at 37% (Figure 3).
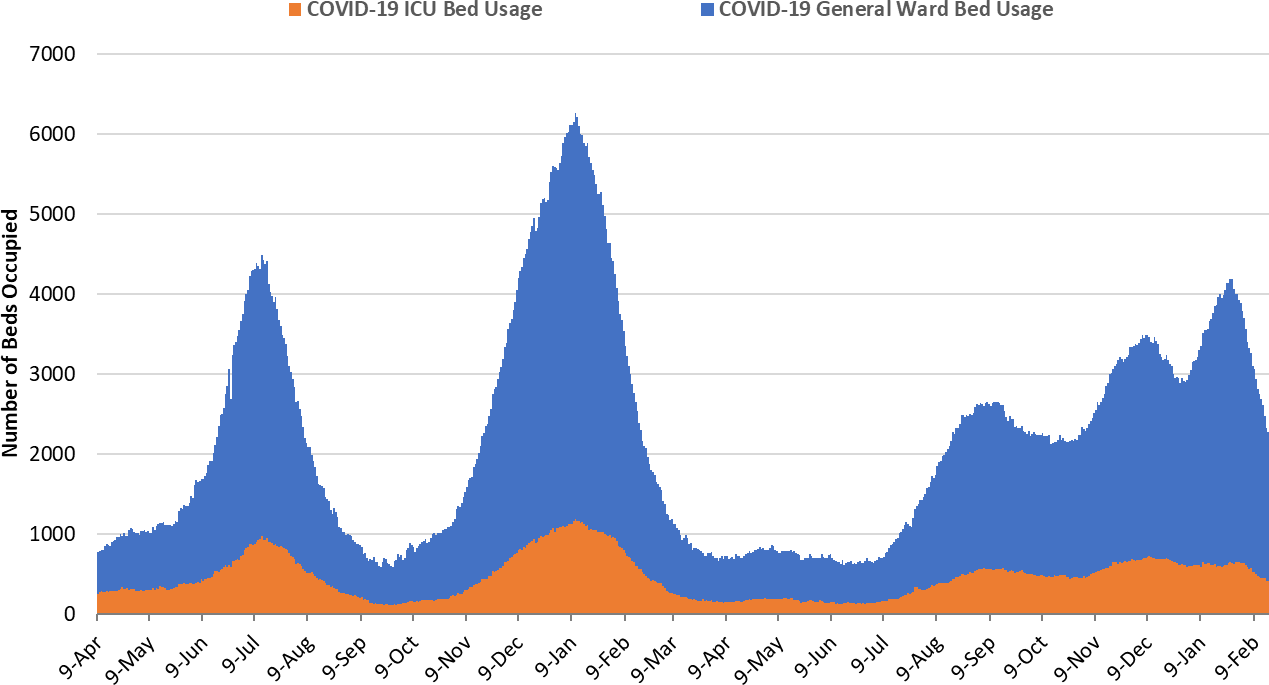
Figure 4. Arizona Daily COVID-19 General Ward and ICU Census April 9, 2020 – February 17, 2022.
As of February 17th, 1867 (21%) of Arizona’s 8767 general ward beds were occupied by COVID-19 patients, a 23% decrease from last week’s 2436 occupied beds (Figure 4 and Figure 5 Panel A). Another 535 (6%) beds remained available for use which is lower than last week’s 604 available beds. Four-hundred seven (407, 25%) of Arizona’s 1643 ICU beds were occupied by COVID-19 patients, an 18% decrease from last week’s 499 occupied beds (Figure 4 and Figure 5 Panel B). An additional 149 (9%) ICU beds remained available for use which is higher than last week’s 137 beds.
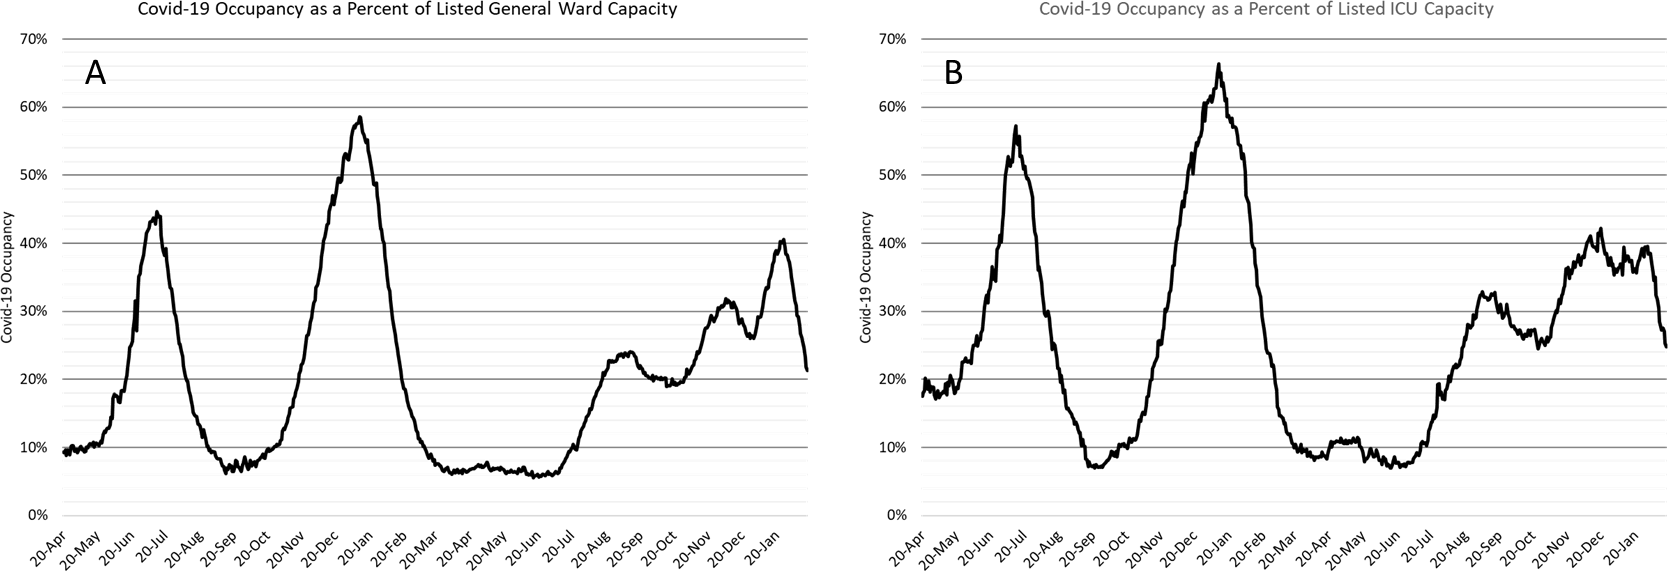
Figure 5. COVID-19 Occupancy as a Percent of Listed General Ward (A, left) and ICU (B, right) Capacity in Arizona April 20, 2020 – February 17, 2022.
Hospital occupancy remains below 3000 combined occupancy but hospitals remain very busy. They have now experienced 188 consecutive days with a combined occupancy >2000 patients whereas the summer 2020 and winter 2021 saw 57 and 98 days, respectively. We experienced 75 days with >3000 combined occupancy with the Delta/Omicron waves whereas the summer 2020 and winter 2021 waves saw 35 and 78 days, respectively.
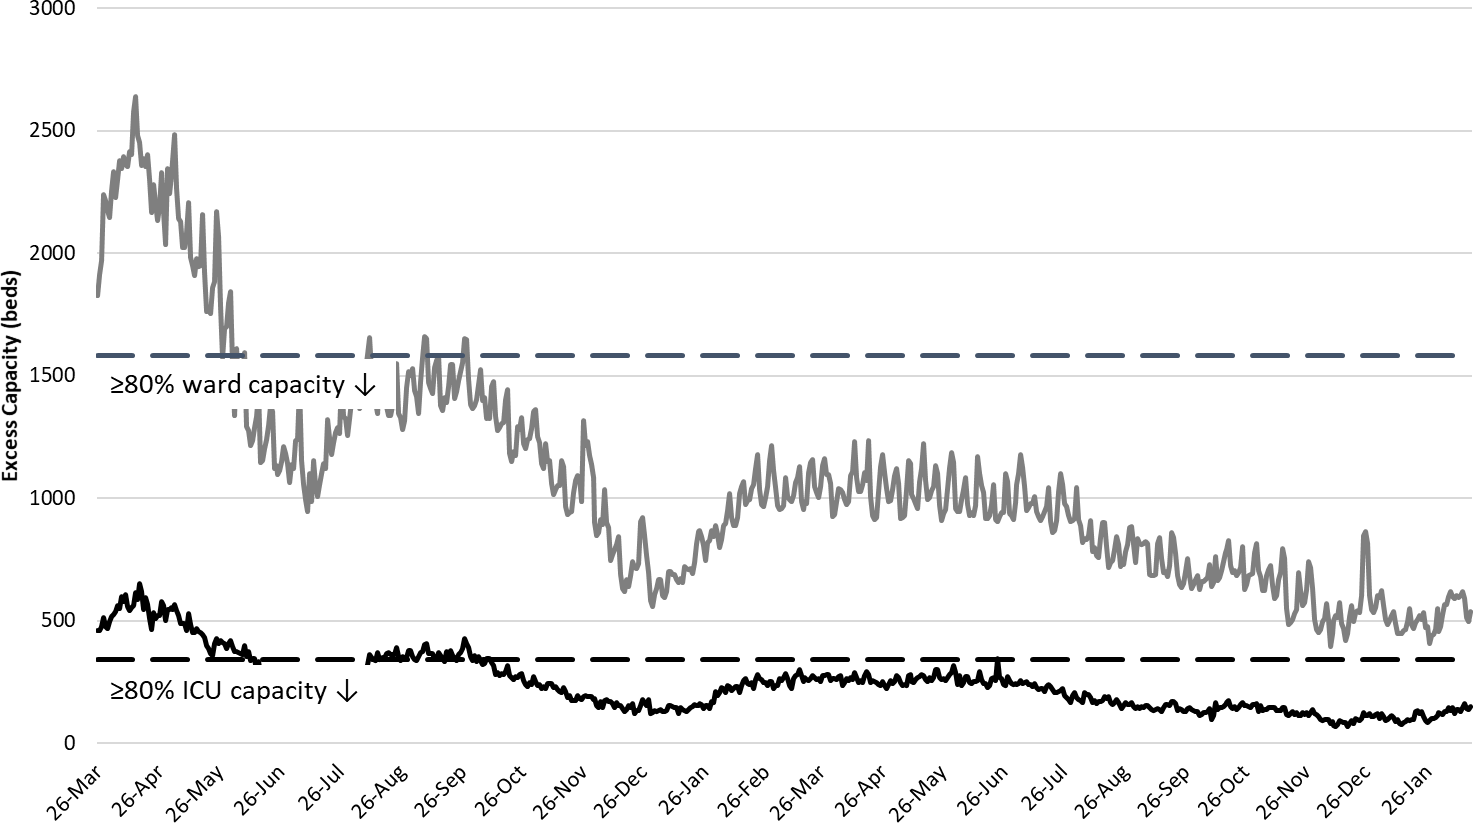
Figure 6. Observed Excess Non-Surge General Ward and ICU Capacity in Arizona Mar 26, 2020 – Feb 17, 2022.
Hospital occupancy remains far above seasonal levels with safety margins, as measured by available beds, remaining near historical lows (Figure 6).
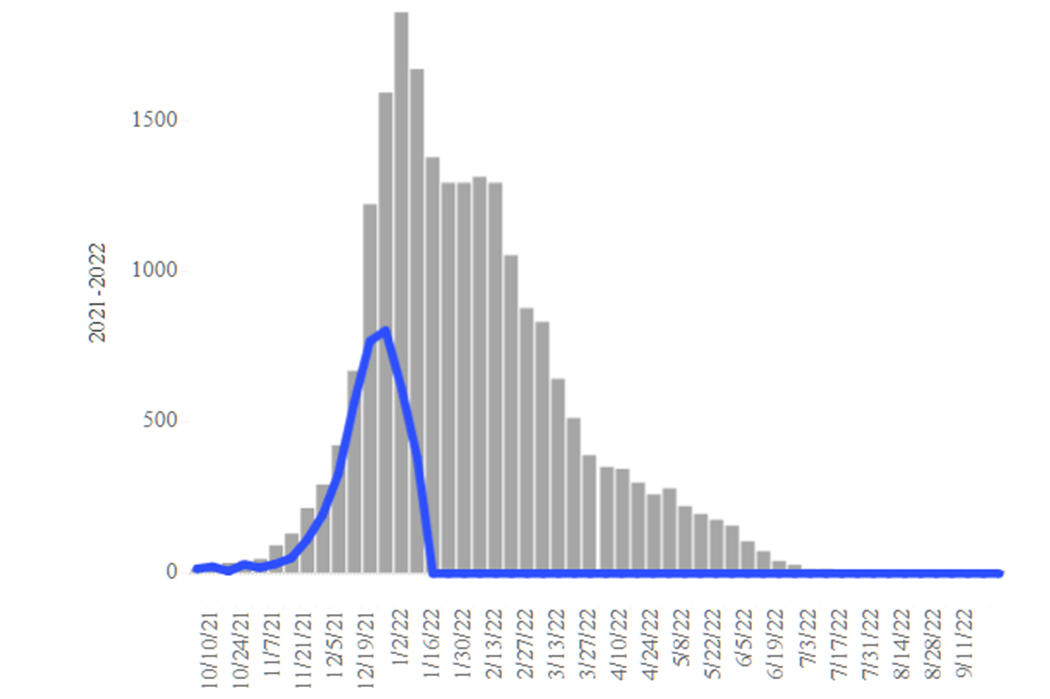
Figure 7. Arizona Influenza Cases in 2021 (blue) versus 5-Year Historical Average (grey)
Seasonal influenza cases in Arizona (blue line) may be experiencing a bit of a second wind. Even so, rates remain below the state’s 5-year historical average (grey bars, Figure 7). Hospitals should get further relief from fewer COVID-19 and fewer influenza cases over the coming weeks.
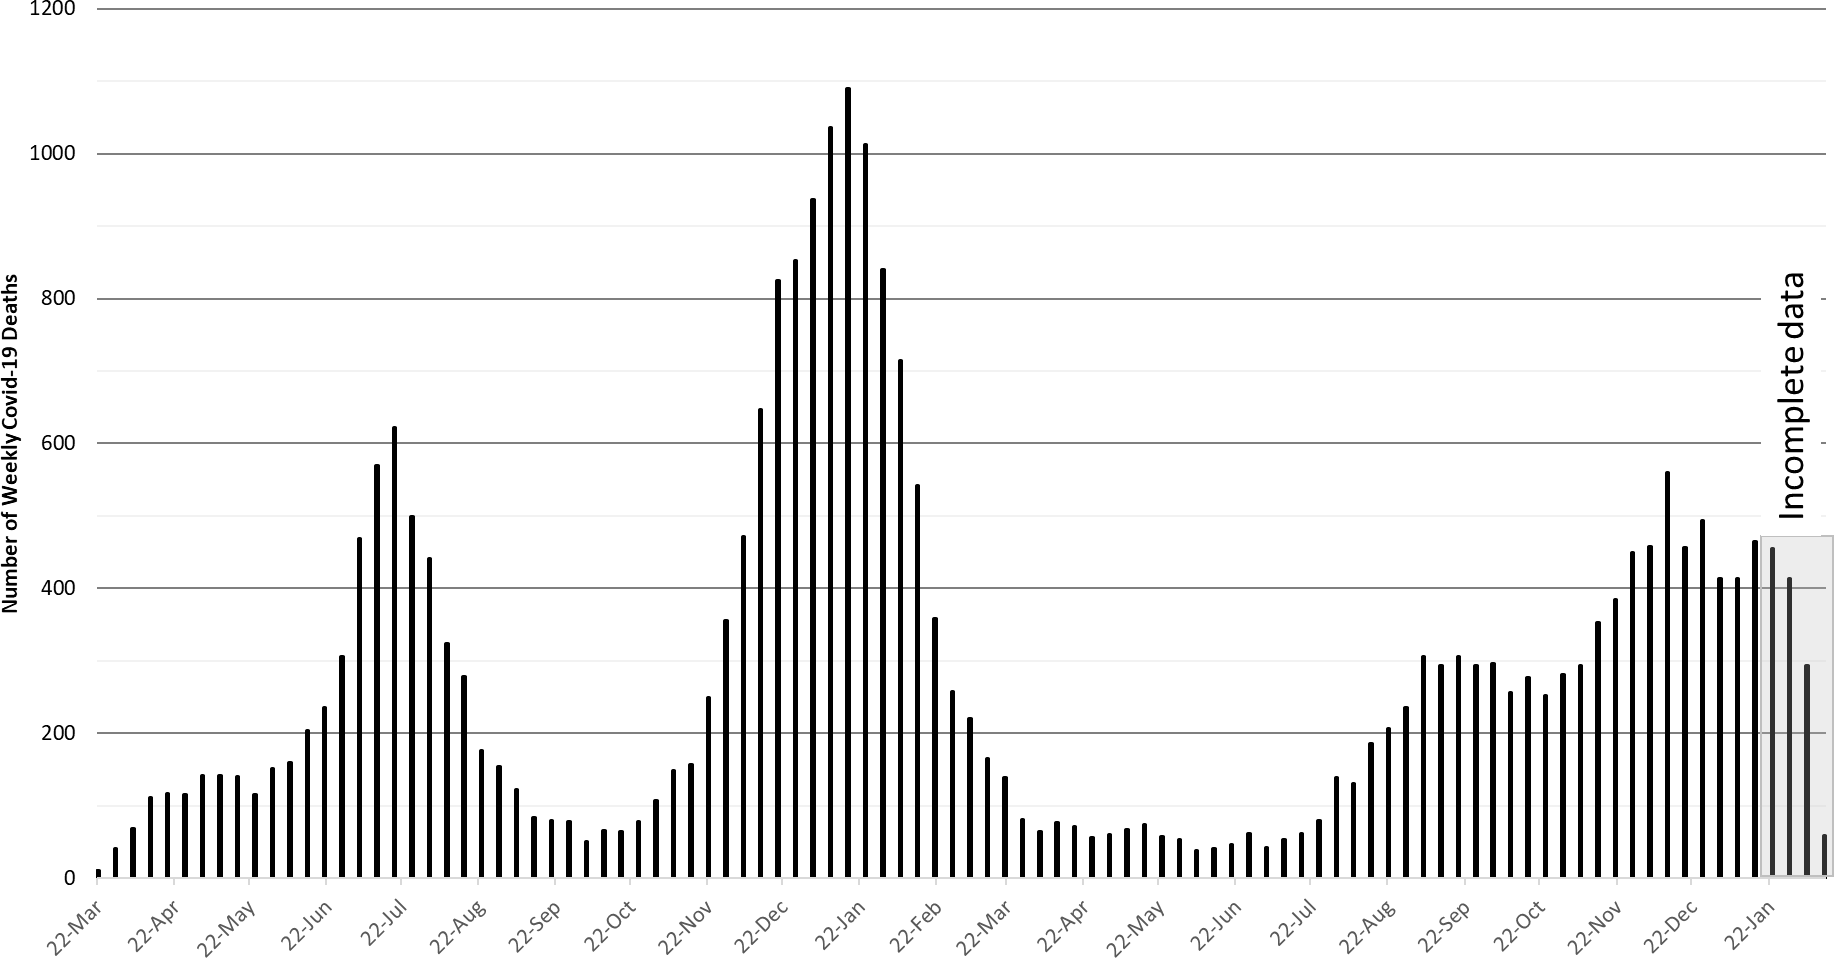
Figure 8. Weekly Arizona COVID-19 Deaths March 16, 2020 – February 13, 2022.
The week ending December 12th has now recorded 560 deaths to date. Hopefully, this will be the only week this happens during the Delta - Omicron waves (Figure 8). At least 27513 Arizonans have lost their lives to COVID-19. A mortality report from the AzPHA indicates that official statistics undercount actual deaths.
Pima County Outlook
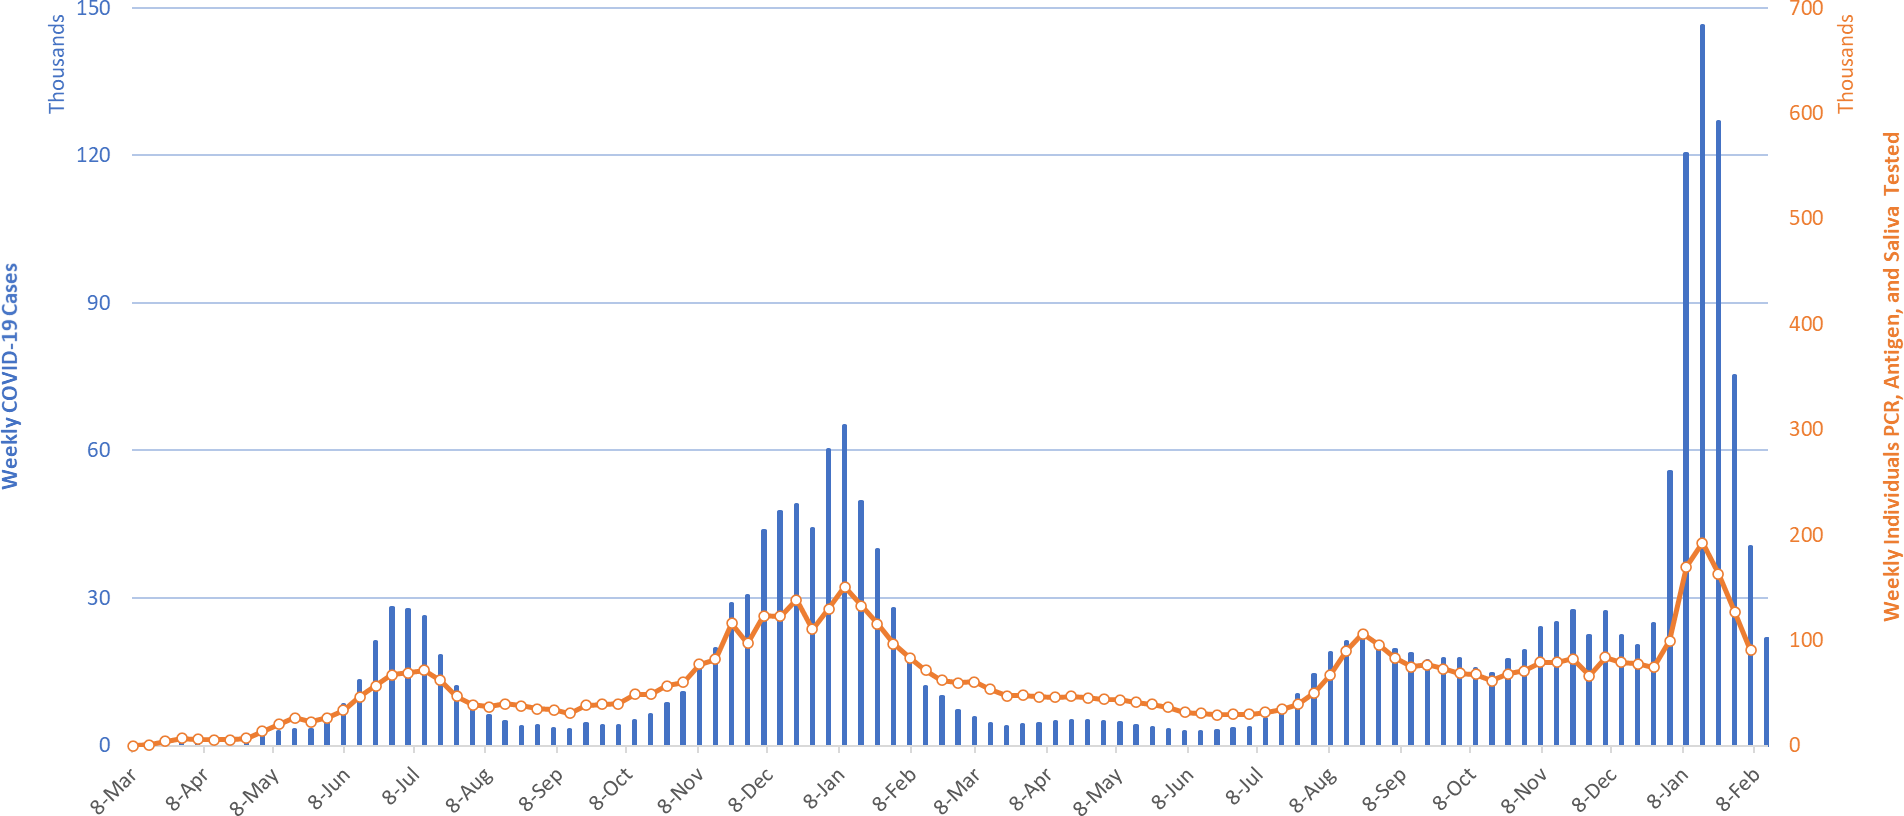
Figure 9. Weekly COVID-19 Cases in Pima County and Number of Individuals Undergoing COVID-19 Diagnostic Testing March 1, 2020 – February 13, 2022.
For the week ending February 13th, 3472 Pima County residents were diagnosed with COVID-19, a 41% decrease from the initial tally of 5882 cases last week (Figure 9).
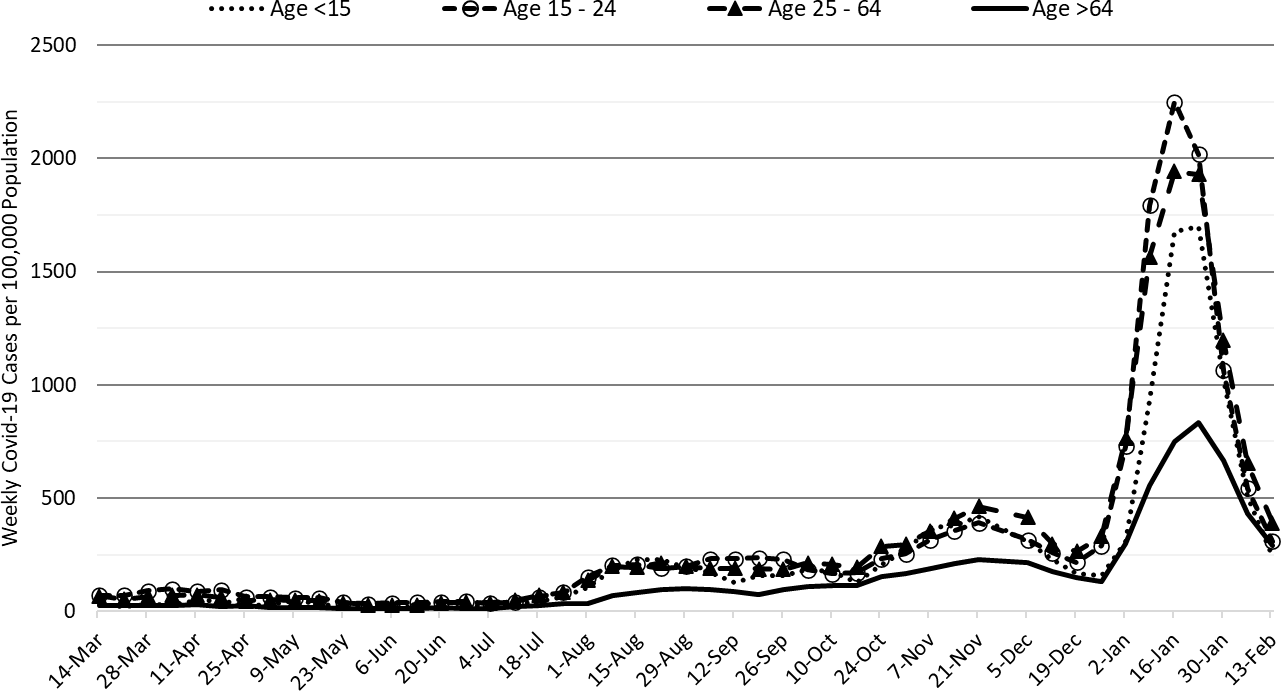
Figure 10. COVID-19 Weekly Incidence in Pima County by Age Group March 7, 2021 - February 13, 2022.
Transmission by age group is shown in Figure 10.
Summary
- Arizona continues to experience high levels of community transmission. Test positivity is also high reminding us that test capacity, accessibility, and/or uptake is inadequate. Arizona, like much of the United States, is emerging from its most recent pandemic wave. Transmission continues to fall briskly but risk of infection remains high.
- As of February 13th, new cases were being diagnosed at a rate of 300 cases per 100K residents per week. The risk of Omicron infection will remain high for the remainder of February but should fall below the CDC threshold for high transmission the first or second week of March!
- During March more institutions and individuals will be drawing down their COVID-19 mitigations. For those who are healthy, vaccinated or recovered normalization will pose little risk. Those who have personal health conditions, family members with personal health conditions, or workers who interact with those who are vulnerable should continue to mitigate until transmission levels fall further. We are going to continue an awkward condition where motivating the healthy to maintain their precautions to protect the vulnerable will become even more difficult.
- While too late to matter, Health Affairs published article confirming the effectiveness of government mask mandates. Interestingly, the greatest benefits accrued to counties with a greater Republican vote share. https://www.healthaffairs.org/doi/10.1377/hlthaff.2021.01072
- COVID-19 hospital occupancy in the wards and ICUs is falling quickly. Even so, access to care continues to be constrained by COVID-19 occupancy and the backlog of postponed care.
- At least 27563 Arizonans have lost their lives to COVID-19. Weekly totals in the low-400s are likely for another couple of weeks.
- What does the future of COVID-19 look like? The UK’s Scientific Advisory Group for Emergencies has something to say about it. I tend to agree with their Central Optimistic and Central Pessimistic scenarios; I’m hoping for the former, but we should prepare for the latter.
- What’s going on with the UK and BA.2? Well, here is the latest UK Technical Briefing. One of the more interesting factoids (page 21) is that the median serial interval for BA.2 is 2.7 days (lightening fast) compared to 3.3 days for BA.1 (thunder fast).
- Is BA.2 here in Arizona? It is present, but in low numbers (5%). However, we should expect it to become the dominant variant over the coming months (not weeks like BA.1). The implication is that it will be a bit more difficult to push down transmission rates. https://pathogen.tgen.org/covidseq-tracker/
- Other odds and ends…over the coming months expect more information to clarify the long-term risk of COVID-19 infection. The cases, hospitalizations, and deaths we see in “real-time” aren’t the only ones occurring.
Appendix Images
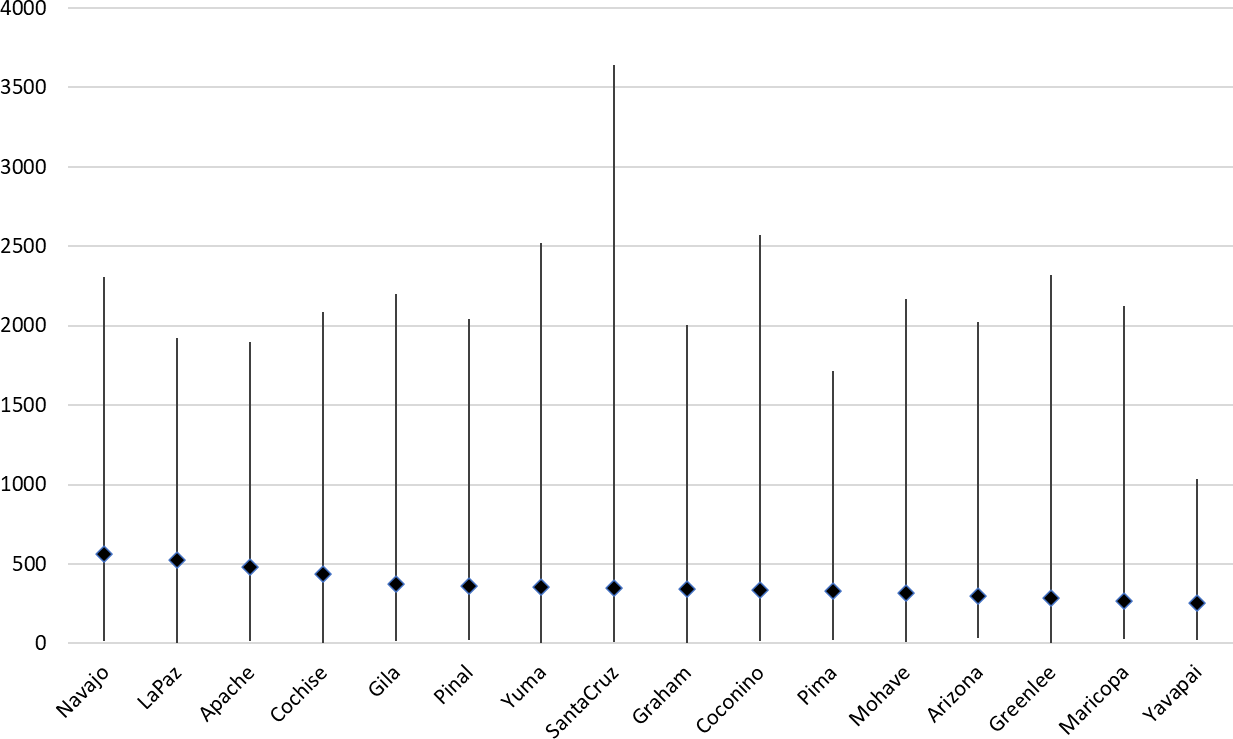
APPENDIX Figure 1. Minimum, Maximum and Current COVID-19 Cases Rates per 100K Residents per Week by County April 1, 2020 – February 13, 2022.
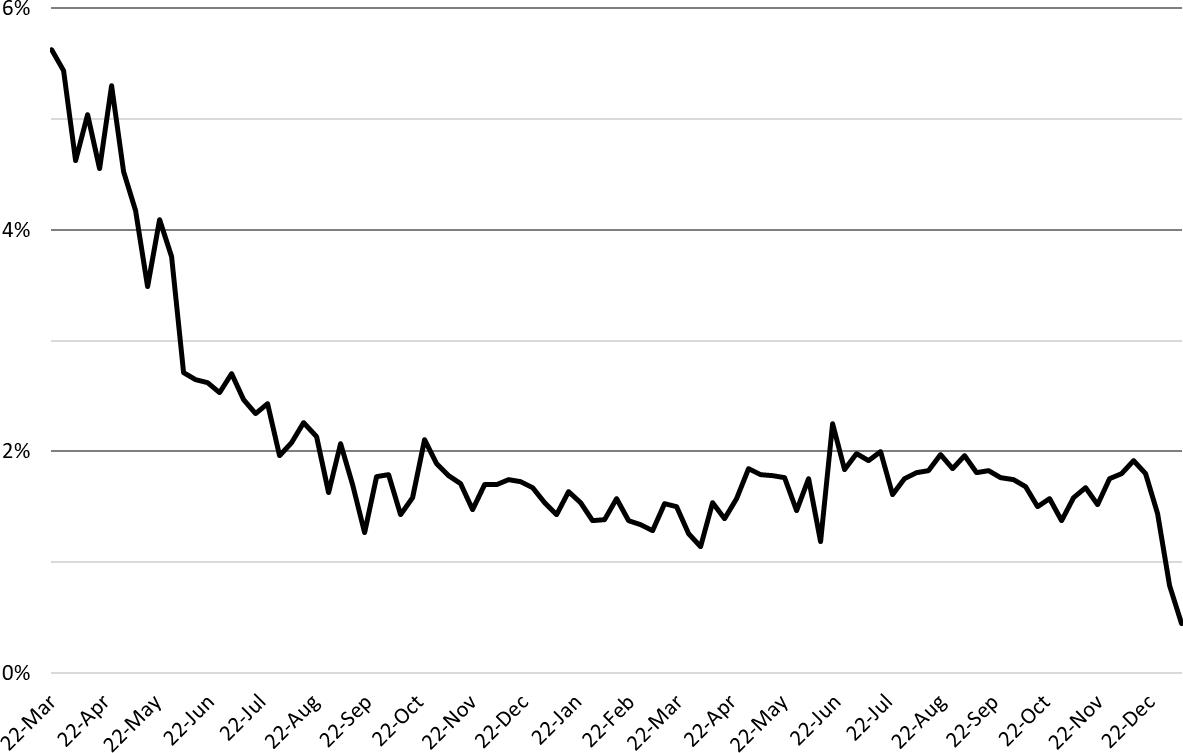
APPENDIX Figure 2. COVID-19 Age-Standardized Case Fatality Rate March 22, 2020 – January 9, 2022 (October 25, 2020 case distribution).
Forecast reports to date, available as PDFs
Download PDF to view additional charts of Arizona counties, available in appendix of report.
2021 Reports
Based on what we know now about this pandemic, we support guidelines for social distancing to slow the spread of the virus and urge everyone to follow the recommendations provided by the Centers for Disease Control and Prevention (CDC) to protect yourself, your family, your neighbors, and your employees. Please heed the recommendations as provided by the CDC.
COVID covid coronavirus virus covid19 corona forecast model