
Weekly Arizona COVID-19 Data Report – February 25
Note this forecast page is not the most recent forecast available.
View the most current forecast report
Researcher Analyzes Arizona COVID-19 Spread Models for Decision-Makers
The following information regarding the spread of COVID-19 in Arizona was prepared by Joe Gerald, MD, PhD, a researcher at the Mel and Enid Zuckerman College of Public Health (MEZCOPH) at the University of Arizona. This information has also been reviewed by other MEZCOPH faculty.
This data were obtained from the Arizona Department of Health Services COVID-19 webpage and reflect conditions in Arizona as of February 25, 2022.
This information is intended to help guide our response to the outbreak. It is not intended to predict how this pandemic will evolve. Rather, this model extrapolates what might occur if current conditions remain unchanged. As regional authorities and healthcare providers respond, their actions are expected to mitigate the worst consequences of this pandemic.
![]()
COVID-19 Disease Outbreak Forecast
Arizona State and Pima County
Updated February 25, 2022
Disclaimer: This information represents my personal views and not those of The University of Arizona, the Zuckerman College of Public Health, or any other government entity. Any opinions, forecasts, or recommendations should be considered in conjunction with other corroborating and conflicting data. Updates can be accessed at https://publichealth.arizona.edu/news/2021/covid-19-forecast-model.
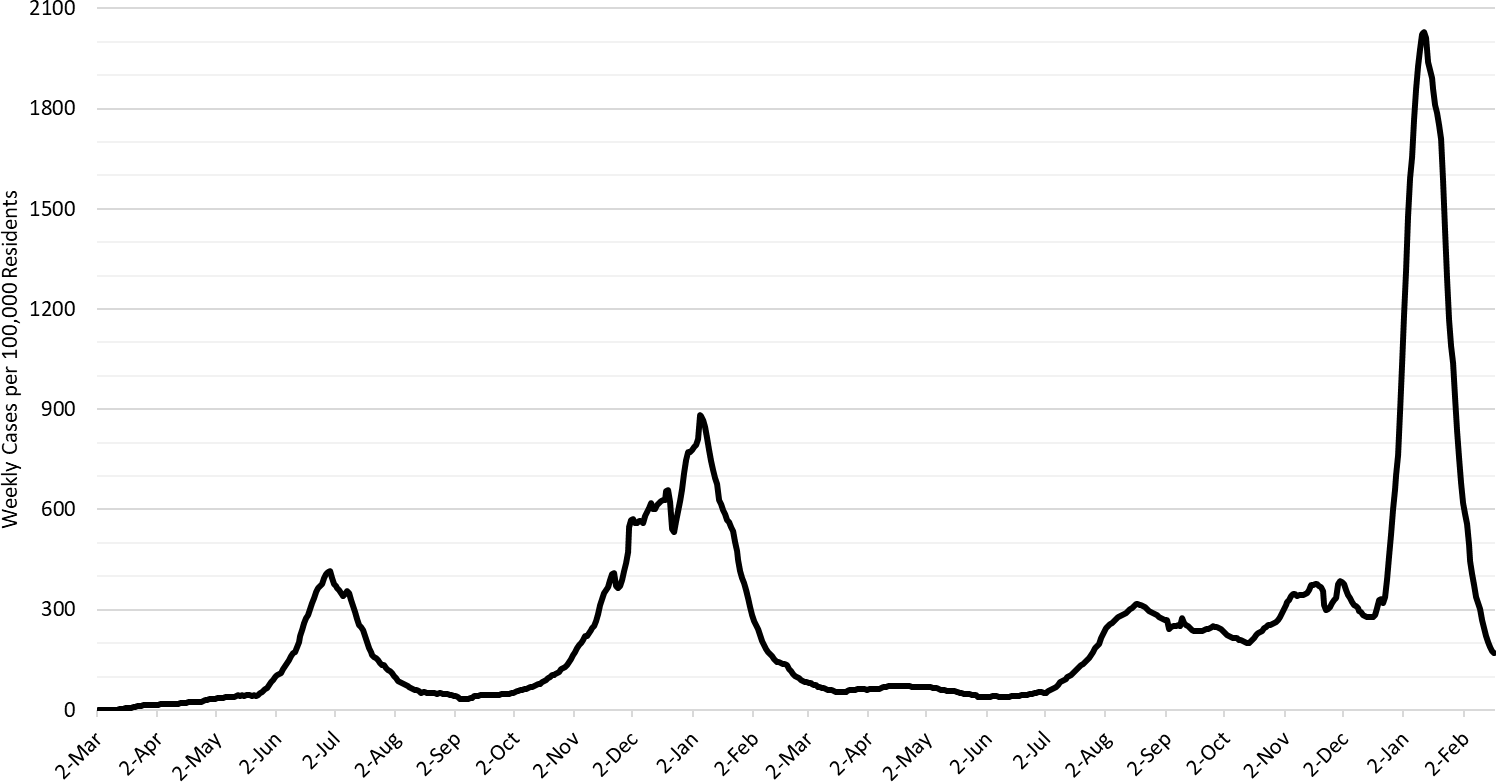
Figure 1. COVID-19 Cases per 100,000 Residents per Week in Arizona March 1, 2020 – February 20, 2022.
For the week ending February 20th, at least 12378 Arizonans were diagnosed with COVID-19, a 43% decrease from the 21842 cases reported the prior week. Arizona’s new case ranking rose to 12th place this week with the nation’s leaders being Maine (1342), Idaho (562), Kentucky (470), Montana (428), and Alaska (393). While the risk of contracting Omicron remains high, the rapid fall in cases means that many, but not all, institutions and/or individuals may begin to safely relax their mitigation practices in March.
Cases are currently being diagnosed at a rate of at 170 cases per 100K residents per week (Figure 1). Yesterday, the CDC updated its masking recommendations such that Maricopa, Coconino, Yavapai, and Santa Cruz Counties are now rated as being at medium risk. The remaining counties should fall below the threshold demarking high risk next week (see Appendix for my early thoughts on the new recommendations). Rates are highest among those >65 years and lowest among those <15 years of age, 198 and 128 cases per 100K residents, respectively (Figure 2a following page).
According to the CDC, 42% of Arizona adults and 59% of its seniors have obtained a third dose booster. The ADHS Vaccine Dashboard shows weekly doses delivered fell to 50K doses indicating progress is grinding to a halt. The CDC recommends everyone ≥12 years who received Pfizer primary sequence should receive a booster; ≥18 years if they received the Moderna primary sequence.
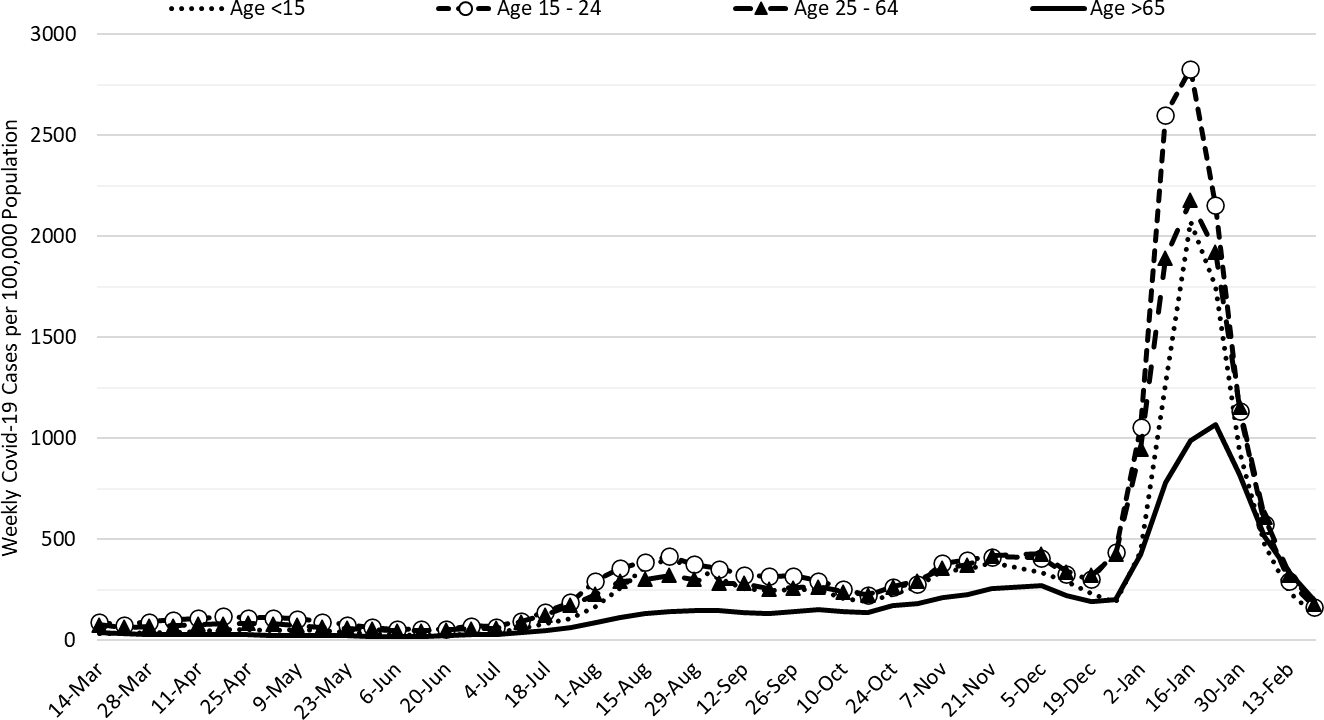
Figure 2a. COVID-19 Cases in Arizona by Age Group March 7, 2021 – February 20, 2022 (Data from week ending November 28 suppressed).
Figure 2a shows transmission among all age groups continues to decrease with relatively little separation among age groups.
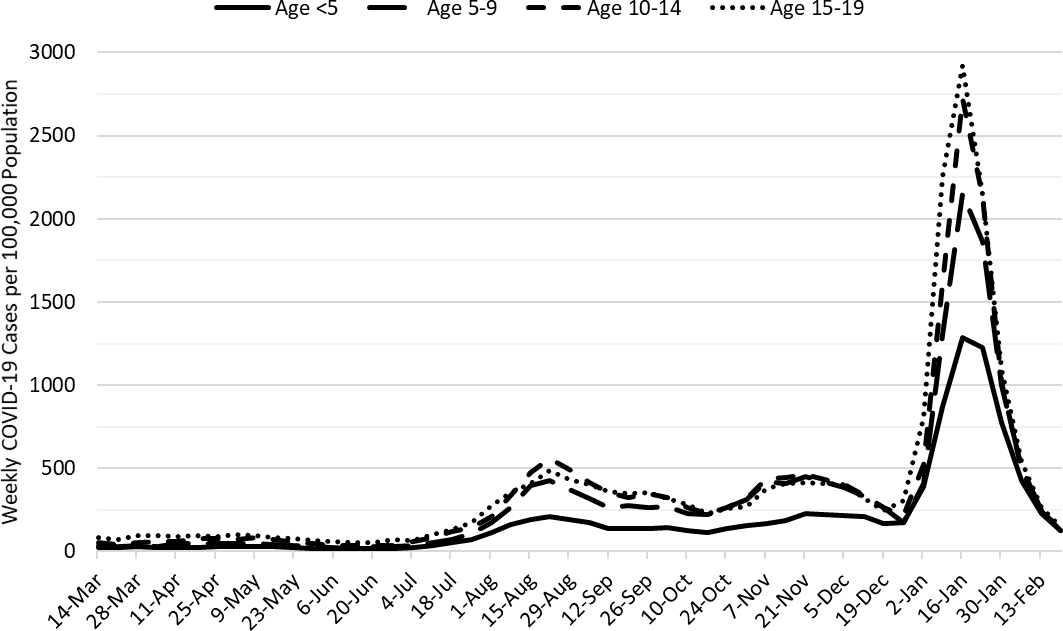
Figure 2b. COVID-19 Weekly Incidence in Arizona among children March 7, 2021 – February 20, 2022.
Figure 2b shows that transmission among children is also declining across all age groups.
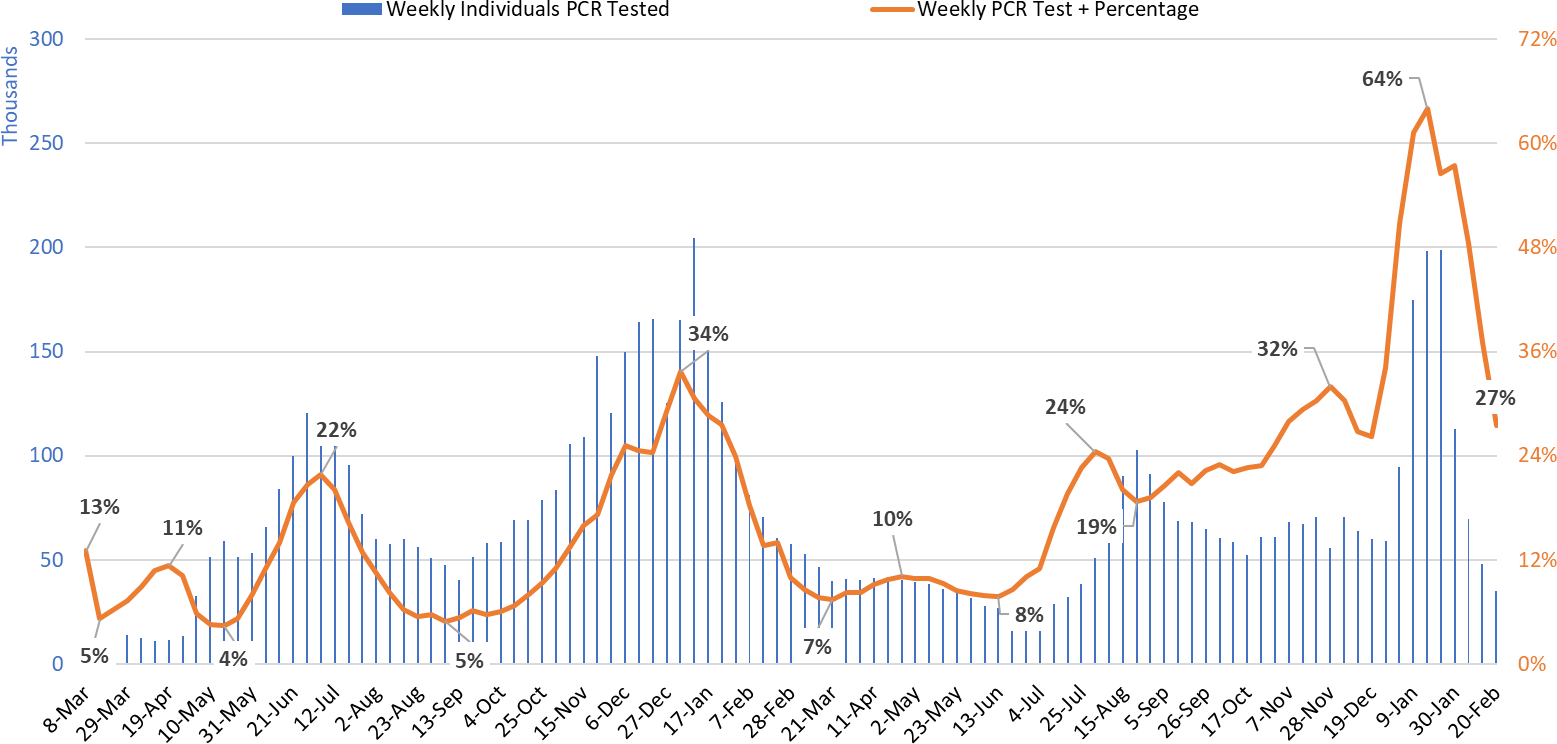
Figure 3. Weekly Number of Patients Undergoing Traditional Nasopharyngeal PCR Testing and Associated Percent Positivity March 1, 2020 – February 20, 2022.
Test positivity fell again this week but remains high at 27% (Figure 3).
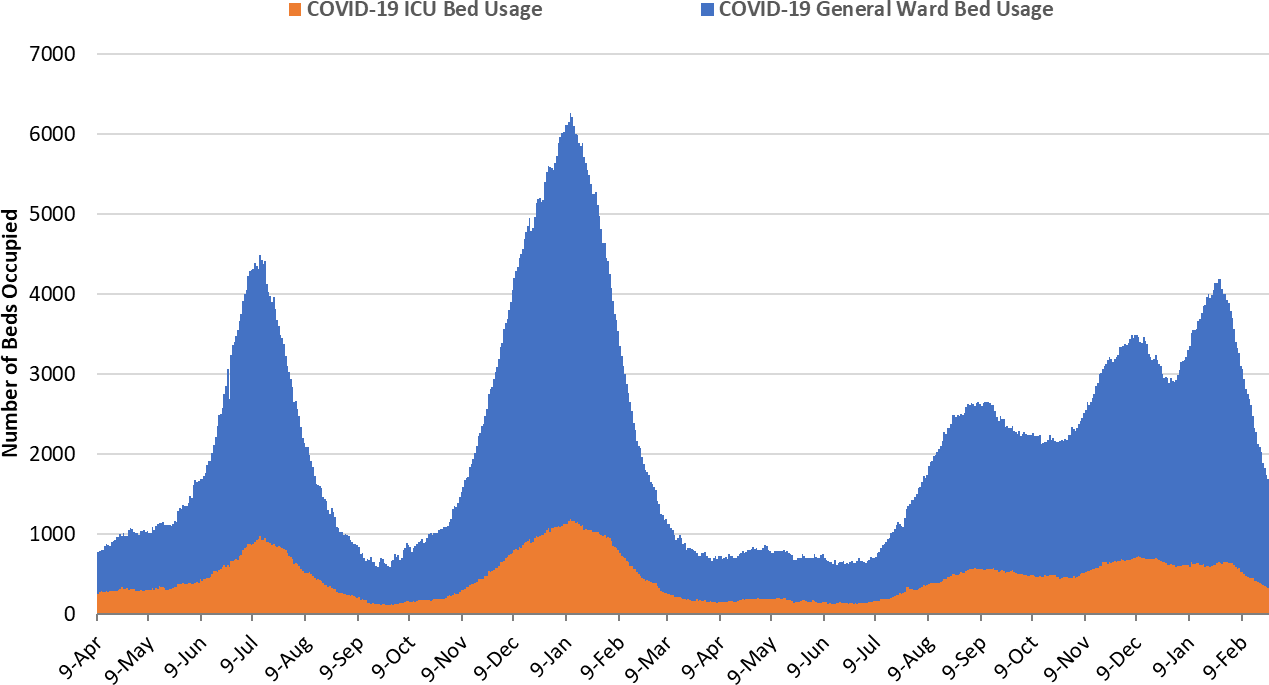
Figure 4. Arizona Daily COVID-19 General Ward and ICU Census April 9, 2020 – February 24, 2022.
As of February 24th, 1366 (16%) of Arizona’s 8756 general ward beds were occupied by COVID-19 patients, a 27% decrease from last week’s 1867 occupied beds (Figure 4 and Figure 5 Panel A). Another 540 (6%) beds remained available for use which is similar to last week’s 535 available beds. Three-hundred twenty-four (324, 20%) of Arizona’s 1644 ICU beds were occupied by COVID-19 patients, a 20% decrease from last week’s 407 occupied beds (Figure 4 and Figure 5 Panel B). An additional 143 (9%) ICU beds remained available for use which is similar to last week’s 149 beds.
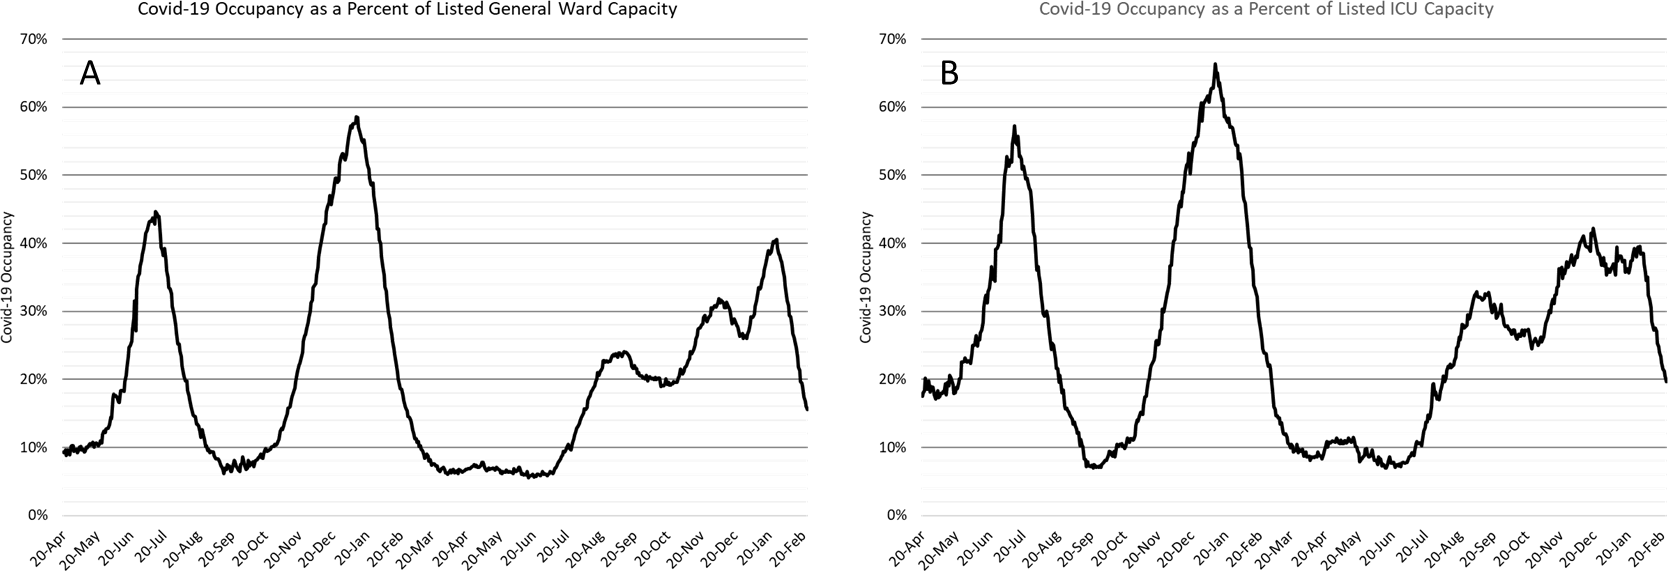
Figure 5. COVID-19 Occupancy as a Percent of Listed General Ward (A, left) and ICU (B, right) Capacity in Arizona April 20, 2020 – February 24, 2022.
For the first time since August 13, 2021 (191 consecutive days), hospital occupancy fell below 2000 combined occupancy. Hospitals experienced only 98 consecutive days with a combined occupancy >2000 patients during the winter 2021 surge. Similarly, hospitals experienced 75 days with >3000 combined occupancy during the Delta/Omicron waves whereas the winter 2021 surge saw 78 days. Despite the availability of vaccines, some acquired immunity, and effective non-pharmacologic interventions, this year’s COVID-19 wave was objectively worse than last year’s in terms of overall burden.
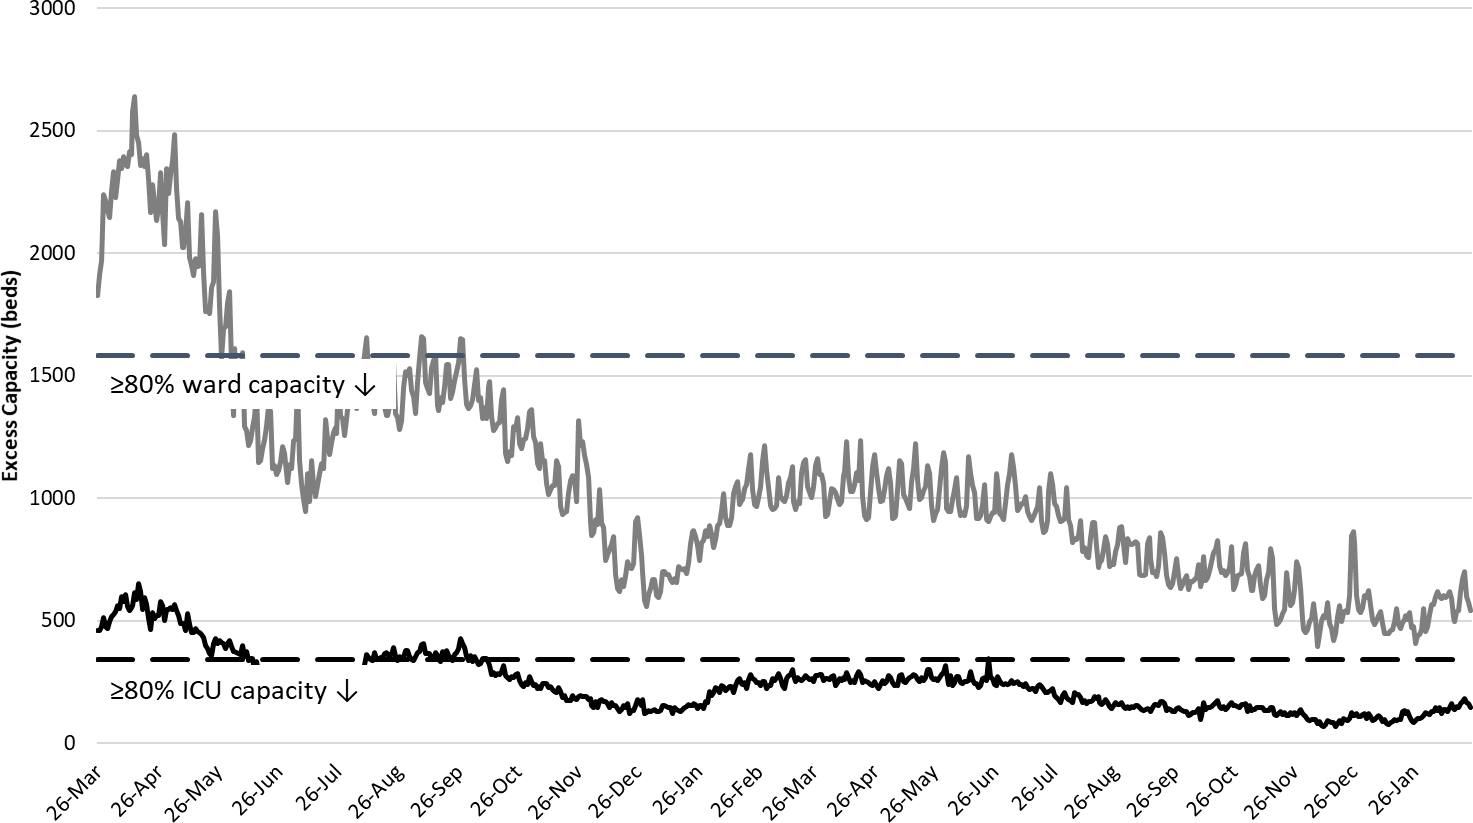
Figure 6. Observed Excess Non-Surge General Ward and ICU Capacity in Arizona Mar 26, 2020 – Feb 24, 2022.
Hospital occupancy remains far above seasonal levels with safety margins, as measured by available beds, remaining near historical lows (Figure 6).
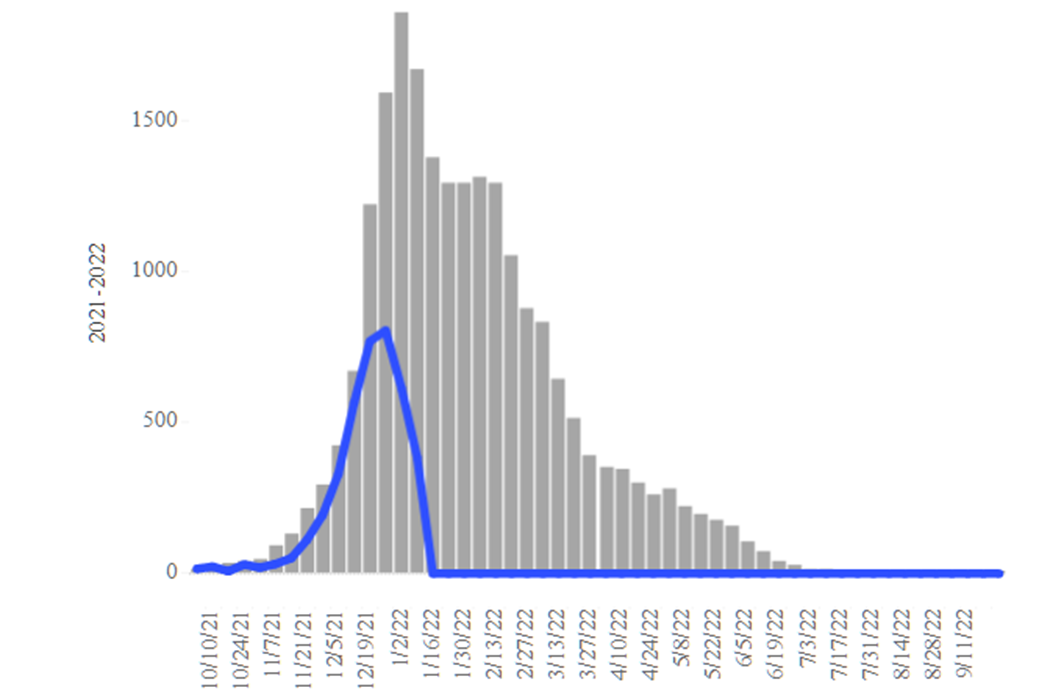
Figure 7. Arizona Influenza Cases in 2021 (blue) versus 5-Year Historical Average (grey)
Seasonal influenza cases in Arizona (blue line) is experiencing a second wind with cases rising markedly this past week. Even so, rates remain below the state’s 5-year historical average (grey bars, Figure 7). Hospitals should see fewer COVID-19 admissions but perhaps more influenza cases over the coming weeks.

Figure 8. Weekly Arizona COVID-19 Deaths March 16, 2020 – February 20, 2022.
The week ending December 12th has now recorded 564 deaths to date. Hopefully, this will be the only week this happens during the Delta - Omicron waves (Figure 8). Even so, COVID-19 deaths remain quite high by historical standards. At least 27931 Arizonans have lost their lives to COVID-19.
Pima County Outlook
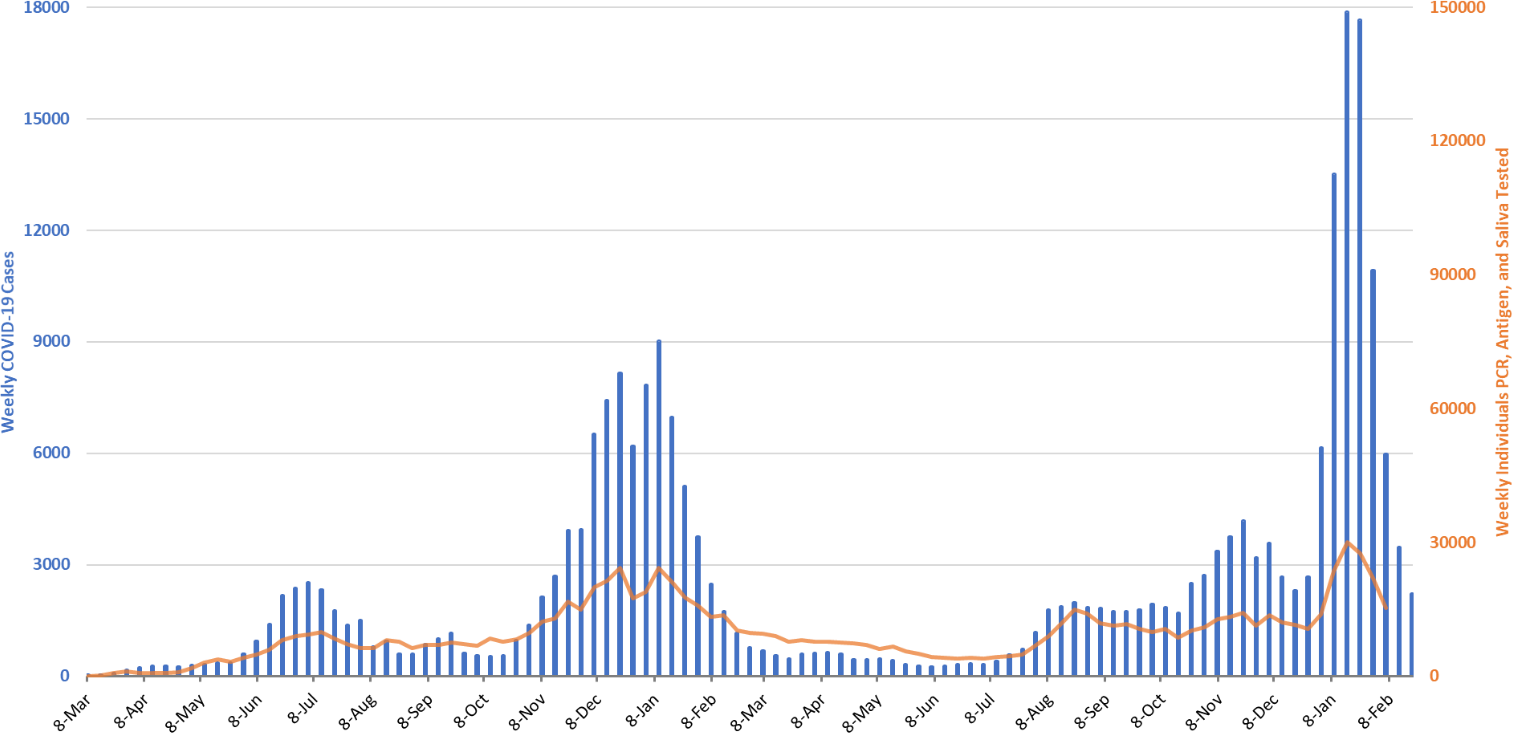
Figure 9. Weekly COVID-19 Cases in Pima County and Number of Individuals Undergoing COVID-19 Diagnostic Testing March 1, 2020 – February 20, 2022.
For the week ending February 20th, 2218 Pima County residents were diagnosed with COVID-19, a 36% decrease from the initial tally of 3472 cases last week (Figure 9).
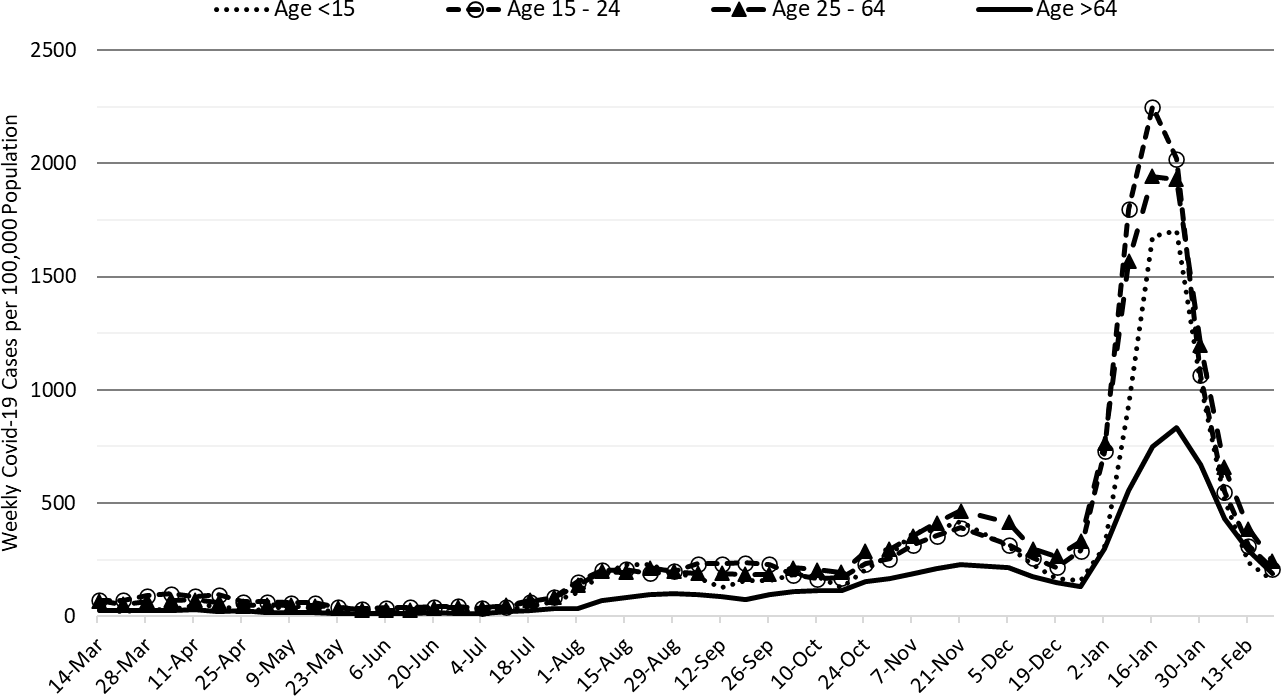
Figure 10. COVID-19 Weekly Incidence in Pima County by Age Group March 7, 2021 - February 20, 2022.
Transmission by age group is shown in Figure 10.
Summary
- While Arizona continues to experience high levels of community transmission, we are experiencing rapid improvements that will meaningfully reduce risk of infection in March. Test positivity remains high but is also declining.
- As of February 20th, new cases were being diagnosed at a rate of 170 cases per 100K residents per week. The risk of infection now falls below the CDC threshold for high transmission in Maricopa, Coconino, Yavapai, and Santa Cruz Counties. Residents in other counties should fall below high transmission this week.
- During March more institutions and individuals will be drawing down their COVID-19 mitigations. For those who are healthy, vaccinated or recovered normalization will pose little risk. Those who have personal health conditions, family members with personal health conditions, or workers who interact with those who are vulnerable should continue to mitigate until transmission levels fall further. We are going to continue an awkward condition where motivating the healthy to maintain their precautions to protect the vulnerable will become even more difficult.
- COVID-19 hospital occupancy in the wards and ICUs is falling quickly. Even so, access to care continues to be constrained by COVID-19 occupancy, influenza cases, and the backlog of postponed care.
- At least 27931 Arizonans have lost their lives to COVID-19. Weekly totals in the low-400s are likely end soon as the Omicron surge resolved quickly.
- Is BA.2 here in Arizona? Yes, it is present and now showing up in greater numbers (~10%). It should become the dominant variant over the coming month. The implication is that it will be a bit more difficult to push down transmission rates. https://pathogen.tgen.org/covidseq-tracker/
- Other odds and ends…
- There was a new review published outlining a potential mechanism for the development of long-COVID. Thought it was worth a peak https://pubmed.ncbi.nlm.nih.gov/35195253/
- The ADHS Dashboard has two new reports, one on COVID-19 by vaccination status and one on COVID-19 variants. Both are interesting.
Appendix
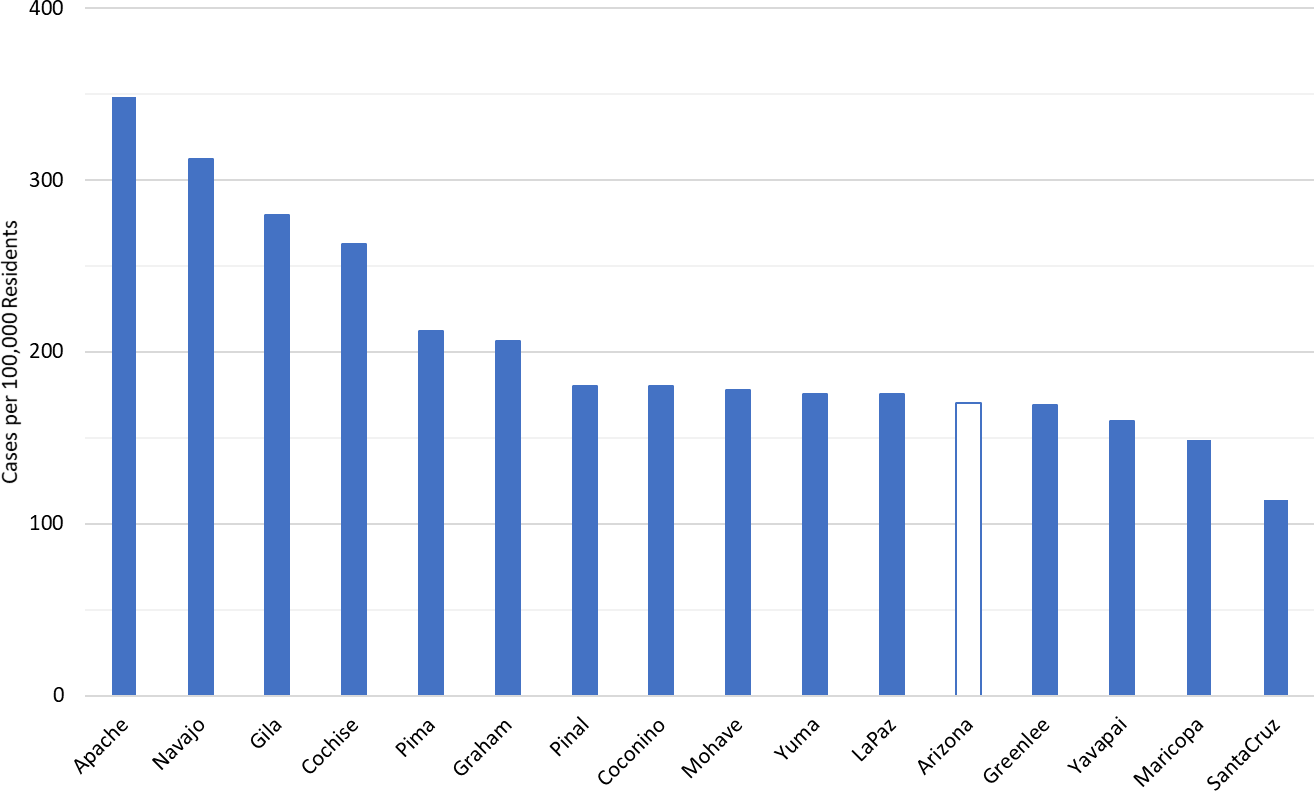
APPENDIX Figure 1. COVID-19 Cases Rates per 100K Residents per Week by County April 1, 2020 – February 20, 2022.
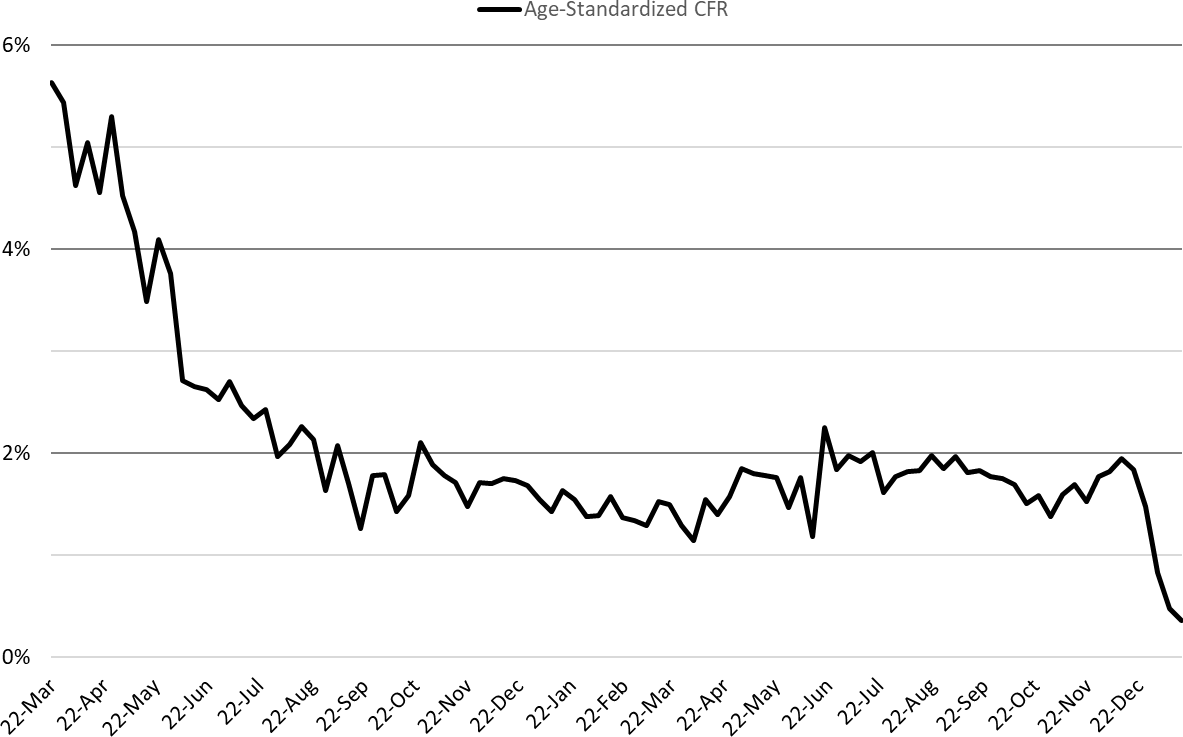
APPENDIX Figure 2. COVID-19 Age-Standardized Case Fatality Rate March 22, 2020 – January 16, 2022 (October 25, 2020 case distribution).
New CDC Community Mask Recommendations / If Arizona Were a County
On Friday, February 26 the Centers for Disease Control and Prevention (CDC) released new recommendations for community masking to reduce the spread of COVID-19. The recommendations now consider 3 key metrics: rate of new case detection, rate of new admissions to the hospital, and general ward occupancy (Figure 3A). These recommendations apply to counties, not states (Figure 4A).
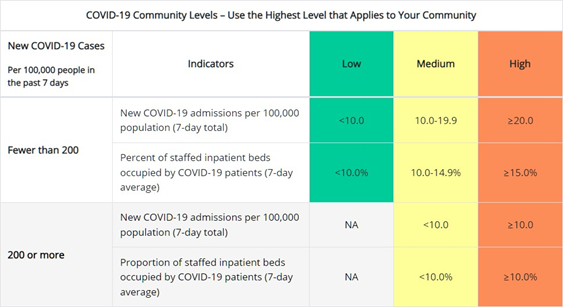
APPENDIX Figure 3. How CDC Measures the COVID-19 Community Levels (https://www.cdc.gov/coronavirus/2019- ncov/science/community-levels.html)
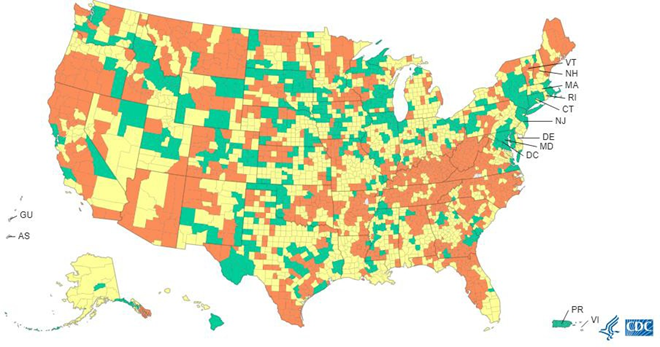
APPENDIX Figure 4. U.S. COVID-19 Community Levels by County February 24, 2022
Currently, Maricopa, Coconino, Yavapai, and Santa Cruz Counties are rates as medium risk whereas all other counties are high risk. Because I do not have hospital utilization data by county, I can only estimate the impact of the new recommendations on past COVID-19 waves at the state-level (Figure 5A).
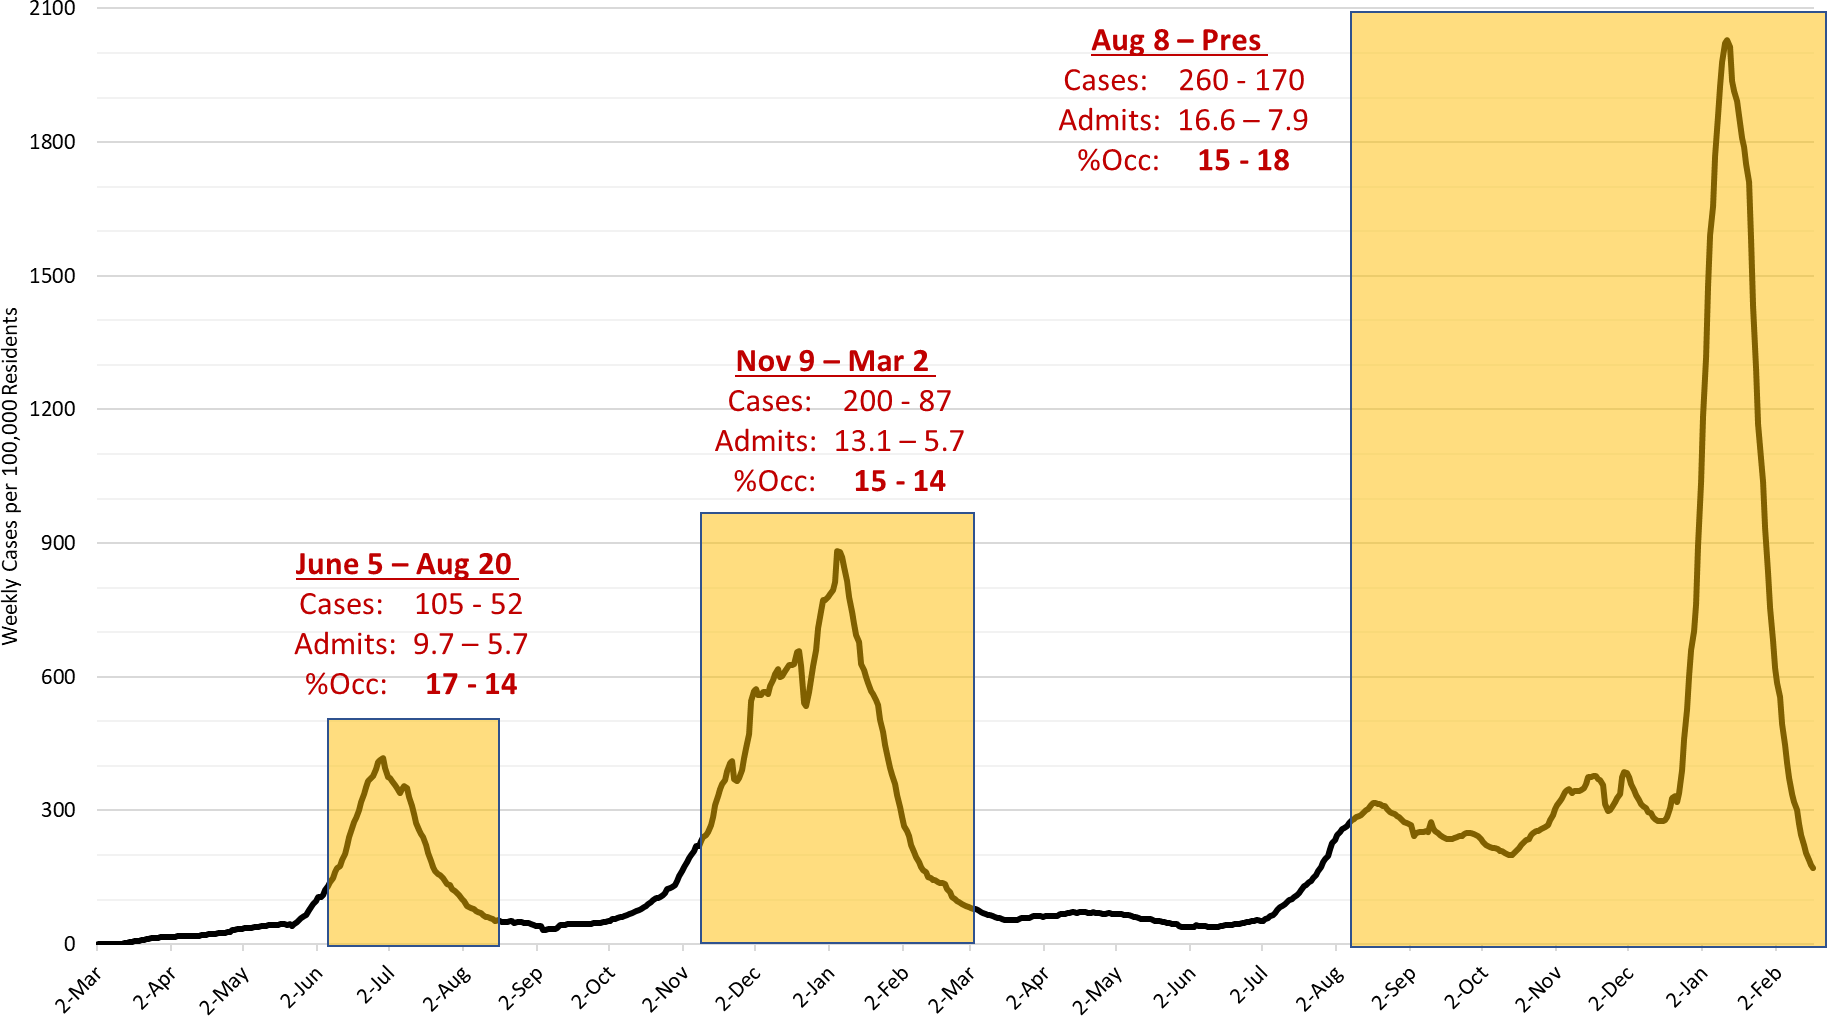
APPENDIX Figure 5. Historical Approximation of New CDC Community Masking Recommendations if Arizona Were a County, not a State.
During the Summer 2020 wave, general ward occupancy would have triggered the CDC recommendation for masking about June 5, 2020. On this date, the new case rate was 105 cases per 100K residents and the total number of admissions for the past 7 days was 9.7 per 100K residents (low) but the 7-day average of general ward occupancy reached 15% (high). The masking recommendations would have triggered 4 weeks prior to the observed transmission peak, July 2nd at 417 cases per 100K residents. The masking recommendation would have expired on August 20th when general ward occupancy fell below 15% while the transmission rate was 52 cases per 100K residents and the total number of new admissions in past 7 days was 5.7 per 100K residents.
During the Fall 2020 wave, general ward occupancy would have triggered the CDC recommendation for masking on November 9, 2020. This conclusion is potentially confusing/controversial. My rationale considered the fact that there is a 5 – 7 day lag between when transmission actually exceeds the threshold and when it is confirmed by public health reporting. On November 9th, the new case rate was, in hindsight, 200 cases per 100K residents. However, we wouldn’t know that until November 16th or so. However, on November 9th general ward occupancy reached 15% which is the trigger when transmission is <200 cases per 100K residents. The total number of hospital admissions in the past 7 days was 13.1 per 100K residents (medium). The masking recommendations would have triggered 4 weeks prior to the observed transmission peak, January 8th at 881 cases per 100K residents. The masking recommendation would have expired on March 2nd when general ward occupancy fell below 15% when the transmission rate was 52 cases per 100K residents and the total hospital admissions in past 7 days was 5.7 per 100K residents (low).
During the Fall 2021 wave, general ward occupancy would have triggered the CDC recommendation for masking about August 8, 2021. On this date, the new case rate was 260 cases per 100K residents and the total number of admissions for the past 7 days was 16.6 per 100K residents (medium) but the 7-day average of general ward occupancy reached 15% (high). For similar reasons as above, I attribute the trigger to general ward occupancy and not transmission because of the lag between actually achieving that rate and knowing about it. The masking recommendations would have triggered several months prior to the observed transmission peak on January 15, 2022 owing to the odd shape of the outbreak curve. The masking recommendation would still be in effect as transmission is currently 170 cases per 100 residents per week but general ward occupancy remains above 15%. The total number of admissions in the past 7 days is 7.9 per 100K residents (assuming these data are not lagged on the ADHS Dashboard).
From this approximation, we can infer that the CDC recommendations prioritize hospital utilization as the key metric to trigger masking. The advantage is that hospital utilization is easily measured and highly salient as a community metric. When hospitals are overwhelmed, we are all at risk whether we have COVID-19 or not. The triggers would have fired at least 4 weeks prior to the observed peak. So, there would have been at least some opportunity for the incremental benefit of government mandated masking to moderate peak transmission and flatten the curve perhaps by 25 – 30%. While this would have blunted peak hospital utilization modestly, it would still “allow” large numbers of infections with the attendant risk of long-COVID and other post-infectious sequela. For me personally, I think the CDC recommendations could do more to recognize the asymmetrical risk profile in an outbreak such that there is greater benefit from early masking than there is harm from early unmasking on the backside of the peak. Given how slow are political bodies are to implement decisions and the possibility for data lags to also slow decision-making, I would prefer an earlier trigger to implement masking.
Of course, this is really an academic discussion here in Arizona. I don’t see us masking again even if Cool Ranch Doritos are mailed to residents instead of free COVID-19 tests.
LIMITATIONS: The analysis above should be interpreted cautiously/skeptically. The recommendations are new and I may not have interpreted them as they were intended. I am a bit confused about how the total number of admissions is actually measured and whether there is a built-in lag that I did not consider. More importantly, the data are designed to applied to counties, not states. So, this analysis is subject to ecologic fallacy because I’ve used a different level of measurement. The data needed to calculate these triggers at the county-level are not readily available so I had to use state ones instead. There is also the possibility that I simply made a calculation error. So, please be cautious. Hopefully, others will attempt similar analyses to provide more detailed information on the recommendations’ strengths and weaknesses.
Forecast reports to date, available as PDFs
Download PDF to view additional charts of Arizona counties, available in appendix of report.
2021 Reports
Based on what we know now about this pandemic, we support guidelines for social distancing to slow the spread of the virus and urge everyone to follow the recommendations provided by the Centers for Disease Control and Prevention (CDC) to protect yourself, your family, your neighbors, and your employees. Please heed the recommendations as provided by the CDC.
COVID covid coronavirus virus covid19 corona forecast model