
Weekly Arizona COVID-19 Data Report – Dr. Joe Gerald, August 6
Note this forecast page is not the most recent forecast available.
View the most current forecast report
Researcher Analyzes Arizona COVID-19 Spread Models for Decision-Makers
The following information regarding the spread of COVID-19 in Arizona was prepared by Joe Gerald, MD, PhD, a researcher at the Mel and Enid Zuckerman College of Public Health (MEZCOPH) at the University of Arizona. This information has also been reviewed by other MEZCOPH faculty.
This data were obtained from the Arizona Department of Health Services COVID-19 webpage and reflect conditions in Arizona as of August 6, 2021.
This information is intended to help guide our response to the outbreak. It is not intended to predict how this pandemic will evolve. Rather, this model extrapolates what might occur if current conditions remain unchanged. As regional authorities and healthcare providers respond, their actions are expected to mitigate the worst consequences of this pandemic.

COVID-19 Disease Outbreak Forecast
Arizona State and Pima County
Updated August 6, 2021
Disclaimer: This information represents my personal views and not those of The University of Arizona, the Zuckerman College of Public Health, or any other government entity. Any opinions, forecasts, or recommendations should be considered in conjunction with other corroborating and conflicting data. Updates can be accessed at https://publichealth.arizona.edu/news/2021/covid-19-forecast-model.
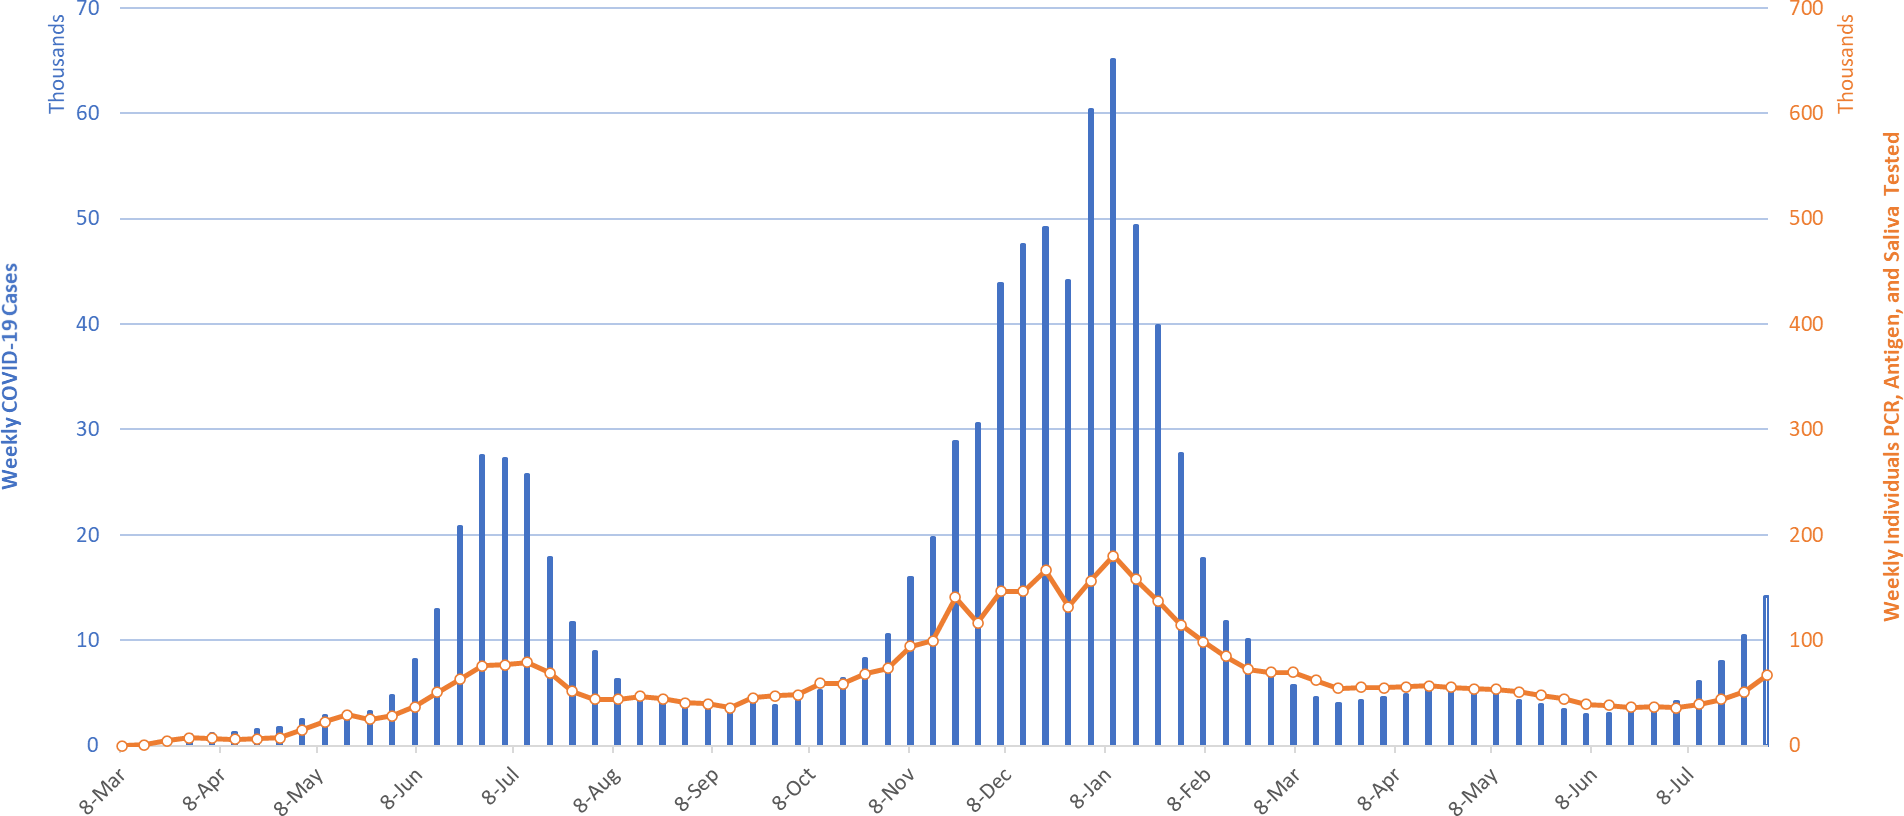
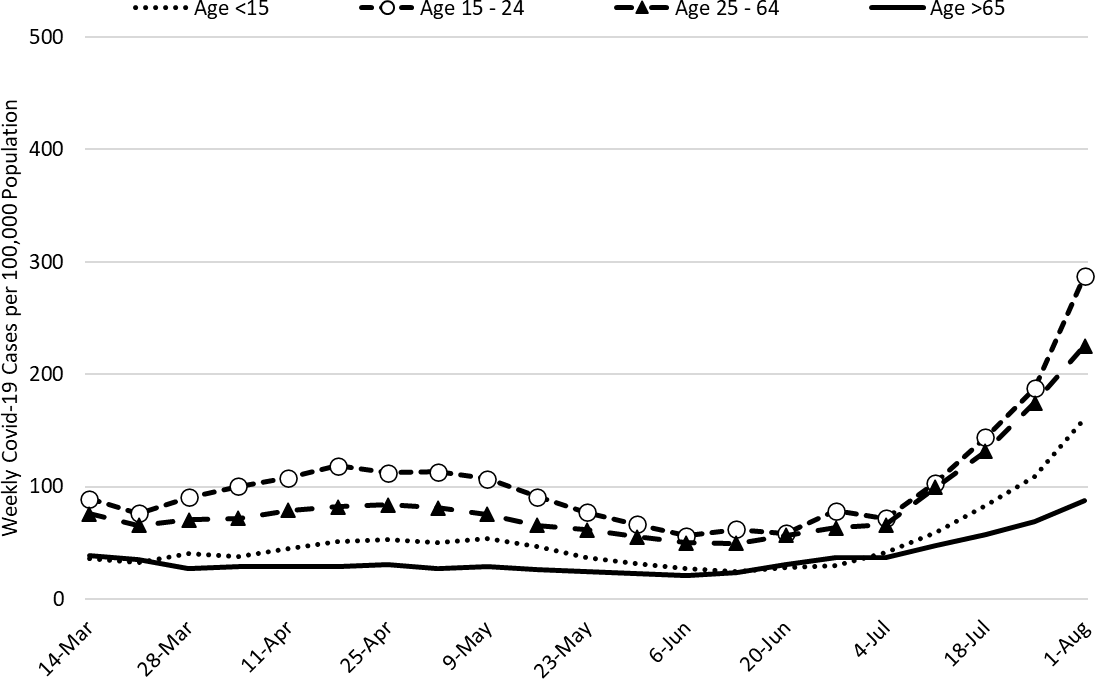
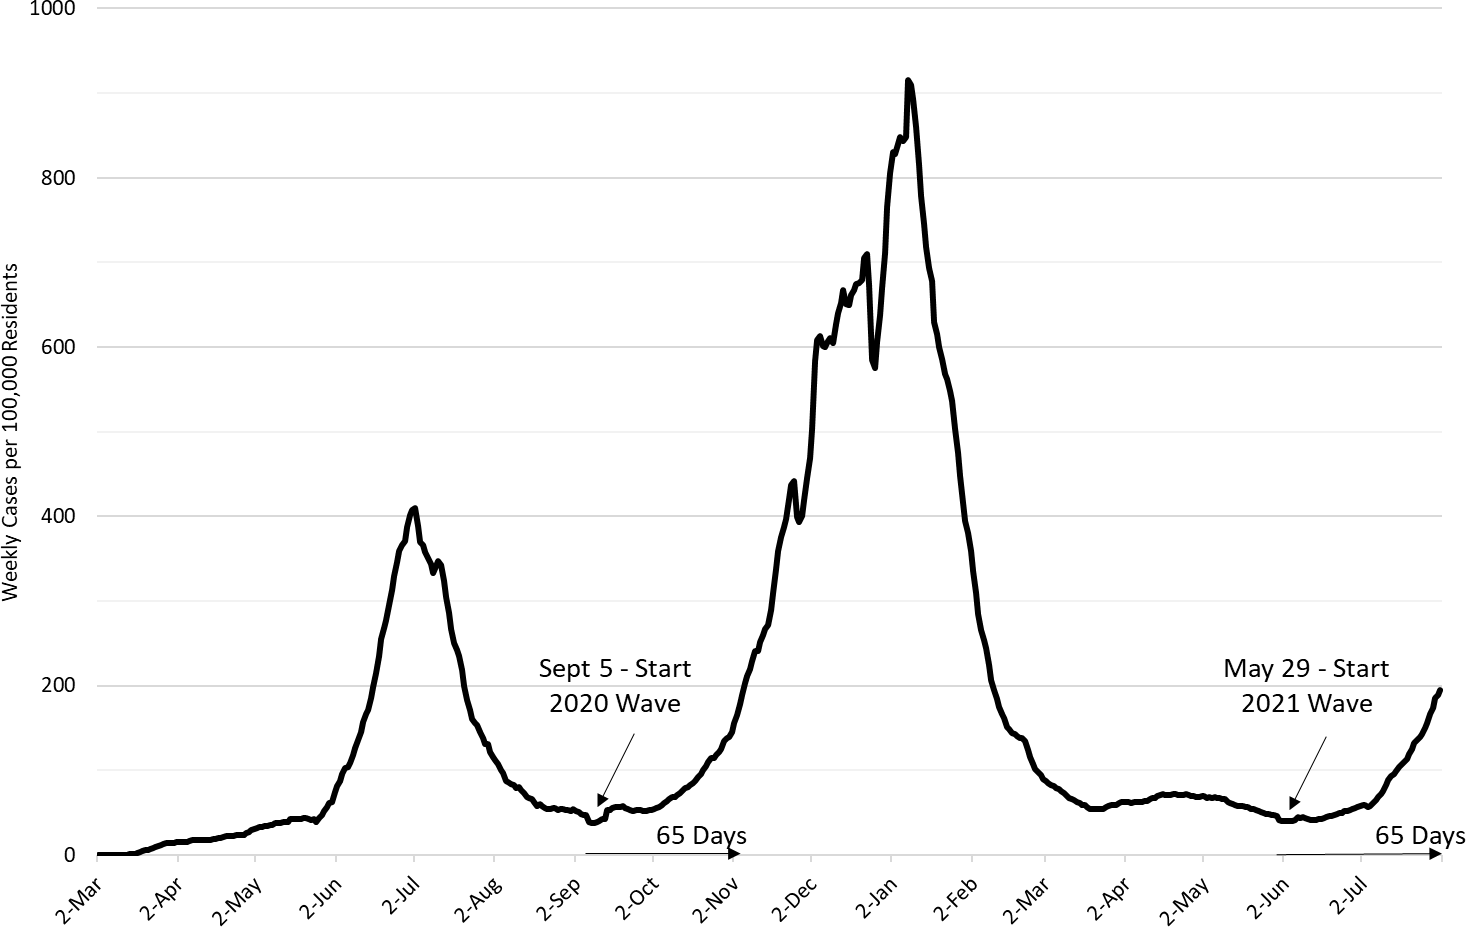
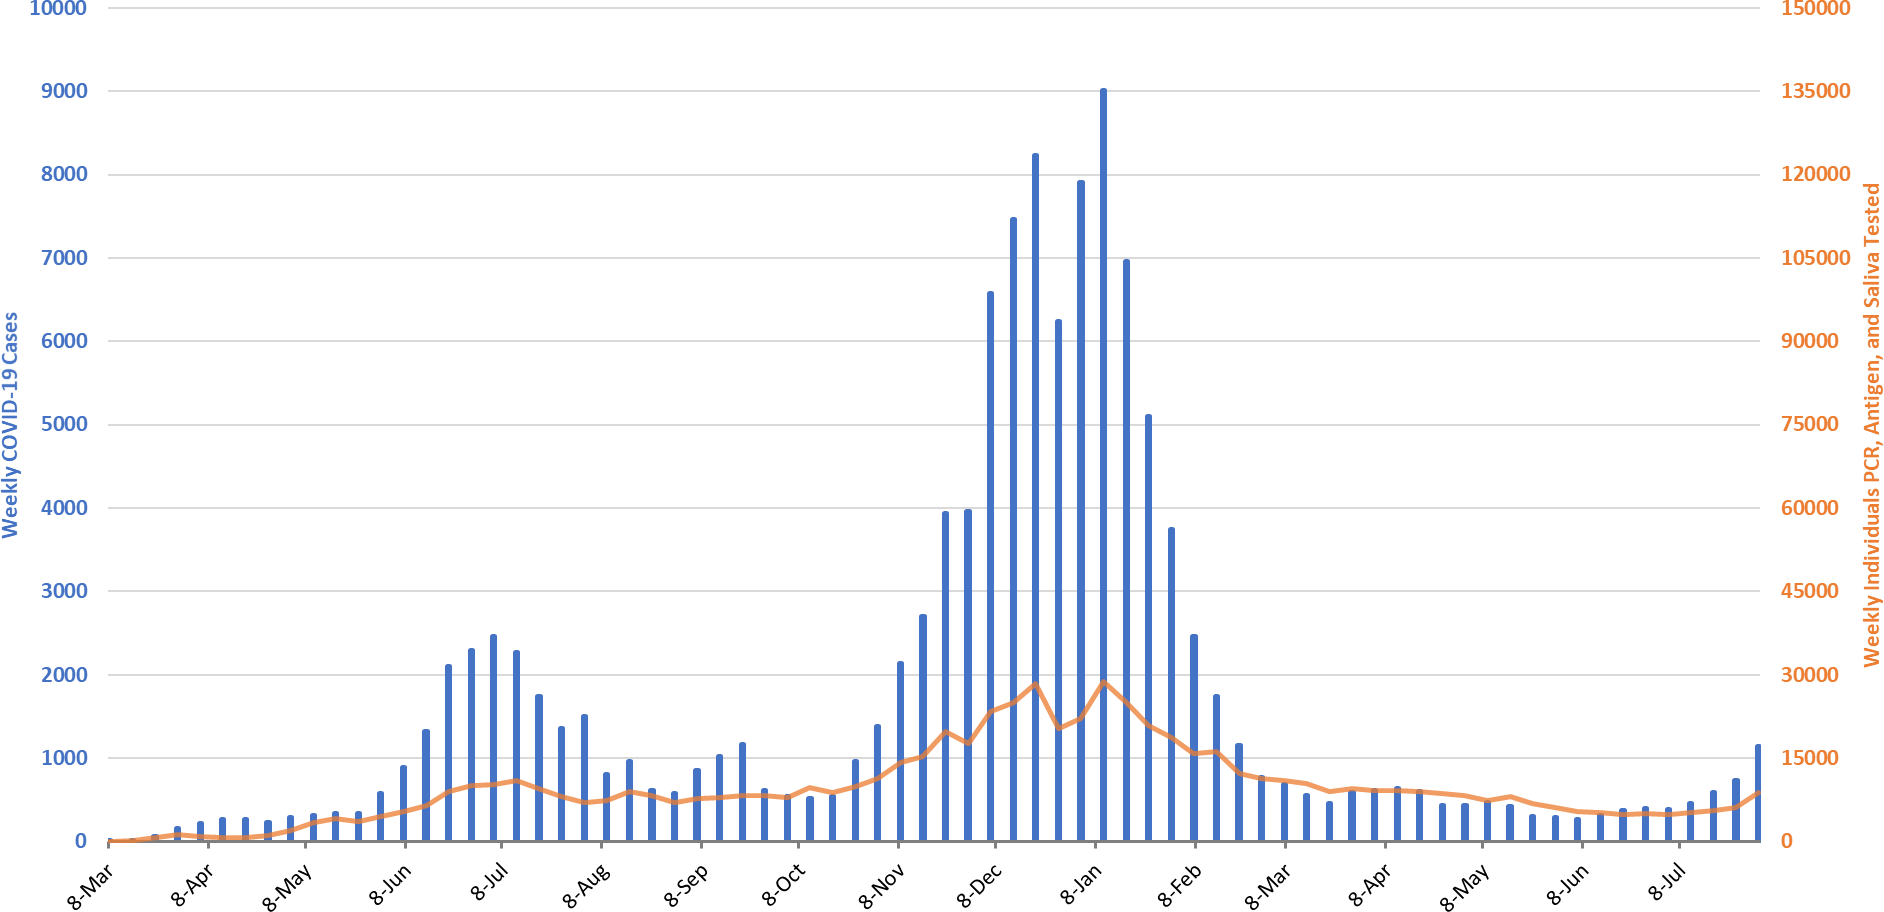
For the week ending August 1st, 14188 Arizonans were diagnosed with COVID-19, a 38% increase from last week’s initial tally of 10273 cases (Figure 1). This marks an 8th week of increasing rates with the last 4 being particularly brisk. The current rate, 195 cases per 100K residents per week, is increasing by 51 cases per 100K residents per week. While rates are about 3X higher among those 15 – 24 years of age as compared to those ≥65 years of age, 288 versus 88 cases per 100K residents per week, respectively, transmission is increasing among all age groups (Figure 2a).
|
Figure 1. Newly Diagnosed Covid-19 Cases in Arizona and Number of Individuals Undergoing Covid-19 Diagnostic Testing March 1, 2020 through August 1, 2021. |
Rates are well above the threshold marking high levels of transmission signaling another substantial surge is imminent in the coming weeks. The potential size and/or duration of this surge remains uncertain but will likely be at least the size of the summer 2020 outbreak and may approach that of the winter 2021 wave. At 195 cases per 100K residents, Arizona ranks 19th among the 50 states. Louisiana, Florida, Arkansas, and Mississippi are currently leading the pack with rates 3X higher than ours: 653, 591, 488, and 477 cases per 100K residents per week, respectively. Importantly, the rates in Louisiana have now exceeded their winter 2021 peaks and the rates in the other states are poised to set new records as well.
According to the CDC, 56% of Arizona adults have received 2-doses of vaccine while another 9% have received 1-dose. For a bit of perspective, only 43% of adults were vaccinated against influenza in the 2019-2020 season. On a positive note, about 90 thousand vaccine doses were administered last week which is 10 thousand more than the prior week and 10 thousand more than the week before that. As slow as our vaccination efforts seem, it is important to continue vaccine outreach.
|
Figure 2a. Newly Diagnosed Covid-19 Cases in Arizona by Age Group March 7 – August 1, 2021. |
Resumption of in-person instruction (K-12 and universities) in the face of high community transmission, low vaccination rates, prohibition of universal masking, lack of surveillance testing, and minimal physical distancing will undoubtedly lead to frequent school-related outbreaks and accelerating community transmission (see Pima County Health Department). This time last year, COVID-19 rates were lower, 116 versus 195 cases per 100K residents per week, and were improving, -40 versus +51 cases per 100K residents per week. Therefore, August and September are setting up to be difficult months indeed.
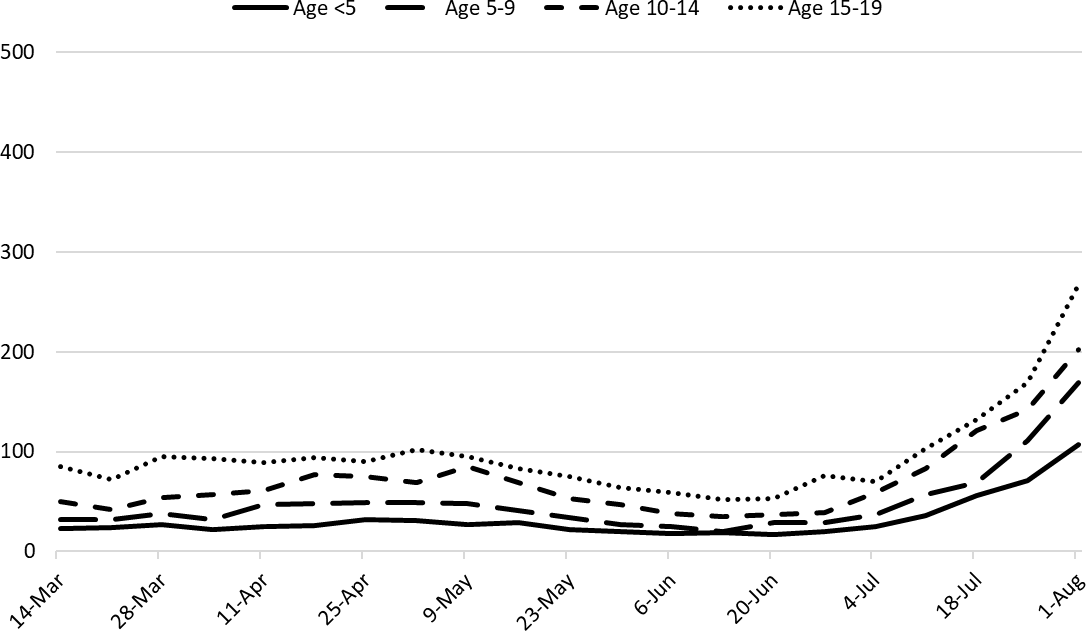
As K – 12 schools resume in-person instruction, it is useful to consider trends in childhood case rates (Figure 2b). Historically, children 15 – 19 years of age have had case rates approximating those of adults while prepubertal children have had meaningfully lower rates. Even though mask wearing in classrooms is recommended by the CDC and the American Academy of Pediatrics, but our state isn’t going to follow suit.
|
Figure 2b. Newly Diagnosed Covid-19 Cases in Arizona by Age Group March 7 – August 1, 2021. |
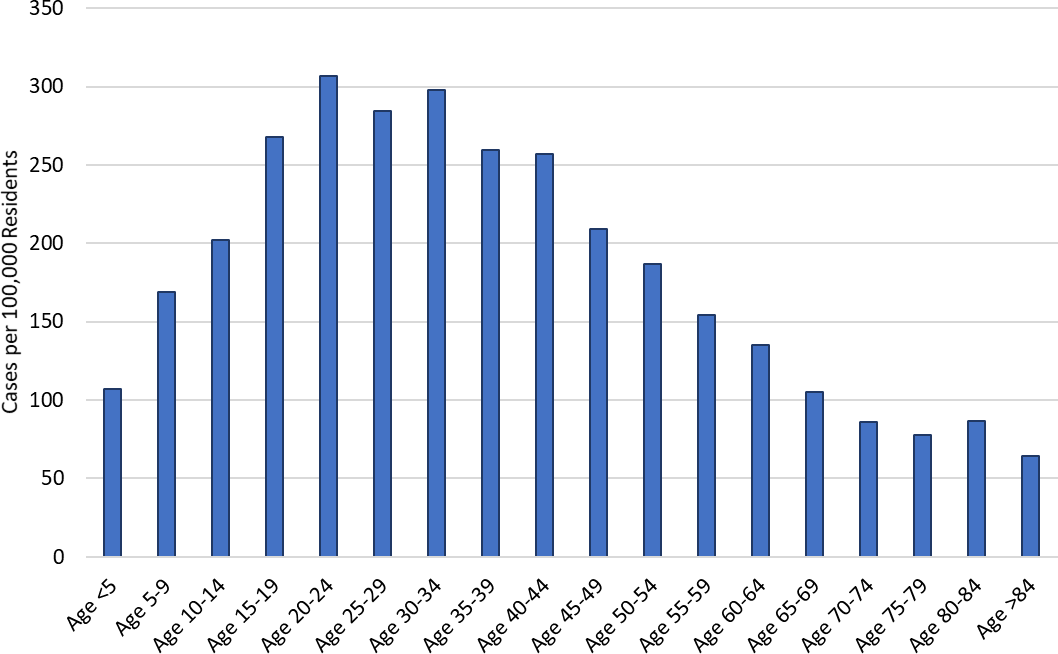
Even though considerable attention is being given to childhood cases, it is important to reaffirm that this outbreak, like past outbreaks, is being driven primarily by adolescents and working-age adults (Figure 2c). If our goal is to protect children, the most effective way to accomplish it is to slow transmission among adults.
|
Figure 2c. Weekly COVID-19 Incidence by Age Group July 25 – August 1, 2021. |
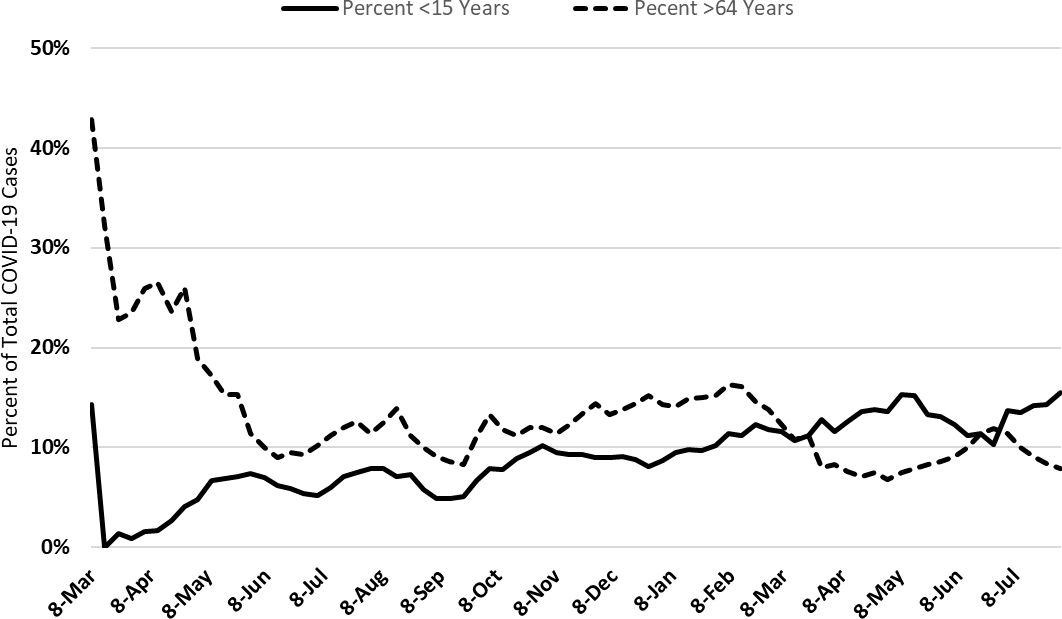
The overall age distribution, particularly between older adults and children, has only shifted modestly since vaccines became available in December (Figure 2d). For example, children now represent about 15% of cases, up from 10% during the winter 2020 outbreak while older adults now represent about 8% of cases, down from 15% during the winter 2020 outbreak. Incomplete vaccination among older adults, but particularly among working-age adults, means that hospitals remain at risk of being overwhelmed and substantial number of deaths can once again accrue.
|
Figure 2d. Percent of COVID-19 Cases Attributable to Children and Older Adults March 1 – August 1, 2021. |
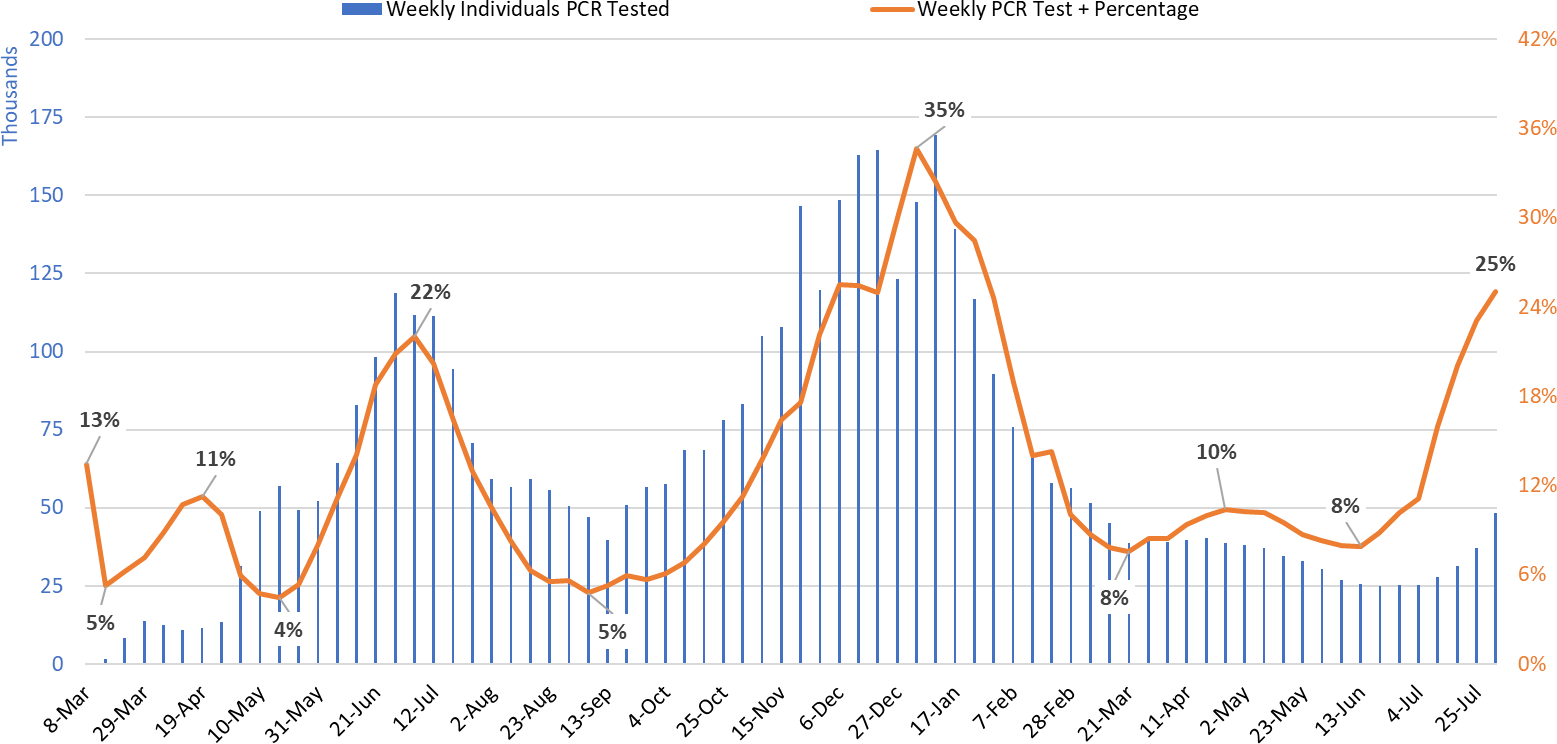
Test positivity among those undergoing traditional nasopharyngeal PCR testing rose to 25% this week, another meaningful week-to-week increase (Figure 3). This level indicates testing is inadequate for optimal public health practice and means many cases are going undiagnosed.
|
Figure 3. Weekly Number Patients Undergoing Traditional Nasopharyngeal PCR Testing and Associated Percent Positivity March 1, 2020 – August 1, 2021. |
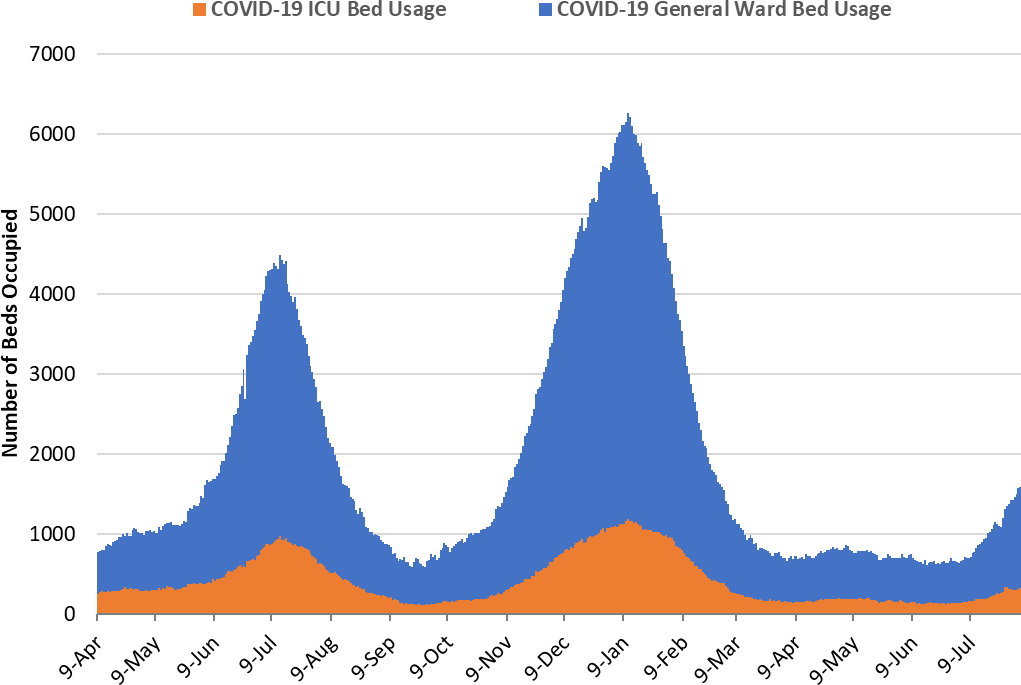
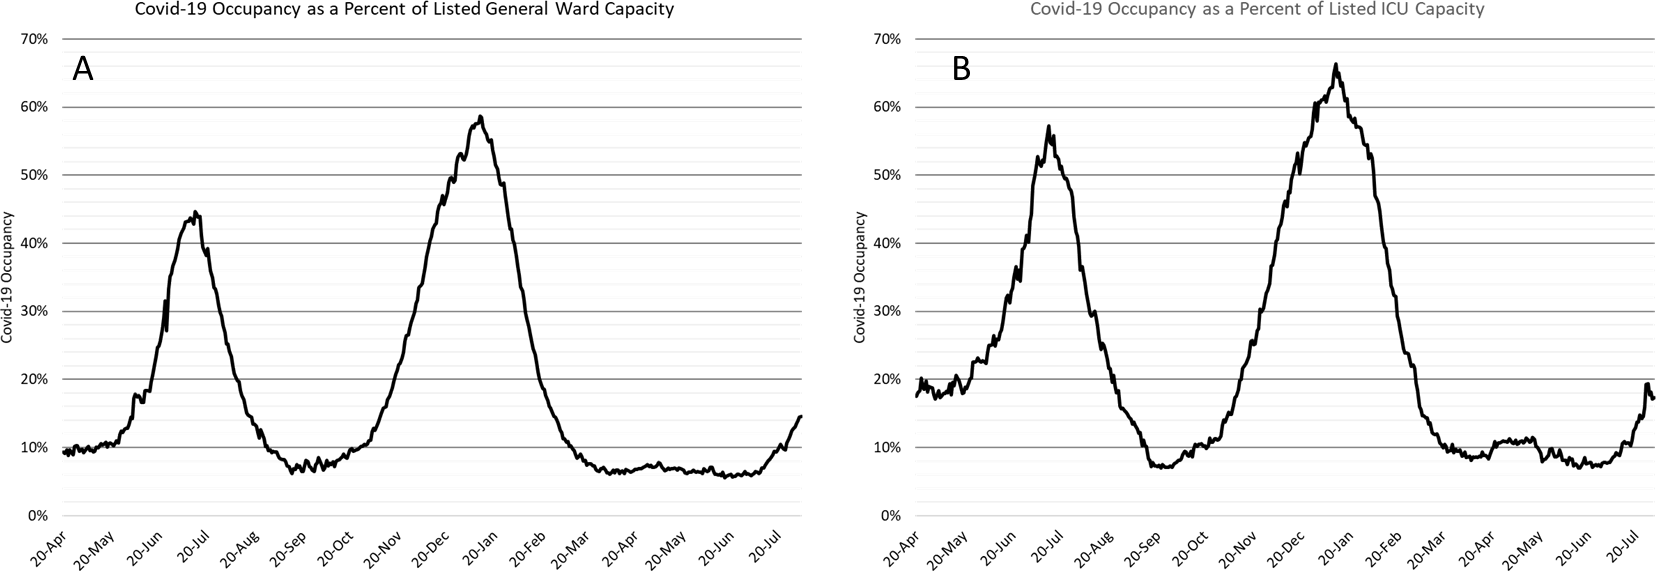
As of Aug 4th, 1266 (15%) of Arizona’s 8667 general ward beds were occupied by Covid-19 patients, a 24% increase from the previous week’s 1019 occupied beds (Figure 4 and Figure 5 Panel A). Another 887 (10%) beds remained available for use. The number of available beds is lower than the previous week’s 964 beds.
|
Figure 4. Arizona Daily Covid-19 General Ward and ICU Census April 9, 2020 – August 4, 2021. |
As of August 4th, 321 (22%) of Arizona’s 1722 ICU beds were occupied with Covid-19 patients, a 4% decrease from the prior week’s count of 335 patients (Figure 4 and Figure 5 Panel B). An additional 175 (10%) ICU beds remained available for use, lower than last week’s 186 beds.
|
Figure 5. Covid-19 Occupancy as a Percent of Listed General Ward (A, left) and ICU (B, right) Capacity in Arizona April 20, 2020 – August 4, 2021. |
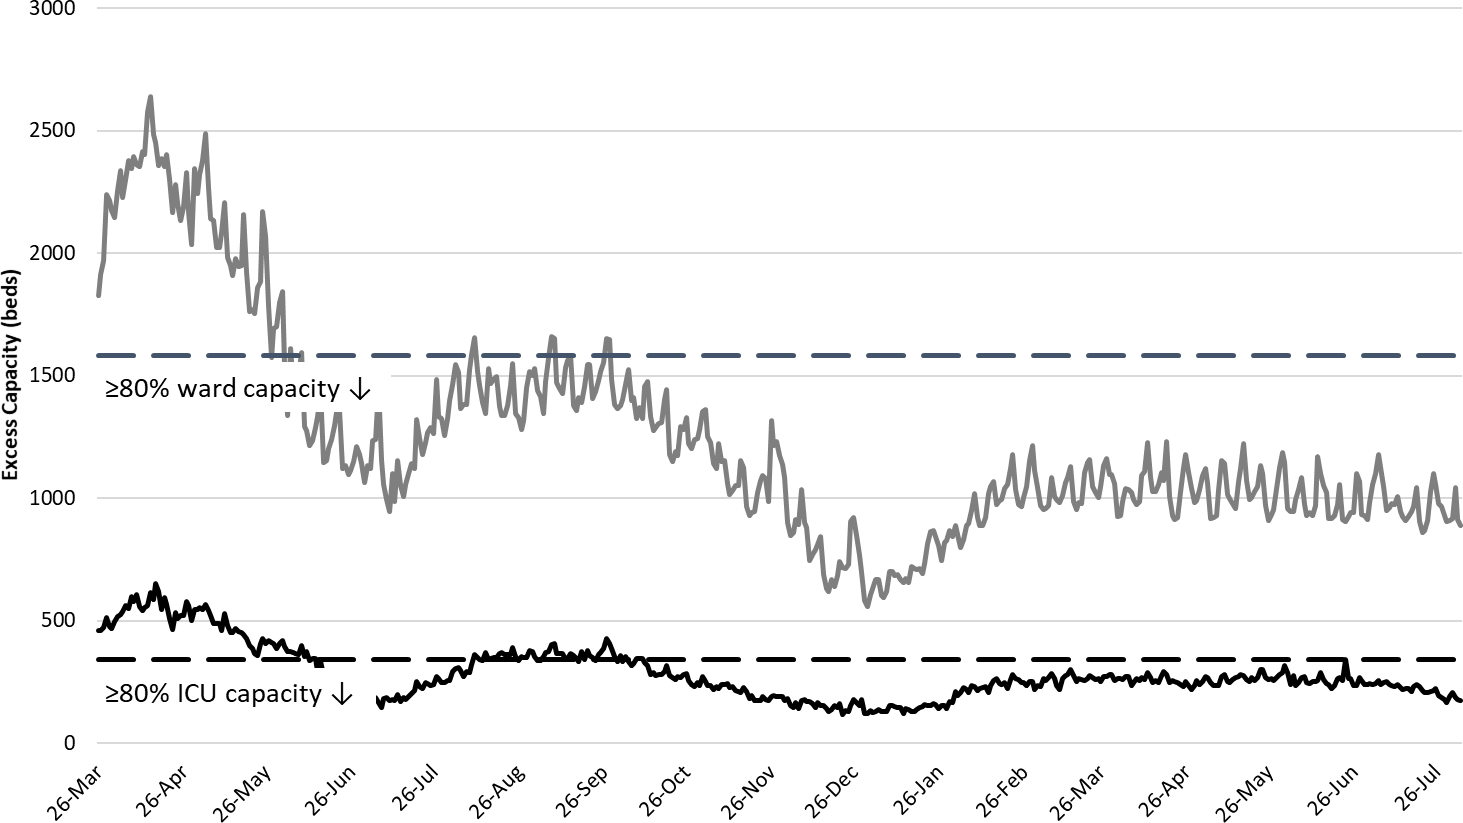
Arizona hospital occupancy remains above seasonal levels. Improvements in ward and ICU occupancy remain stalled at ≥85% occupancy (Figure 6). Undoubtedly, some medically necessary procedures that were previously postponed are still being rescheduled to address the backlog of care. Occupancy will need to fall 70- 75% before conditions will be back to “normal.” However, hospitals should be prepared for >15 -20% COVID-19 occupancy for the foreseeable future as viral transmission remains high.
|
Figure 6. Observed Excess Non-Surge General Ward and ICU Capacity March 26, 2020 – August 4, 2021. |
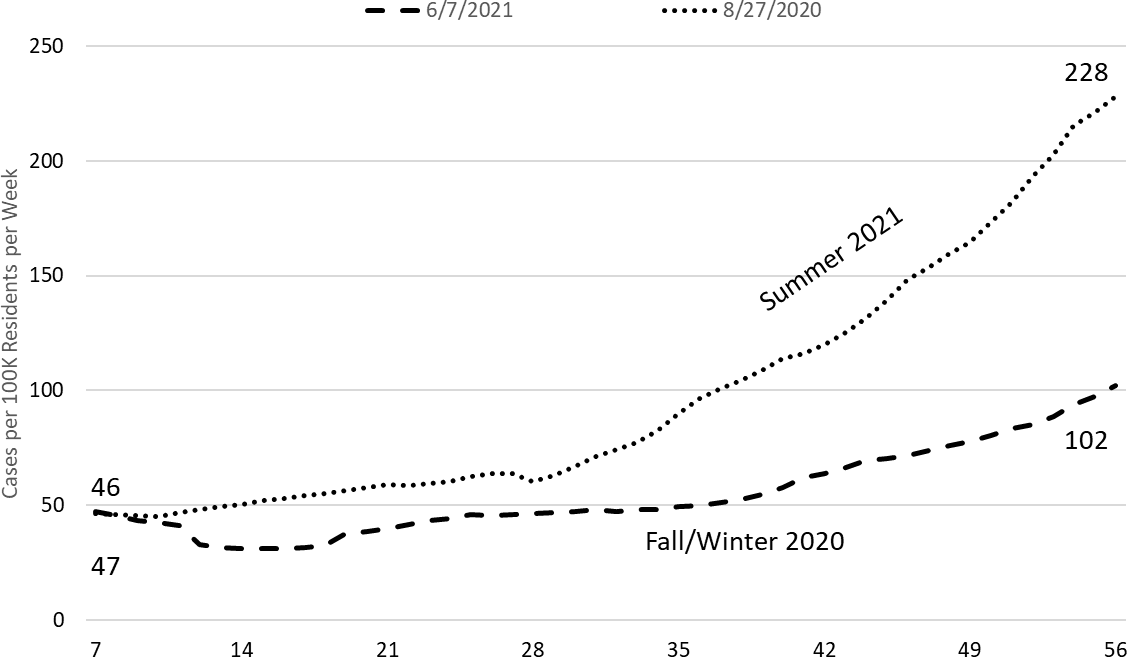
Now is an appropriate time to compare this outbreak with prior ones. As it happens, the most apt comparison is to the most recent winter 2021 outbreak. By my assessment, the current outbreak can be traced back 65 days to May 29, 2021 (Figure 7a). Similarly, the winter 2021 outbreak had its origin on September 5, 2020. By superimposing these two outbreaks, the similarities between the two become apparent (Figure 7b).
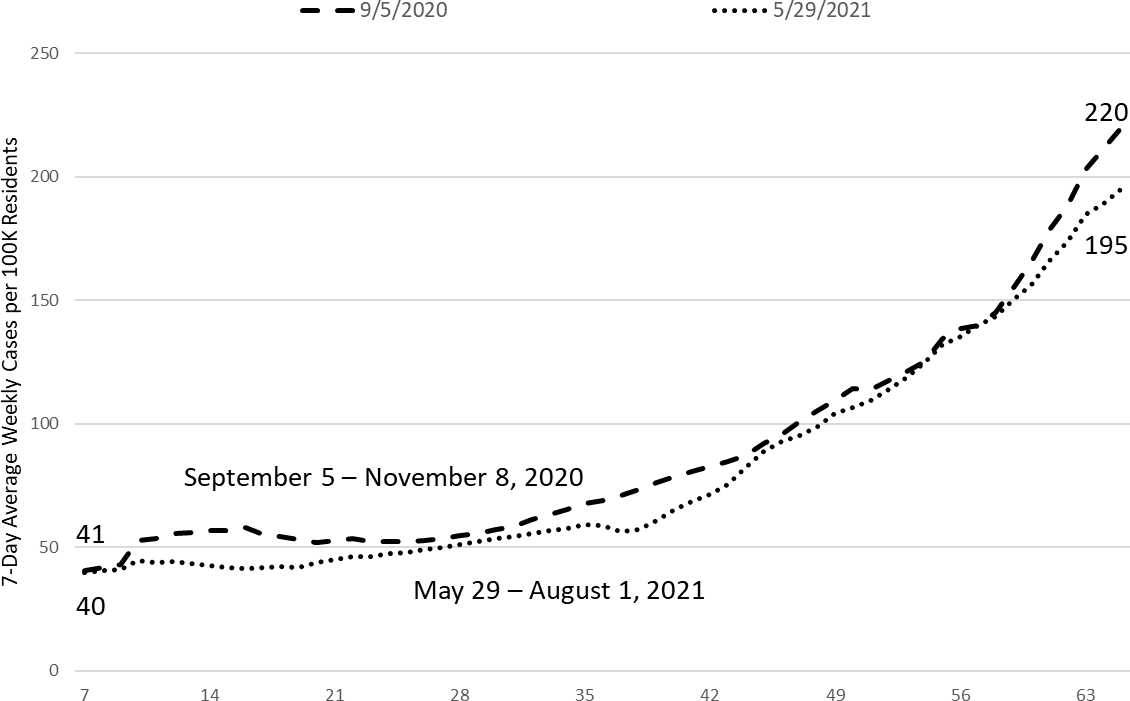
At the beginning of both, the 7-day moving average of new diagnoses was 40 cases per 100K residents per week. Sixty-five days later, the rates for the winter 2020 and summer 2021 outbreaks were 220 and 195 cases per 100K residents per week, respectively. While these two curves may diverge, it would be prudent to assume they won’t unless we intervene to slow transmission. Unfortunately, we are squandering the efforts of the vaccinated and ignoring the sacrifices of the previously ill and dead, to party like it was 1999.
|
Figure 7a. 7-Day Moving Average of COVID-19 Incidence in Arizona by March 2020 – August 1, 2021. |
|
Figure 7b. 7-Day Moving Average of COVID-19 Cases Rates 7 - 65 Days post Start of COVID-19 Waves (Fall 2020 and Summer 2021 Superimposed). |
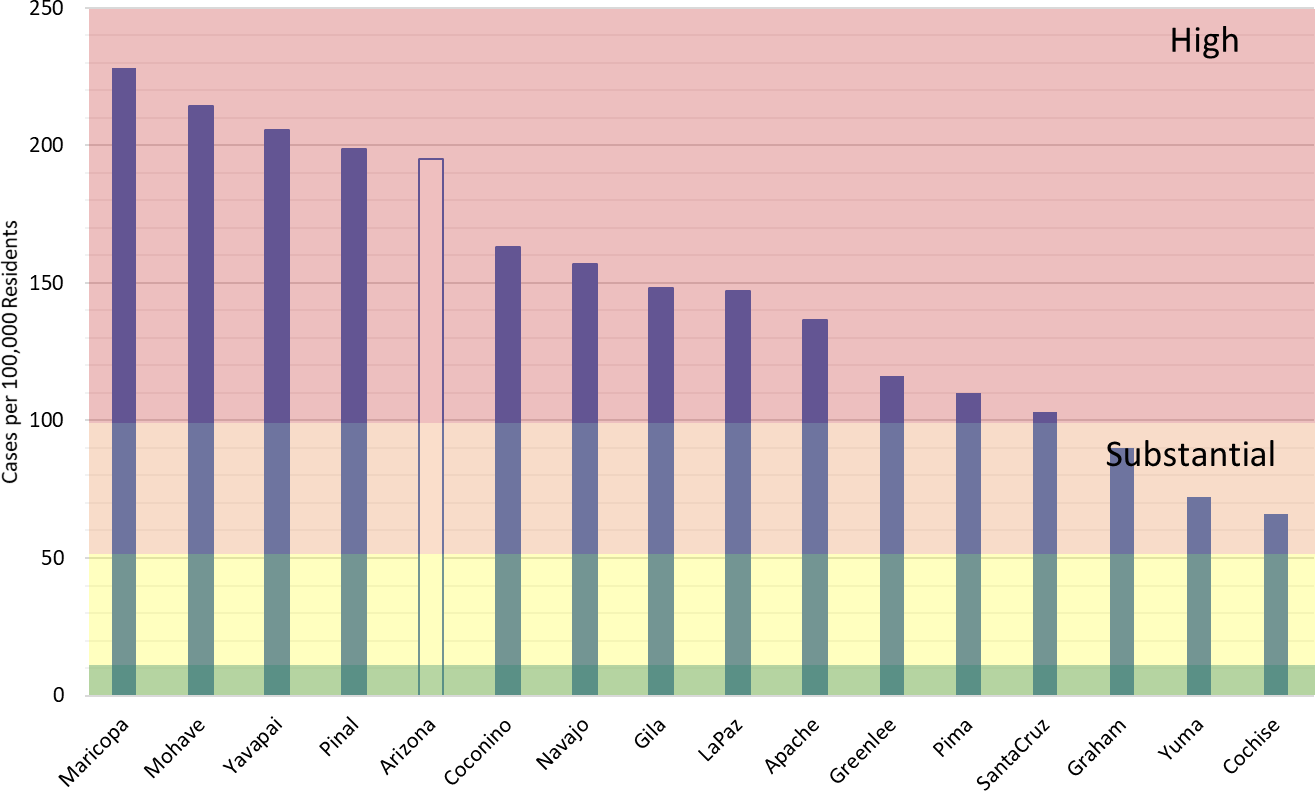
It is also important to point out that the data as presented here hide the heterogeneity that exists across counties (Figure 8a). Currently, Maricopa County is leading the pack with a case rate of 228 cases per 100K residents per week, while Pima County is experiencing 110 cases per 100K residents per week. Maybe a UA- alum should erect an opposing I-10 billboard from Phoenix to Tucson to keep score! If I were a Phoenician, I would be a bit worried as Maricopa County is well ahead of its fall/winter pace (Figure 8b).
|
Figure 8a. Covid-19 Weekly Incidence in Arizona by County July 25 – Aug 1, 2021 (Risk bands coincide with CDC recommendations for K – 12 schools’ instructional mode). |
|
Figure 8b. 7-Day Moving Average of COVID-19 Cases Rates 7 - 65 Days post Start of COVID-19 Waves (Fall 2020 and Summer 2021 Superimposed, Maricopa County). |
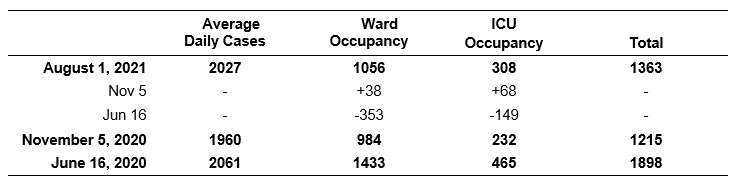
Another way to compare the pace of outbreaks is to consider how many hospital and ICU beds were occupied at similar levels of transmission. The best comparison to where we are now (August 1, 2021) is November 5, 2020 and June 16, 2020. The 7-day moving average of daily new diagnoses were 2027, 2061, and 1960, respectively. The corresponding levels of hospital and ICU occupancy (not new admissions) on those dates is presented in Table 1.
|
Table 1. Average Daily Cases, Ward Occupancy, and ICU Occupancy during Prior COVID-19 Outbreaks in Arizona |
In summary, current levels of hospital and ICU occupancy are similar to or slightly ahead of those of the winter 2021 outbreak (+38 and +68, respectively) but well below the levels seen in the summer 2020 outbreak (-353 and -149, respectively). Therefore, current community transmission is impacting hospitals similarly to how it did this past winter despite a high degree of vaccine update among those >65 years. Because herd immunity applies to populations not age groups, high vaccination rates among those >65 years doesn’t provide any protection to those who interact with unvaccinated adults who have much lower levels of vaccination. So, we should not hold a false sense of security that this outbreak will necessarily have less impact on our already overburdened hospital system.
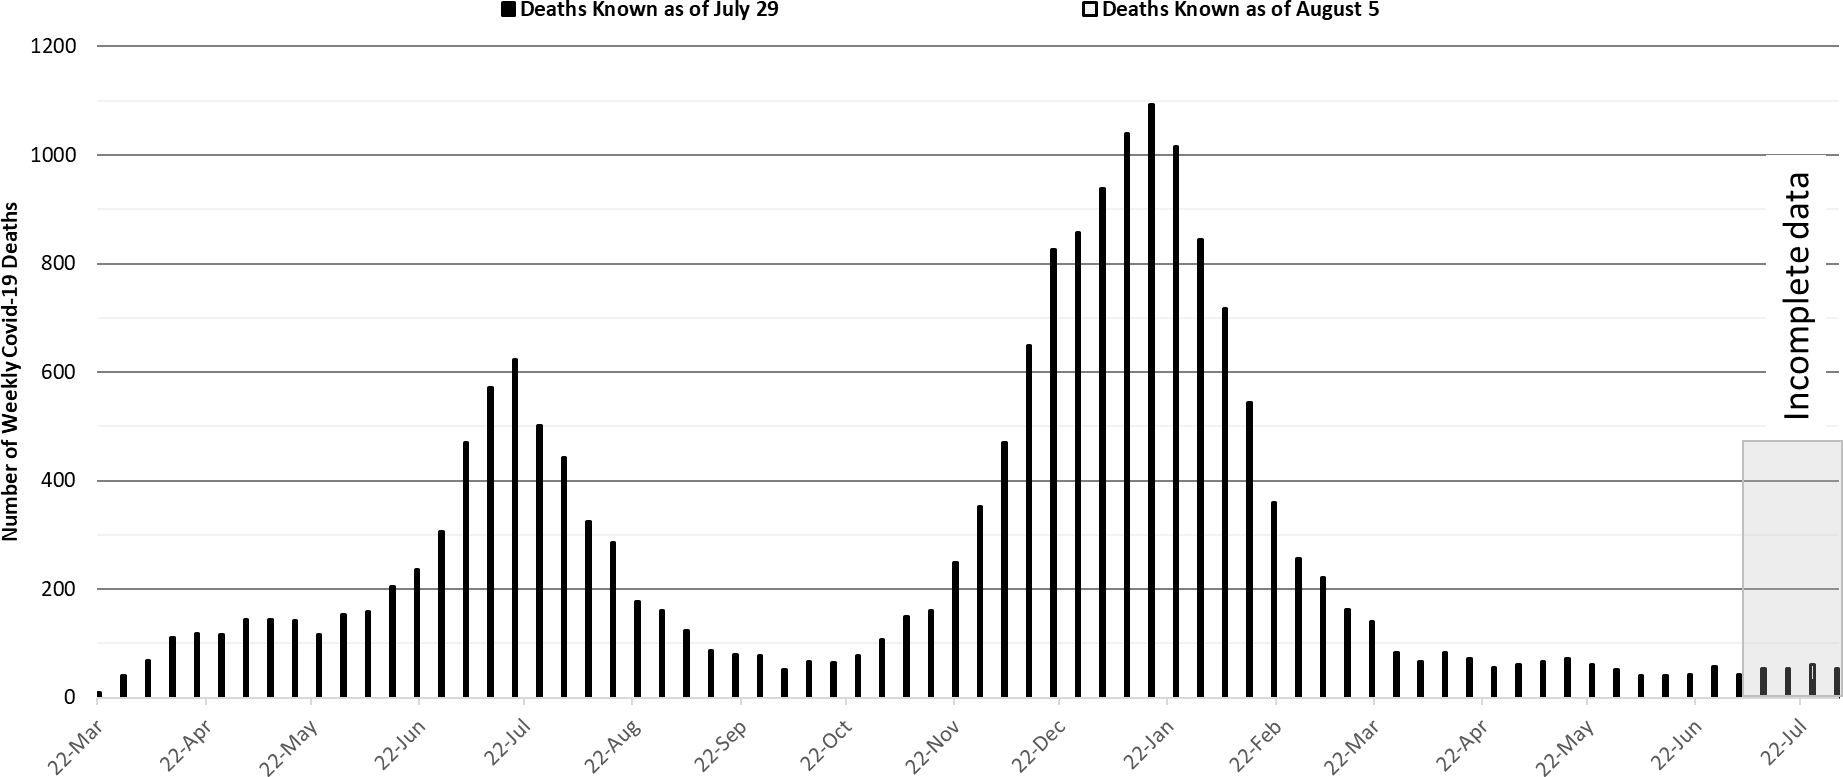
The week ending January 17, 2021 remains Arizona’s deadliest with 1093 deaths (Figure 9). Weekly deaths now tally about 50 and are expected to rise with increased case rates, meaning in 3 – 4 weeks Arizona could be experiencing >100 deaths per week.
|
Figure 9. Weekly Arizona Covid-19 Deaths March 16, 2020 – August 1, 2021. |
Pima County Outlook
For the week ending July 25th, 1151 Pima County residents were diagnosed with Covid-19 (Figure 10). This is a 59% increase from the 722 cases initially reported last week.
|
Figure 10. Covid-19 Cases and Individuals Undergoing Testing in Pima County Mar 1, 2020 – August 1, 2021 |
New cases are being diagnosed at a rate of 110 cases per 100K residents per week. This rate is increasing by 39 cases per 100K residents per week. Pima County’s rates remain lower than the state average. Trends across the various age groups appear in Figure 11.
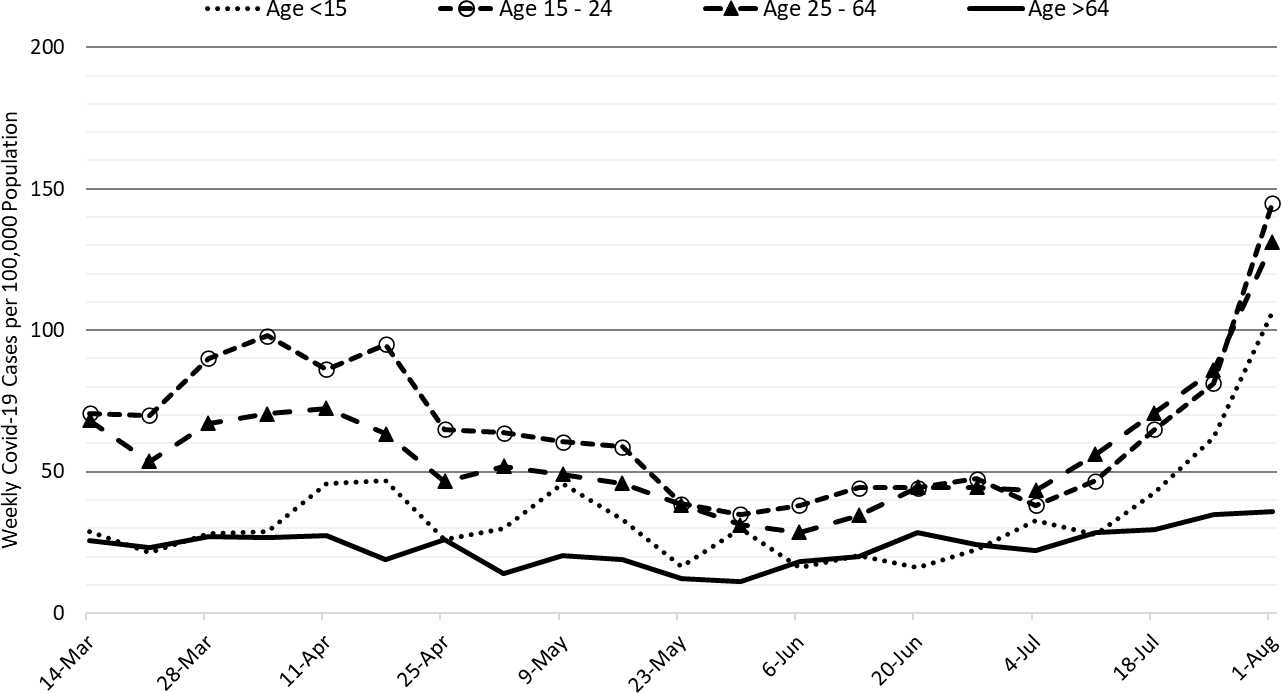
|
Figure 11. Covid-19 Cases by Age Group in Pima County from March 14 – August 1, 2021. |
Summary
- This past week saw another marked increase in viral transmission. Arizona is now experiencing high levels of transmission that will be sustained for weeks to come. This outbreak will almost certainly be as big as the one experienced in summer of 2020. While I am optimistic it will not reach the levels seen in the winter of 2021, the experience of other similar states (e.g., Louisiana, Florida, and Texas) suggests this could be wishful thinking.
- As of August 1st, new cases were being diagnosed at a rate of 195 cases per 100,000 residents per week. The rate is increasing at 51 cases per 100,000 residents per week. Another wave of cases and hospitalizations, caused by the increasing prevalence of the Delta variant is now certain. The Delta variant now accounts for >75% of all cases.
- Vaccination remains the most important public health priority to reduce viral transmission and severe illness; however, in the short-term only mask mandates, restrictions on indoor gatherings in public settings, and perhaps some targeted business restrictions will reduce the marked increases in transmission we are now experiencing.
- Resumption of in-person instruction in K – 12 schools and universities in August will lead to frequent school-associated outbreaks and will undoubtedly increase community transmission without vaccine or mask mandates, weekly surveillance testing, and adequate ventilation. The transmissibility of the Delta variant combined with high levels of transmission among adults will essentially force transmission among children. While case/contact investigations should continue, by themselves, they will not slow transmission in any meaningful way. The serial interval is simply too short, cooperation among the public too low, and the quarantine restriction too loosely enforced.
- Hospital COVID-19 occupancy is increasing and is likely to exceed 15% of all beds in the general ward and 20% of beds in the ICU for many weeks. Access to care remains somewhat restricted as occupancy remains unseasonably high. Once again, elective procedures are likely to be postponed.
- There is no evidence that existing vaccination levels will meaningfully blunt the impact of community transmission on hospitals. Hospitals should (and likely are) preparing for another meaningful surge that will strain staffing in critical care areas.
- Arizona is now experiencing 50 deaths per week. This amount will increase in the coming weeks and will almost certainly exceed 100 per week by the end of August.
- According to the CDC, 56% of Arizona adults have received at least 2-doses of vaccine while another 9% have received 1-dose.
- Despite evidence of limited immune escape to the Delta variant, especially before completion of the full vaccination sequence, vaccination continues to provide extraordinarily high levels of protection from severe illness.
- The CDC revised its mask guidance for vaccinated individuals in part due to a large outbreak in Massachusetts where the majority of cases was among fully vaccinated residents. Fully vaccinated individuals should mask when indoors in public spaces where community transmission is high or substantial. If exposed to a known case, individuals should be tested in 3 – 5 days regardless of symptoms and wear a mask for 14 days post-exposure.
Forecast reports to date, available as PDFs
Download PDF to view additional charts of Arizona counties, available in appendix of report.
August 6
2020 Reports
Based on what we know now about this pandemic, we support guidelines for social distancing to slow the spread of the virus and urge everyone to follow the recommendations provided by the Centers for Disease Control and Prevention (CDC) to protect yourself, your family, your neighbors, and your employees. Please heed the recommendations as provided by the CDC.
COVID covid coronavirus virus covid19 corona forecast model