


Note this forecast page is not the most recent forecast available.
View the most current forecast report
Researcher Develops Arizona Forecast Model of COVID-19 Spread For Decision-Makers
The following information regarding the spread of COVID-19 in Arizona was prepared by Joe Gerald, MD, PhD, a researcher at the Mel and Enid Zuckerman College of Public Health (MEZCOPH) at the University of Arizona. This information has also been reviewed by other MEZCOPH faculty.
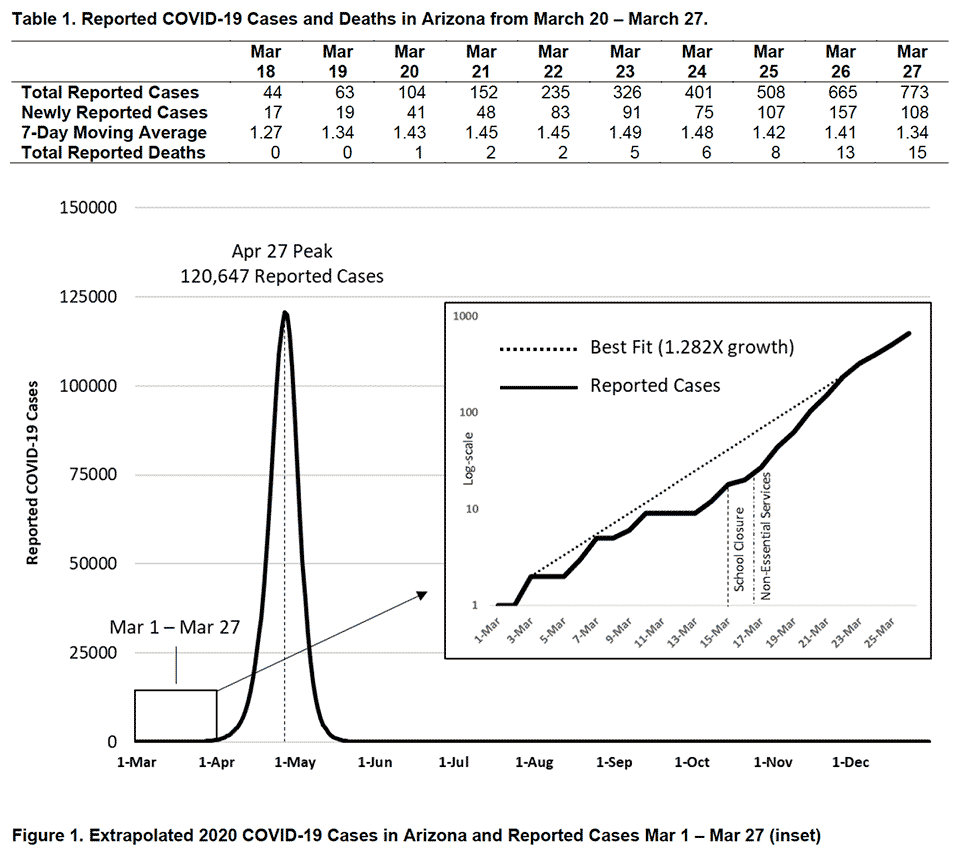
Figure 1 below depicts growth in reported cases of COVID-19 in Arizona. These data were obtained from the Arizona Department of Health Services COVID-19 webpage and reflect conditions in Arizona as of March 27, 2020.
This information is intended to help guide our response to the outbreak. It is not intended to predict how this pandemic will evolve. Rather, this model extrapolates what might occur if current conditions remain unchanged. As regional authorities and healthcare providers respond, their actions are expected to mitigate the worst consequences of this pandemic.
COVID-19 Disease Outbreak Forecast
Arizona State and Pima County
Updated March 28, 2020
As of March 27th, 773 COVID-19 cases and 15 deaths have been reported in Arizona (Table 1). On average, the reported case count has been doubling every 2.5 days. If sustained, the number of reported cases will peak in late April resulting in 22% (1.6 million) Arizonans testing positive (Figure 1). Many more with milder disease will remain undiagnosed. Because reported cases have been increasing faster than projected in the March 17 Update, 1.28X versus 1.20X per day, the peak is now expected to occur 3-weeks earlier and include a greater number of reported cases. Even if some of this increase is attributable to more diagnostic testing, we should still be concerned that our social distancing efforts are not sufficiently “flattening the curve” to ensure hospital care is available to all who will need it. A proprietary, unvalidated Social Distancing Scoreboard suggests Arizonan’s have responded to current measures by decreasing their daily distance traveled by 26%, but this reduction may not be enough.
Pima County
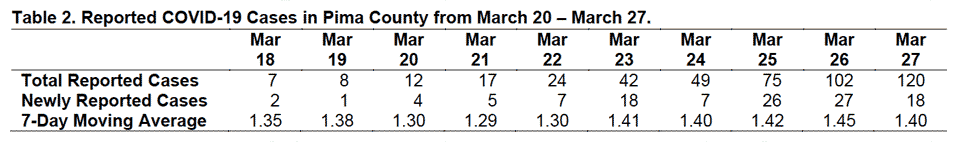
As of March 27, 120 COVID-19 cases have been reported in Pima County (Table 2). Recent growth in Pima County has also occurred faster than projected in the March 17 Update, 1.29X per day versus 1.20X.
Understanding What Went Wrong
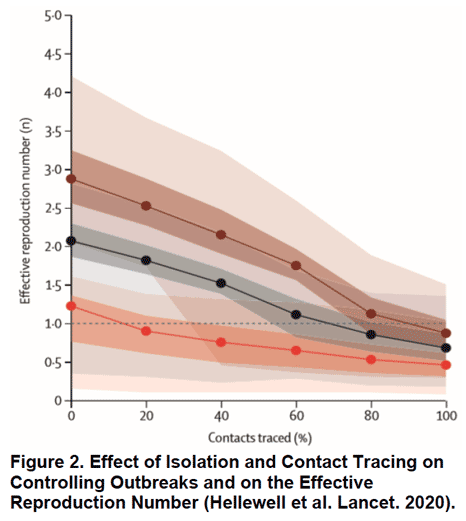
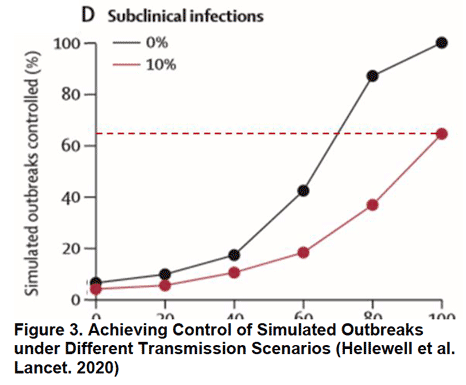
Besides the failure of too few coronavirus tests, why has America’s public health response been so ineffective? Two recent simulations provide important clues. The first examined the gold standard response to emerging outbreaks: case identification, contact tracing, and quarantine of cases. It estimated how effective contact tracing would have to be to stop travel-related cases from causing local transmission given various viral, public health, and outbreak factors. Based on an estimated viral transmissibility of R0 = 2.5, contact tracing would have needed to be nearly flawless (80% of all contacts traced) to effectively squelch outbreaks. However, if at 10% of cases were asymptomatic, then even perfectly executed contact tracing would have failed to stop 35% outbreaks (Figure 3). Emerging evidence suggests that 20% of COVID-19 infections could be asymptomatic. If accurate, these models suggest contact tracing wouldn’t have necessarily stopped the US outbreak unless combined with more restrictive social distancing measures and travel restrictions.
These results suggest that the US’s initial strategy of case identification and quarantine alone was unlikely to succeed because SARS-CoV-2 is highly transmissible and asymptomatic cases are prevalent. Perhaps these limitations could have been overcome had more tests been available, but this is not certain. Current anecdotal reports (here and here) suggest that PCR testing is only 70% sensitive meaning 30 out of every 100 patients with COVID-19 could be missed when tested. This also helps explain why patients with classic symptoms, chest X-ray, and CT findings may need to be re-tested if their initial test is negative.
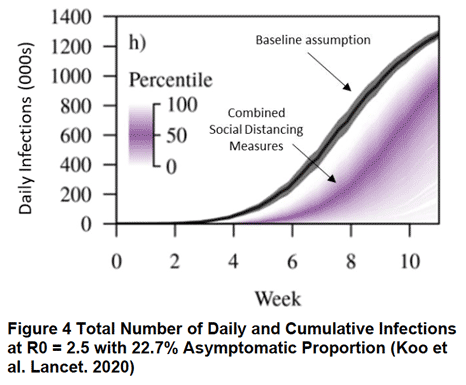
The second model examined the effectiveness of a 2-week bout of social distancing on an established outbreak where local transmission is occurring. Social distancing measures included: quarantining cases and family members, quarantining cases and family members plus closing schools, quarantining cases and family members plus closing non-essential businesses or combining all 3 measures. Assuming viral transmissibility was R0 = 2.5 and 22.7% of infections were asymptomatic, simple contract tracing and quarantine of family members would only reduce 13% of future transmissions. Adding school closures yielded minimal additional reductions. Adding work closures increased social distancing’s effectiveness and reduced 22% of future infections. Because school closures had minimal impact, combining all 3 measures did not achieve significant reductions over quarantine plus work closures (Figure 4). The finding that school closures had little impact bears further consideration given that attack rates appear to be similar in adults in children.
This second simulation reinforces the notion that COVID-19 is difficult to control because of its ease of transmission and its high number of asymptomatic cases. For these reasons, sustained social distancing over several months may be required to contain this outbreak; otherwise, our sacrifices will not “flatten the curve” and preserve our ability to treat all who need it.
In summary,
- With a high reproductive number (R0 = 2.5), SARS-CoV-2 is a highly capable adversary that will severely punish any delays or mistakes in our public health response.
- With up to 20% of SARS-CoV-2 infections being asymptomatic, the virus has stealth capabilities that will make the infections we don’t see more dangerous than one’s we do.
- With our public health response hampered by severe testing limitations, our medical response hampered by too few effective treatments, hospital beds, and ventilators, and our ponderous vaccine development timeline, we are way behind the technology curve.
- Traditional public health responses like contact tracing plus quarantine and/or temporary social distancing are unlikely to control this particularly challenging outbreak of the novel SARS-CoV-2 virus.
The next update is scheduled for April 2.
March 22, COVID-19 Arizona Forecast
Based on what we know now about this pandemic, we support guidelines for social distancing to slow the spread of the virus and urge everyone to follow the recommendations provided by the Centers for Disease Control and Prevention (CDC) to protect yourself, your family, your neighbors, and your employees. Please heed the recommendations as provided by the CDC, found at the following website: https://www.cdc.gov/coronavirus/2019-ncov/prepare/prevention.html
COVID covid coronavirus virus covid19 corona