


Note this forecast page is not the most recent forecast available.
View the most current forecast report
Researcher Analyzes Arizona COVID-19 Spread Models for Decision-Makers
The following information regarding the spread of COVID-19 in Arizona was prepared by Joe Gerald, MD, PhD, a researcher at the Mel and Enid Zuckerman College of Public Health (MEZCOPH) at the University of Arizona. This information has also been reviewed by other MEZCOPH faculty.
This data were obtained from the Arizona Department of Health Services COVID-19 webpage and reflect conditions in Arizona as of July 31, 2020.
This information is intended to help guide our response to the outbreak. It is not intended to predict how this pandemic will evolve. Rather, this model extrapolates what might occur if current conditions remain unchanged. As regional authorities and healthcare providers respond, their actions are expected to mitigate the worst consequences of this pandemic.
COVID-19 Disease Outbreak Forecast
Arizona State and Pima County
Updated July 31, 2020
Disclaimer: This information represents my personal views and not those of The University of Arizona, the Zuckerman College of Public Health, or any other government entity. Any opinions, forecasts, or recommendations should be considered in conjunction with other corroborating and conflicting data. Updates can be accessed at https://publichealth.arizona.edu/news/2020/covid-19-forecast-model.
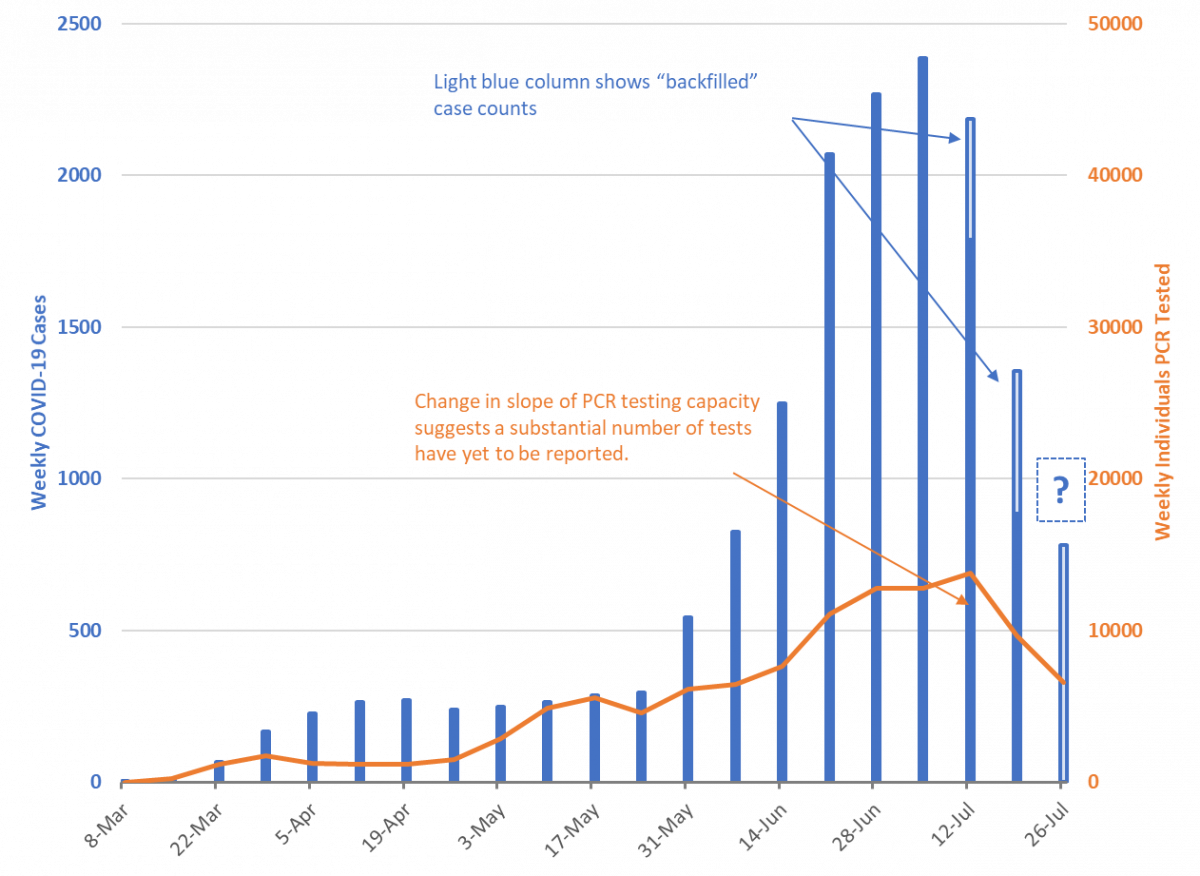
For the week ending July 26th, 8917 new Covid-19 cases were diagnosed in Arizona (Figure 1). However, this tally likely undercounts the actual number of new cases owing to persistent reporting delays. For example, last week’s tally has been revised from 10684 to 16263 cases this week, a 52% increase. Even the case count from two weeks ago (week ending July 12th) has been revised upwards by 13% this week. Despite these reporting delays, recent trends are consistent with waning viral transmission.
However, the magnitude of this decline should be viewed cautiously as the number of PCR tests being conducted has been stagnant for the past two weeks instead of increasing by 15 – 35% as previously observed. It remains unclear how much of the change in testing is attributable to shortages of critical supplies or personnel (supply side) versus fewer patients seeking care (demand side).
While testing results for this past week are still incomplete, the percent of patients testing positive has declined from a peak of 23% the week ending July 5th to 14% the week ending July 26th (Figure 2 following page). A declining test positive percentage in the face of stagnant testing supports slowing viral transmission. The seroprevalence percentage increased from 11% to 12% this week. The number of serology tests being conducted continues to decline from a peak of 20 thousand weekly tests to less than half that number now.
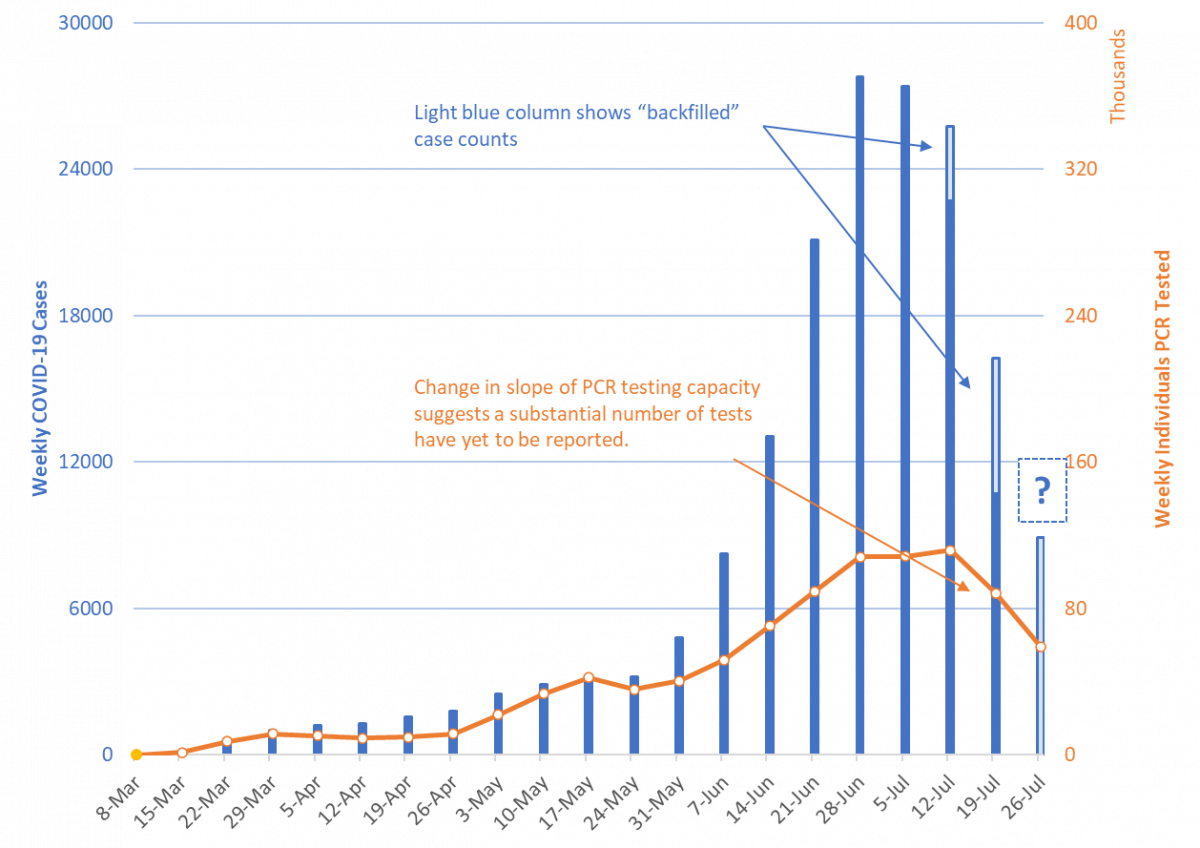
| Figure 1. Newly Diagnosed Covid-19 Cases in Arizona and Number of Individuals Undergoing PCR Testing March 1 through July 26. |
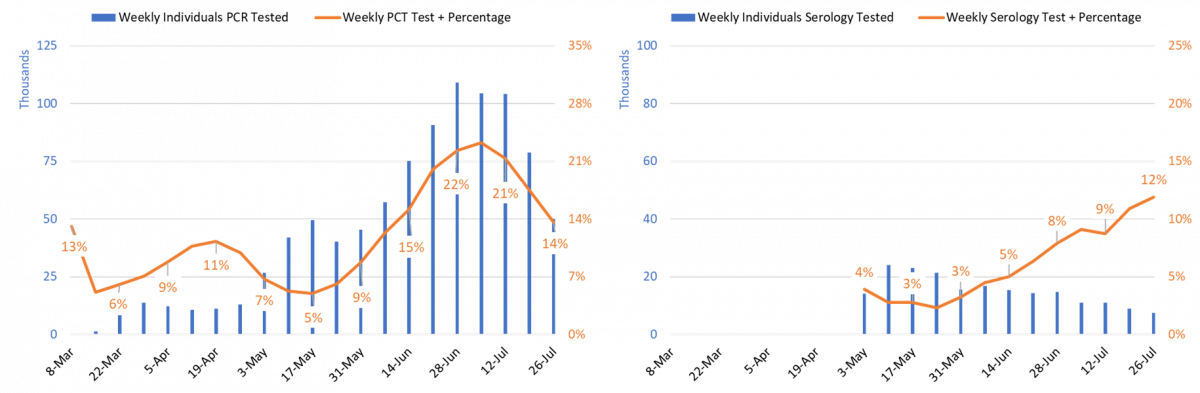
| Figure 2. Weekly Number Patients Tested and Percent of Individuals with Positive Covid-19 PCR and Serology Results March 1 - July 26. |
The 7-day moving average of doubling time for cumulative Covid-19 cases shortened from a peak of 29 days on May 25th to a trough of 12 days on June 21st (Figure 3). As of July 12th, it was 25 days. Because testing lag artificially lengthens doubling time, I am not displaying new case data through July 19th as I normally would. Despite backfilled data, the doubling time for cases is lengthening indicating generally improving conditions.
The doubling time for cumulative deaths has shortened from a high-water mark of 41 days on June 5th to a trough of 24 days on July 10th. As of July 12th, it was 26 days. Unfortunately, the pace of deaths has yet to clearly moderate.
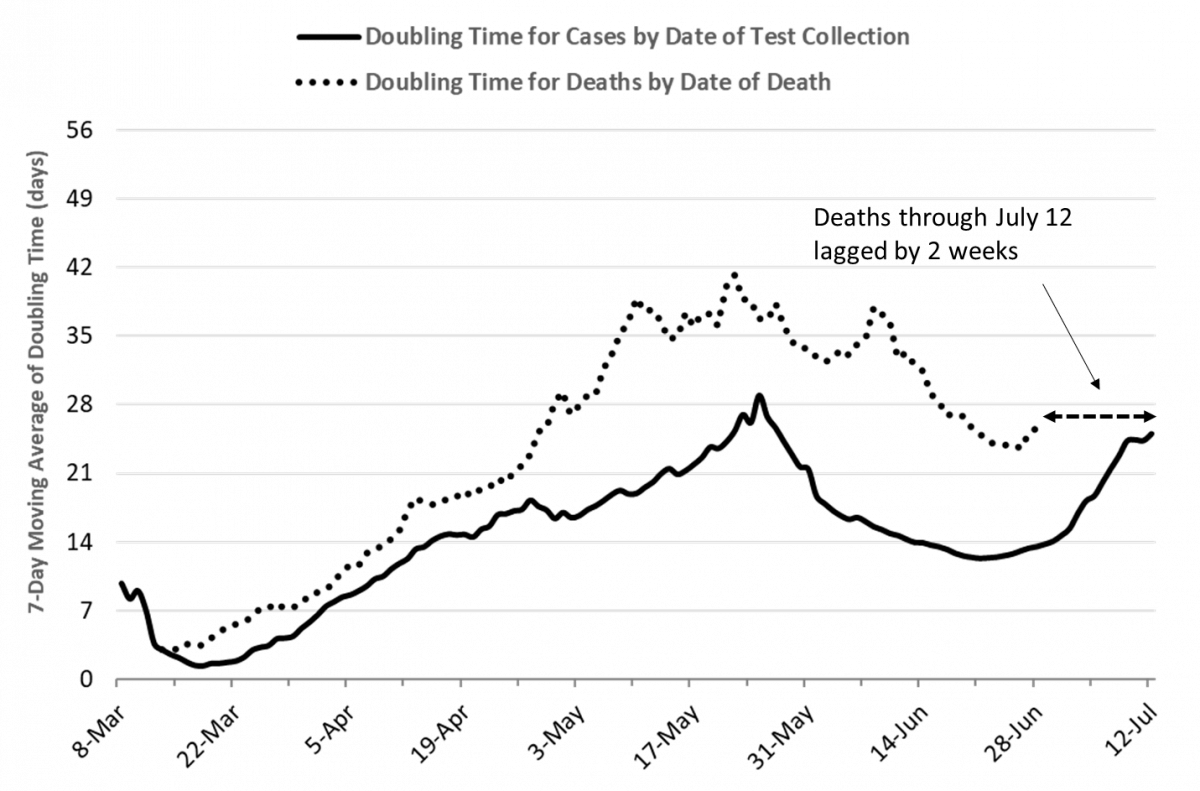
| Figure 3. 7-Day Moving Average of Doubling Time of Cumulative Cases through July 12 Superimposed on Lagged (2-week) Doubling Time of Cumulative Deaths through July 12. |
It is worth revisiting how the age-distribution of Covid-19 cases has changed since the last time I displayed this data. Figure 4 displays the cumulative crude and age-stratified Covid-19 incidence since the beginning of the outbreak. So far, the largest number of cases has been identified among those 20 – 29 years of age; however, the age-stratified incidence is a bit more evenly distributed among working-age adults than absolute case numbers would suggest. The disproportionate burden in age-stratified cumulative incidence among those 80+ years is likely attributable to outbreaks in long-term care facilities.
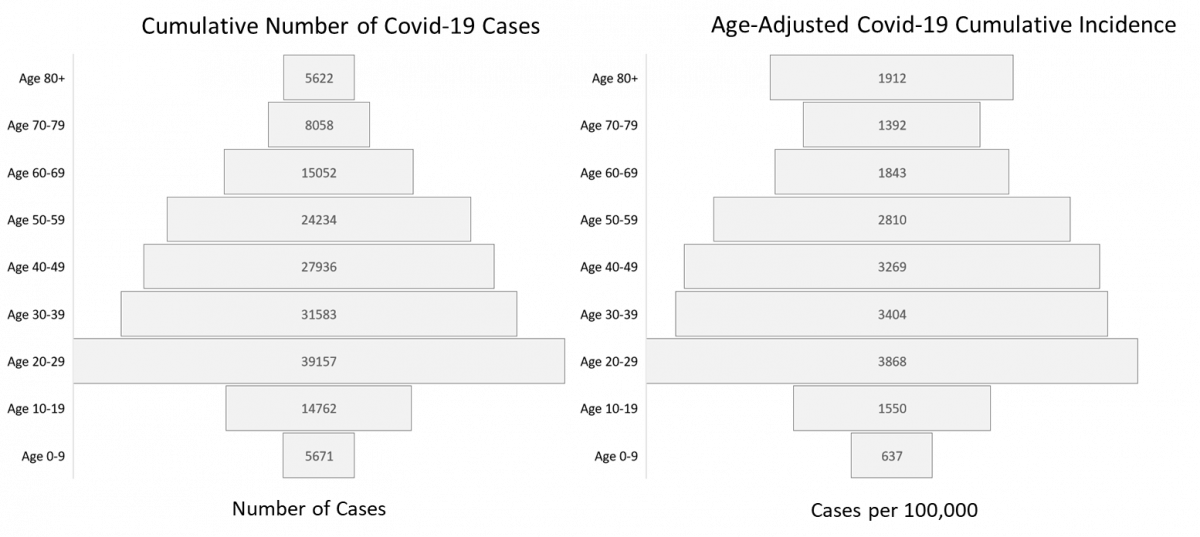
| Figure 4. Crude and Age-Stratified Cumulative Incidence of Covid-19 Cases through July 31, 2020. |
Growth in cumulative incidence from March 1 – May 24, May 24 – June 21, and June 21 – July 26 is displayed in Figure 5. As would be expected, growth in cumulative incidence has been greatest since June 21st.
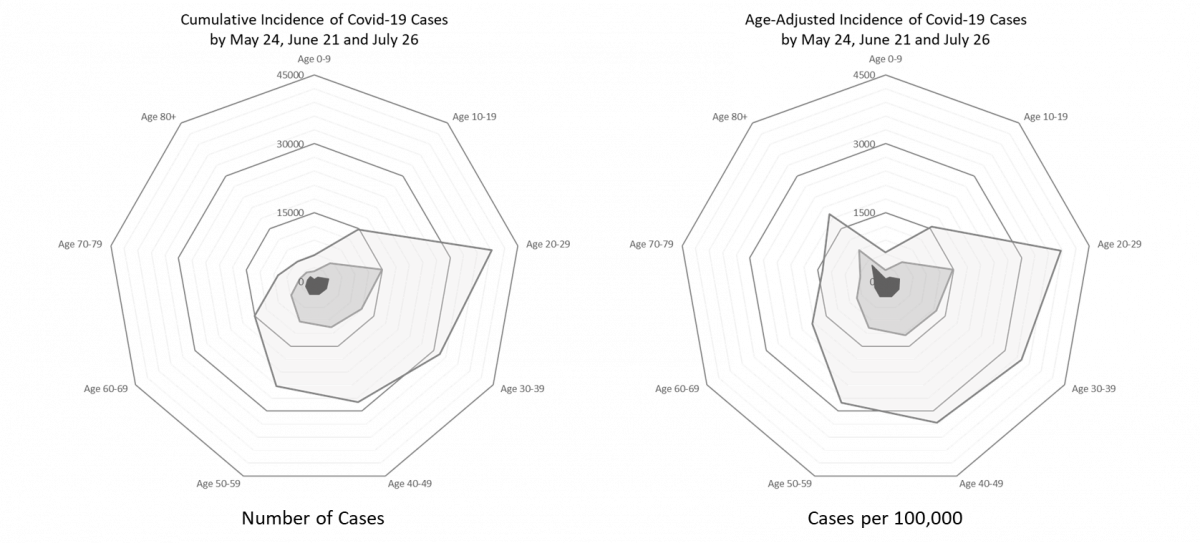
| Figure 5. Crude and Age-Stratified Cumulative Incidence of Covid-19 Cases from March 1 – May 24, May 24 – June 21, and June 21 – July 26. |
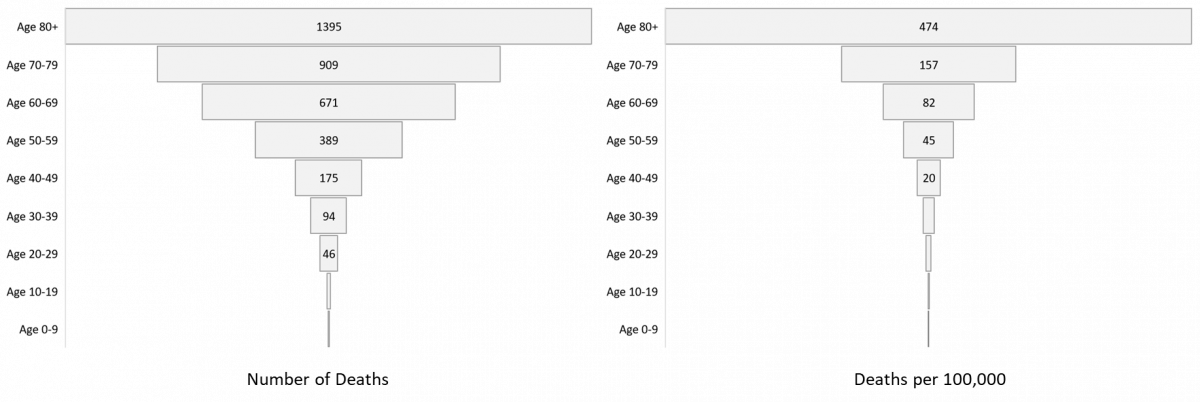
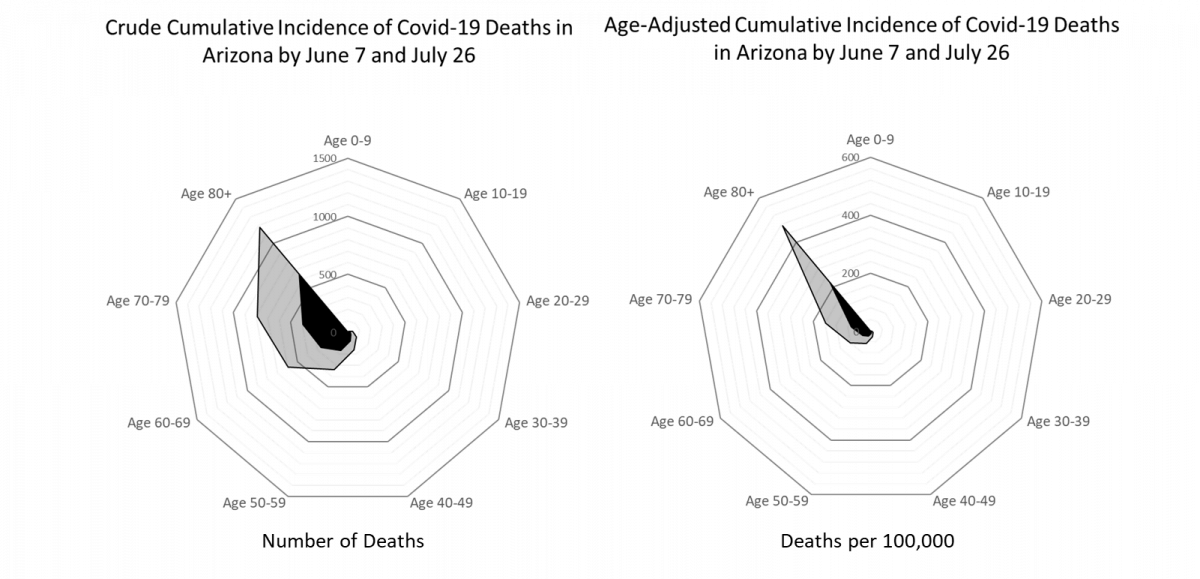
| Figure 6. Crude and Age-Adjusted Cumulative Incidence of Covid-19 Deaths through July 31, 2020. |
It is also worth revisiting how the age-distribution of Covid-19 deaths has changed over the course of the outbreak. The last time I displayed this data was the week ending June 7th. Figure 6 displays the cumulative crude and age-stratified incidence of Covid-19 deaths since the beginning of the outbreak. So far, the largest number of deaths has accrued among those 80+ years of age, this difference is even more dramatic when considering age-stratified incidence. It is worth noting that a relatively large absolute number of deaths has occurred among those <50 years of age indicating Covid-19 is not just a concern of the elderly.
Growth in cumulative incidence from March 1 – June 7 and June 7 – July 26 is displayed in Figure 7. As would be expected, growth in cumulative incidence has concentrated among those 60+ years of age.
| Figure 7. Crude and Age-Stratified Cumulative Incidence of Covid-19 Deaths through July 31, 2020. |
From a May 22 plateau to a July 13 plateau, total Covid-19 hospitalization increased 311% from 1093 to 4487 occupied beds (Figure 8). Since last week, total Covid-19 hospitalizations decreased 18% from 3600 to 2936 occupied beds. Hospitals should continue to experience declining Covid-19 occupancy over the coming weeks.
As of July 31st, 2226 (28%) of Arizona’s 7960 general ward beds were occupied by patients with suspected or confirmed Covid-19 infection, a 19% decline from last week. An additional 1324 (17%) beds remain available which is higher than last week’s 1266 beds. Similarly, 710 (41%) of Arizona’s 1731 ICU beds were occupied for
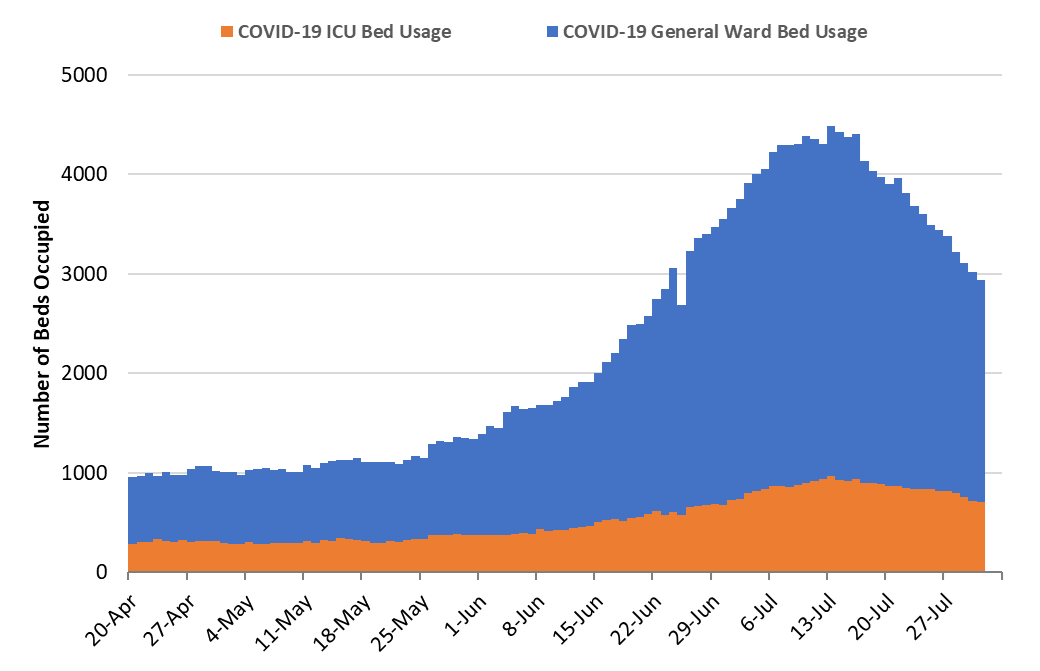
| Figure 8. Arizona Daily Covid-19 General Ward and ICU Census April 20 – July 31. |
Covid-19 care, a 16% decrease from last week. An additional 255 beds (15%) beds remain available which is higher than last week’s 243 beds.
Now that Covid-19 hospital occupancy is declining, Arizona will not exceed its listed capacity of non-surge general ward or ICU beds unless recent improvements reverse (Figure 9). Due to the longer length of stay for critically ill ICU patients, strain on general ward beds should be relieved sooner than strain on ICU beds. Similarly, regional referral centers may remain at or near capacity longer than other hospitals. A recent JAMA article suggests allowing our hospitals to exceed their normal capacities may have led to some preventable deaths as Covid-19 mortality was 3-times higher in hospitals with <50 ICU beds as compared to those with >100 beds. Under normal circumstances, some of these patients might have been transferred to regional referral centers.
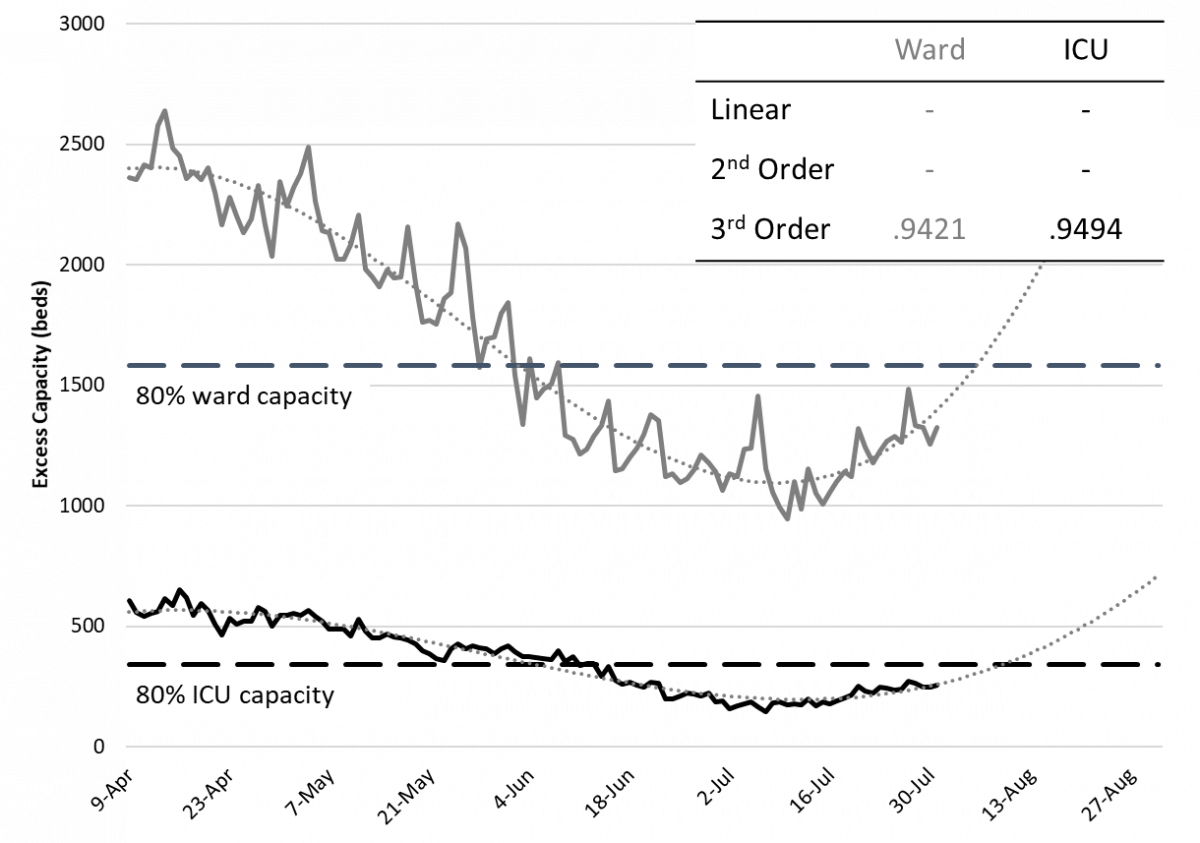
| Figure 9. Observed and Projected Excess Non-Surge General Ward and ICU Capacity Apr 20 – Aug 31. |
It is worth considering how bed occupancy might change as Covid-19 cases decline. While hospitals have been operating under crisis care standards, many elective procedures have been postponed. Hospital beds and/or “units” have also been repurposed to expand capacity. For example, surgical recovery units have been used to accommodate overflow thereby reducing the number of active operating rooms.
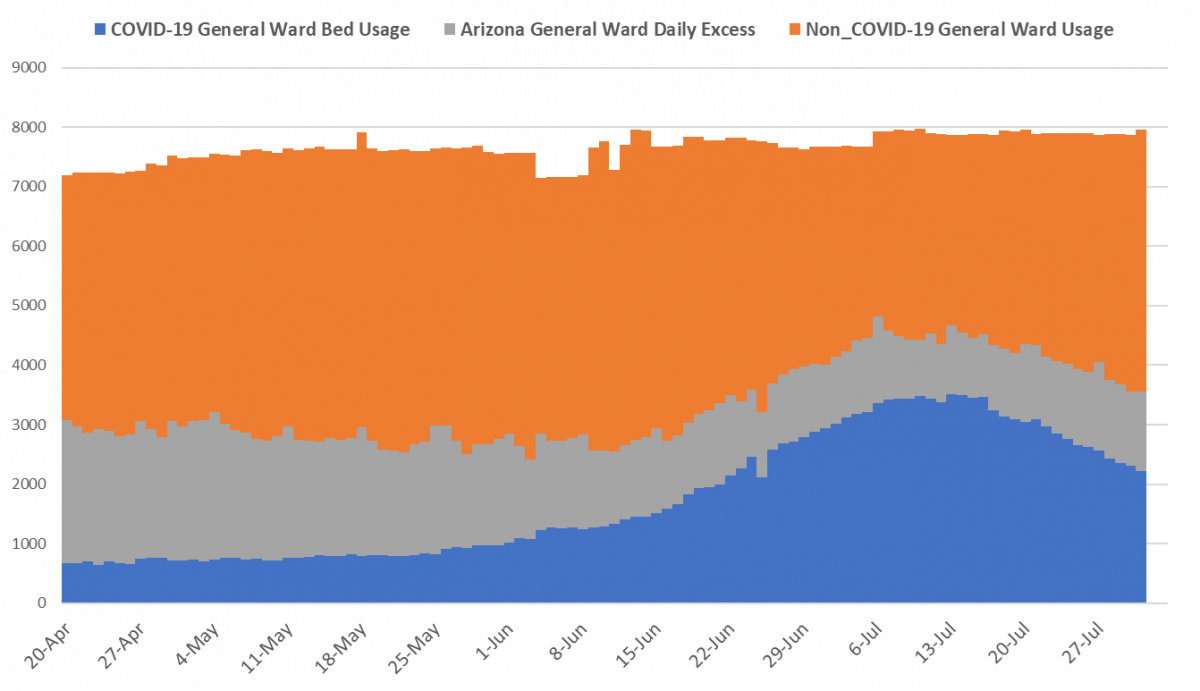
| Figure 10. Arizona Covid-19 General Ward Occupancy April 20 – July 31: Non-Covid Care (orange), Covid-19 care (blue) and Excess Capacity (grey). |
As Figure 10 shows, recent declines in Covid-19 occupancy (blue) have been counterbalanced by increasing non-Covid occupancy (orange), presumably due to non-critical care elective care. This means excess capacity will be restored more slowly than otherwise might be expected. More importantly, it alludes to the indirect harms that accrued while allowing Covid-19 cases to increase unchecked.
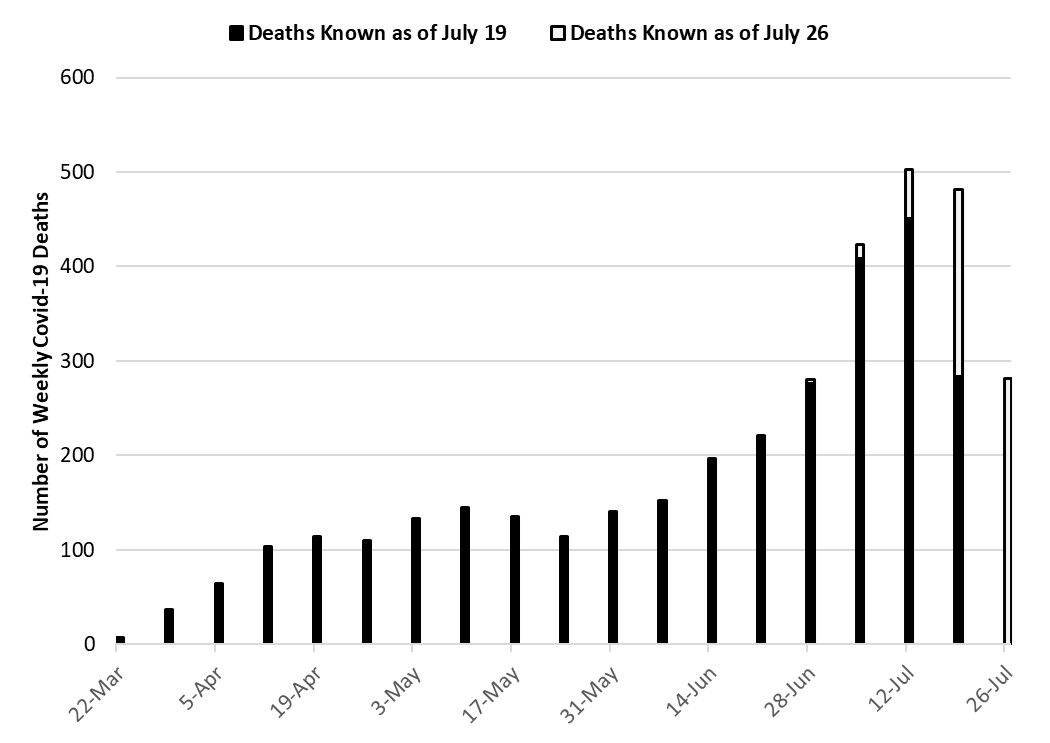
| Figure 11. Weekly Arizona Covid-19 Deaths March 1 – July 26 by Date of Death |
With 503 deaths reported to date, the week ending July 12th remains the week with the largest number of Covid-19 deaths to date (Figure 11). However, 481 deaths have already been reported for the week ending July 19th suggesting it may set a new record once additional deaths are reported.
To date, Arizona has recorded 3747 Covid-19 deaths. A recent JAMA article estimated excess fatality in Arizona through May 30th at 1800 deaths as compared to 846 reported deaths. After additional adjudication through July 31 is considered, Arizona has now recorded 1125 Covid-19 deaths through May 30th or 63% of the total excess. This suggests under-reporting of deaths during the early outbreak may yet bias year-end totals.
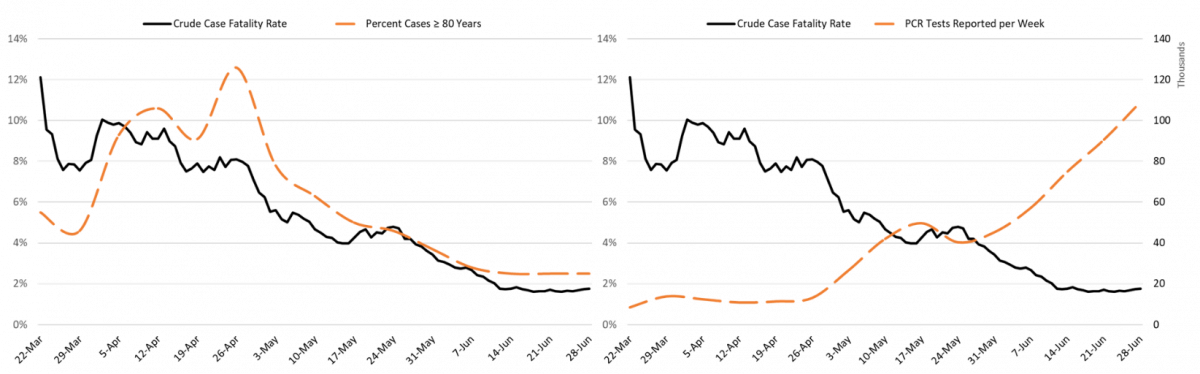
| Figure 12. Crude Covid-19 Case Fatality Rate March 22 – June 28 and Percent of Cases ≥ 80 Years of Age (left) and Number of Weekly PCR Tests (right). |
Arizona’s approximate case fatality rate (CFR) has been declining over time (Figure 12). As of June 28th, it was approximately 1.8% based on the 7-day moving average of cases divided by the 7-day moving average of deaths lagged 11 days. A number of factors can affect the CFR including the age distribution of infections and the number of tests being conducted. The correlation between CFR and tests performed is -0.78 and between CFR and percent of cases >80 years of age is 0.86 (Figure 12). When the age distribution of cases the week ending June 28ths is applied for all preceding weeks, the age-standardized CFR is lower than the crude CFR early in the outbreak when a disproportionate share of cases were among those 80+ years (Figure 13).
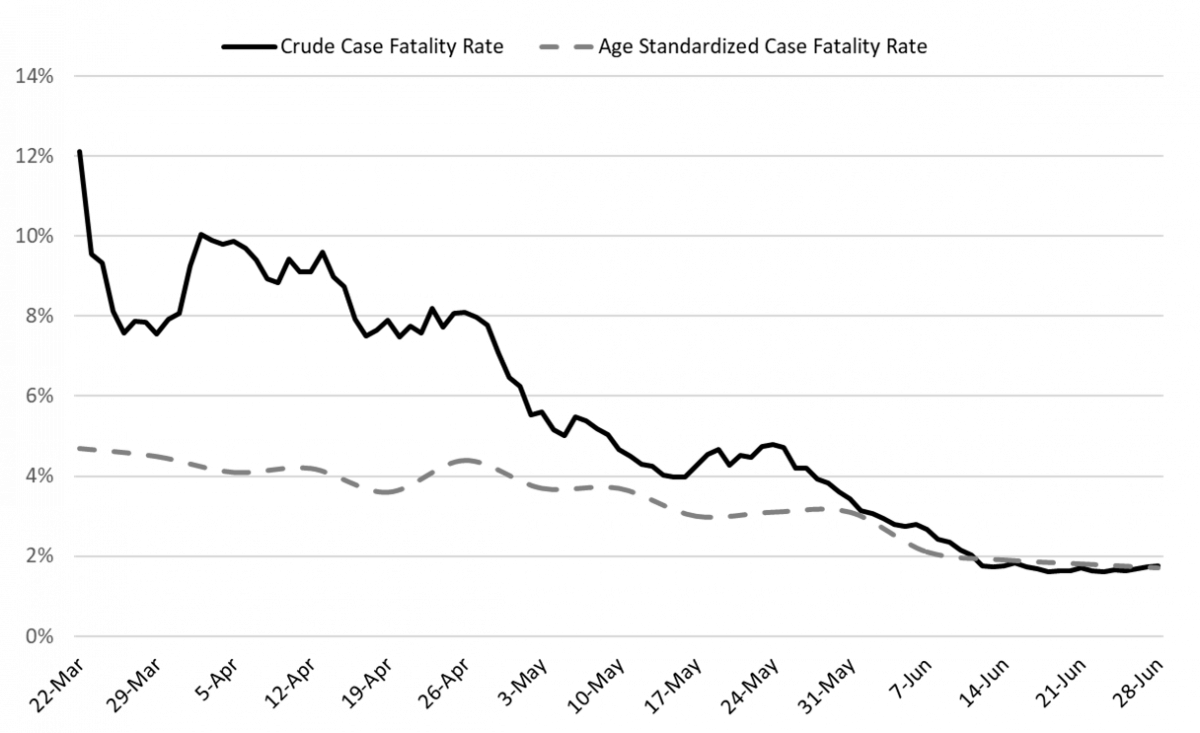
| Figure 13. Crude and Age-Adjusted Covid-19 Case Fatality Rate March 22 – June 28. |
A recent pre-print of a meta-analysis of studies estimating the infection fatality ratio (IFR), a slightly different metric from the CFR, suggests that the IFR is 0.68% (95% CI 0.53 – 0.82). Comparing Arizona’s CFR with the estimated IFR from this study, suggests there are currently 2 - 3 undiagnosed cases for every diagnosed case in Arizona. This is lower than suggested by the CDC several weeks ago.
Pima County Outlook
| Figure 14. Newly Diagnosed Covid-19 Cases in Pima County and Individuals PCR Tested through July 26. |
For the week ending July 26th, 782 Pima County residents were diagnosed with Covid-19. Like state-wide figures, this count likely underestimates the number of diagnosed cases owing to the reemergence of a sizable testing lag. For example, last week’s count of 884 cases was revised to 1355 cases this week, a 53% increase (Figure 8). Likewise, the preceding week was upwardly revised by 22%. Nevertheless, the pace of new case counts is slowing.
Summary:
- The pace of viral transmission continues to slow appreciably as indicated by declining case counts and hospital utilization. Even so, deaths have yet to clearly moderate. Covid-19 remains widespread in Arizona.
- Reporting lag for PCR results is still complicating efforts to precisely gauge changes in viral transmission and conduct timely case identification, contact tracing, and isolation.
- Absolute levels of community-driven viral transmission remain comparatively high as evidenced by large numbers of weekly Covid-19 cases.
- For most locales, government-mandated social distancing restrictions and mask-wearing will be needed for the foreseeable future to relieve overcrowded hospitals.
- Covid-related hospital utilization continues to moderate while excess capacity is being slowly replenished. Adequate capacity should be available for the foreseeable future. Personnel shortages and fatigue will still be problematic, especially in critical care settings.
- From now until January, non-Covid hospitalizations are expected to increase putting additional strain on hospital capacity.
- Many ICUs will remain at or over capacity for the next several weeks due to long length-of-stays for many; maintaining an adequate supply of health care workers will continue to be a challenge.
- Current Covid-19 test capacity is inadequate to meet both clinical and public health demands as the test positive percentage is 14%, well above the recommended 3 – 5%. With about half of results taking ≥5 days, public health efforts to respond to this outbreak remain constrained by inadequate capacity.
MEZCOPH staff is working hard to keep up during the pandemic and we will post the next report to the website as soon as time allows.
Forecast reports to date, available as PDFs
Based on what we know now about this pandemic, we support guidelines for social distancing to slow the spread of the virus and urge everyone to follow the recommendations provided by the Centers for Disease Control and Prevention (CDC) to protect yourself, your family, your neighbors, and your employees. Please heed the recommendations as provided by the CDC, found at the following website: https://www.cdc.gov/coronavirus/2019-ncov/prepare/prevention.html
COVID covid coronavirus virus covid19 corona forecast model