


Note this forecast page is not the most recent forecast available.
View the most current forecast report
Researcher Analyzes Arizona COVID-19 Spread Models for Decision-Makers
The following information regarding the spread of COVID-19 in Arizona was prepared by Joe Gerald, MD, PhD, a researcher at the Mel and Enid Zuckerman College of Public Health (MEZCOPH) at the University of Arizona. This information has also been reviewed by other MEZCOPH faculty.
This data were obtained from the Arizona Department of Health Services COVID-19 webpage and reflect conditions in Arizona as of November 11, 2020.
This information is intended to help guide our response to the outbreak. It is not intended to predict how this pandemic will evolve. Rather, this model extrapolates what might occur if current conditions remain unchanged. As regional authorities and healthcare providers respond, their actions are expected to mitigate the worst consequences of this pandemic.
COVID-19 Disease Outbreak Forecast
Arizona State and Pima County
Updated November 11, 2020
Disclaimer: This information represents my personal views and not those of The University of Arizona, the Zuckerman College of Public Health, or any other government entity. Any opinions, forecasts, or recommendations should be considered in conjunction with other corroborating and conflicting data. Updates can be accessed at https://publichealth.arizona.edu/news/2020/covid-19-forecast-model.
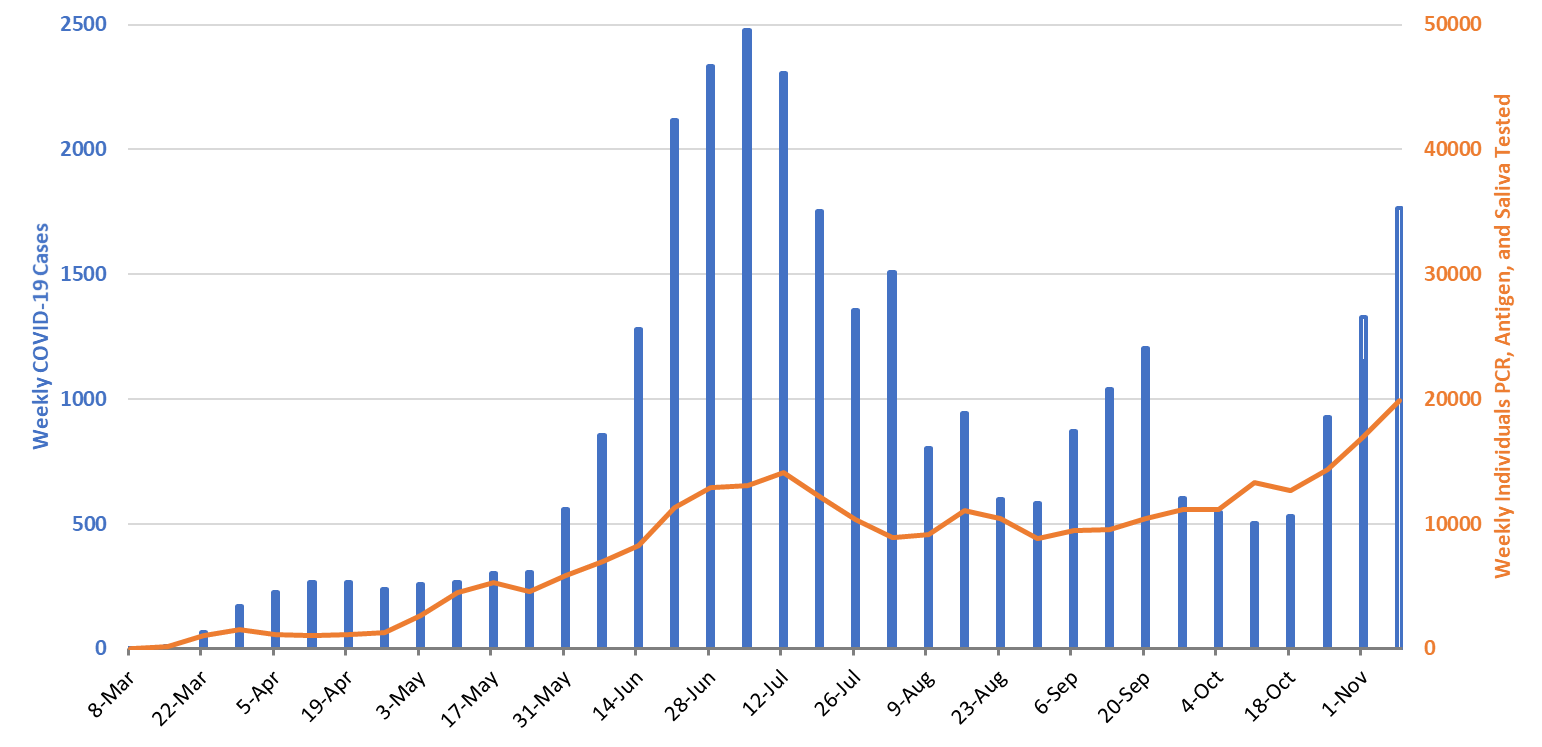
For the week ending November 8th, 13195 new Covid-19 cases were diagnosed in Arizona (Figure 1). This represents a 53% increase from last week’s initial tally of 8597 cases. While reporting delays continue to be minimal, last week’s initial tally of 8597 cases was upwardly revised by 14% (1189 cases) this week which is larger than last week’s 11% revision. A similar revision next week will push this week’s estimate to over 15000 cases. Therefore, we should not be surprised if conditions are worse than depicted in this update.
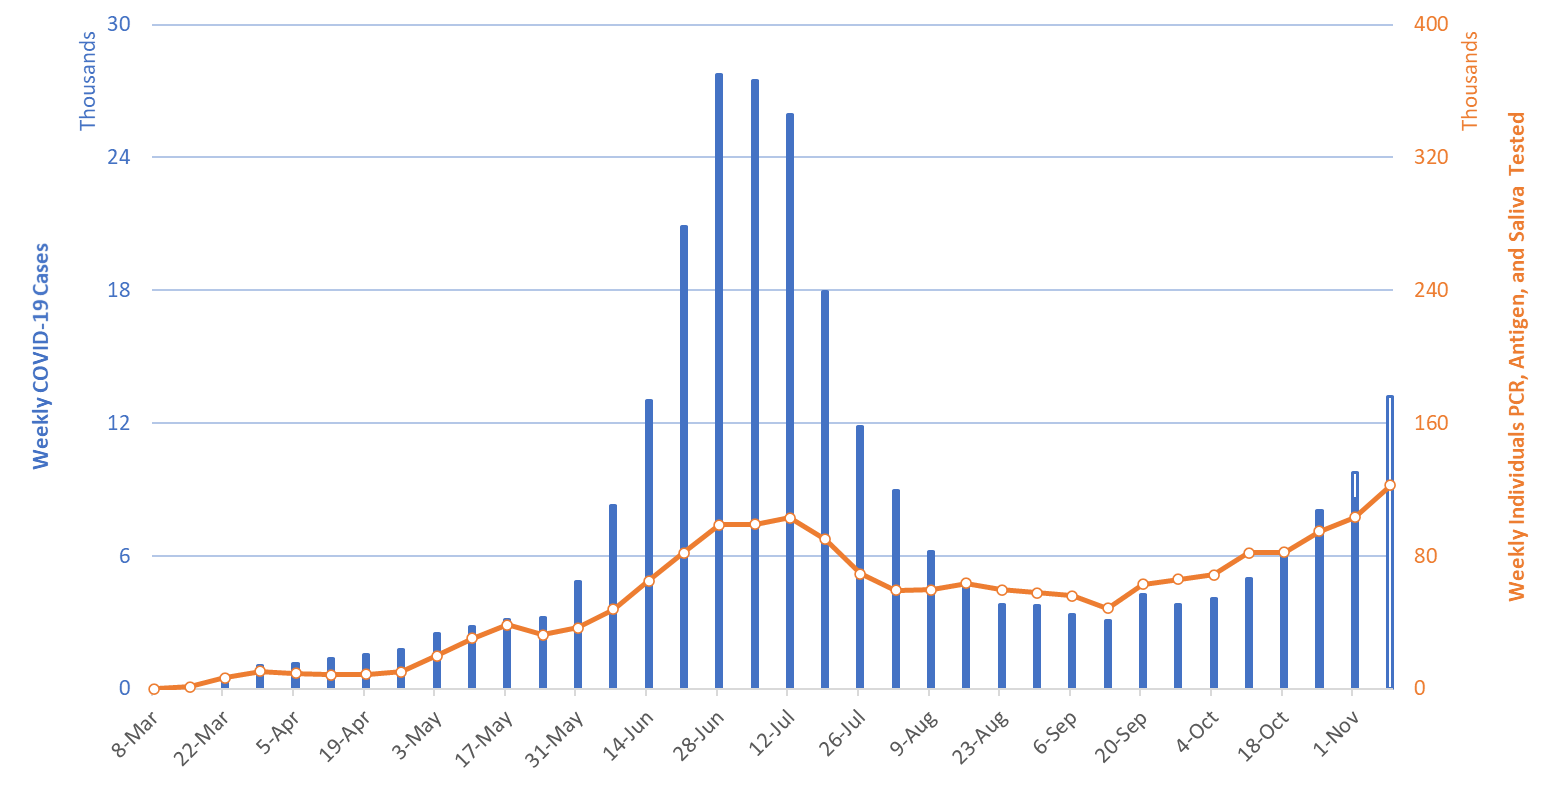
| Figure 1. Newly Diagnosed Covid-19 Cases in Arizona and Number of Individuals Undergoing Covid-19 Diagnostic Testing March 1 through November 8. |
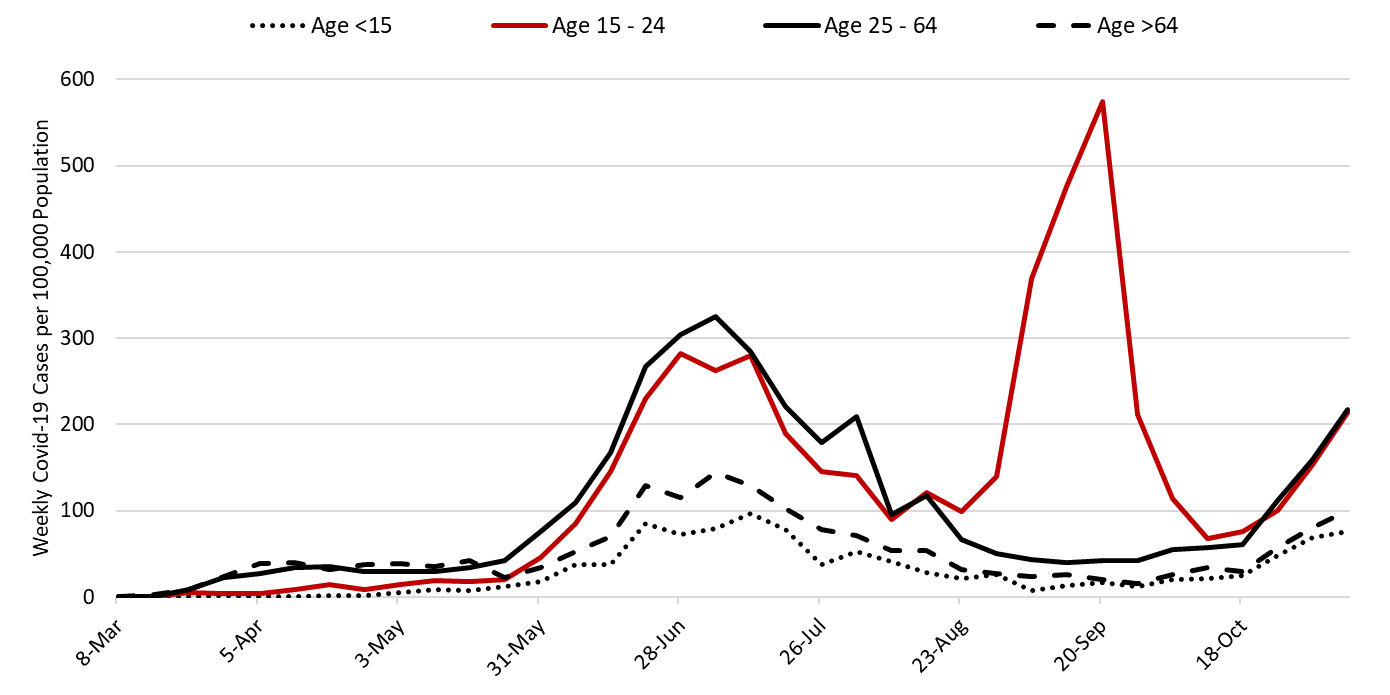
Case counts continue to increase broadly among all age groups (Figure 2). At the risk of sounding like a broken record, current conditions really do warrant an immediate reappraisal of government mitigation efforts as well as reinforcement of individual adherence behaviors with face masks, physical distancing, and hand hygiene practices.
It is difficult to appreciate just how quickly exponential growth can cause conditions to deteriorate. Consider that current transmission levels are on par with those of the second week of June when 12967 cases were diagnosed. A mere 2 weeks later, Arizona’s case count peaked at 27796 weekly cases. If past experience is any guide, Arizona could set a new weekly record before the end of the month.
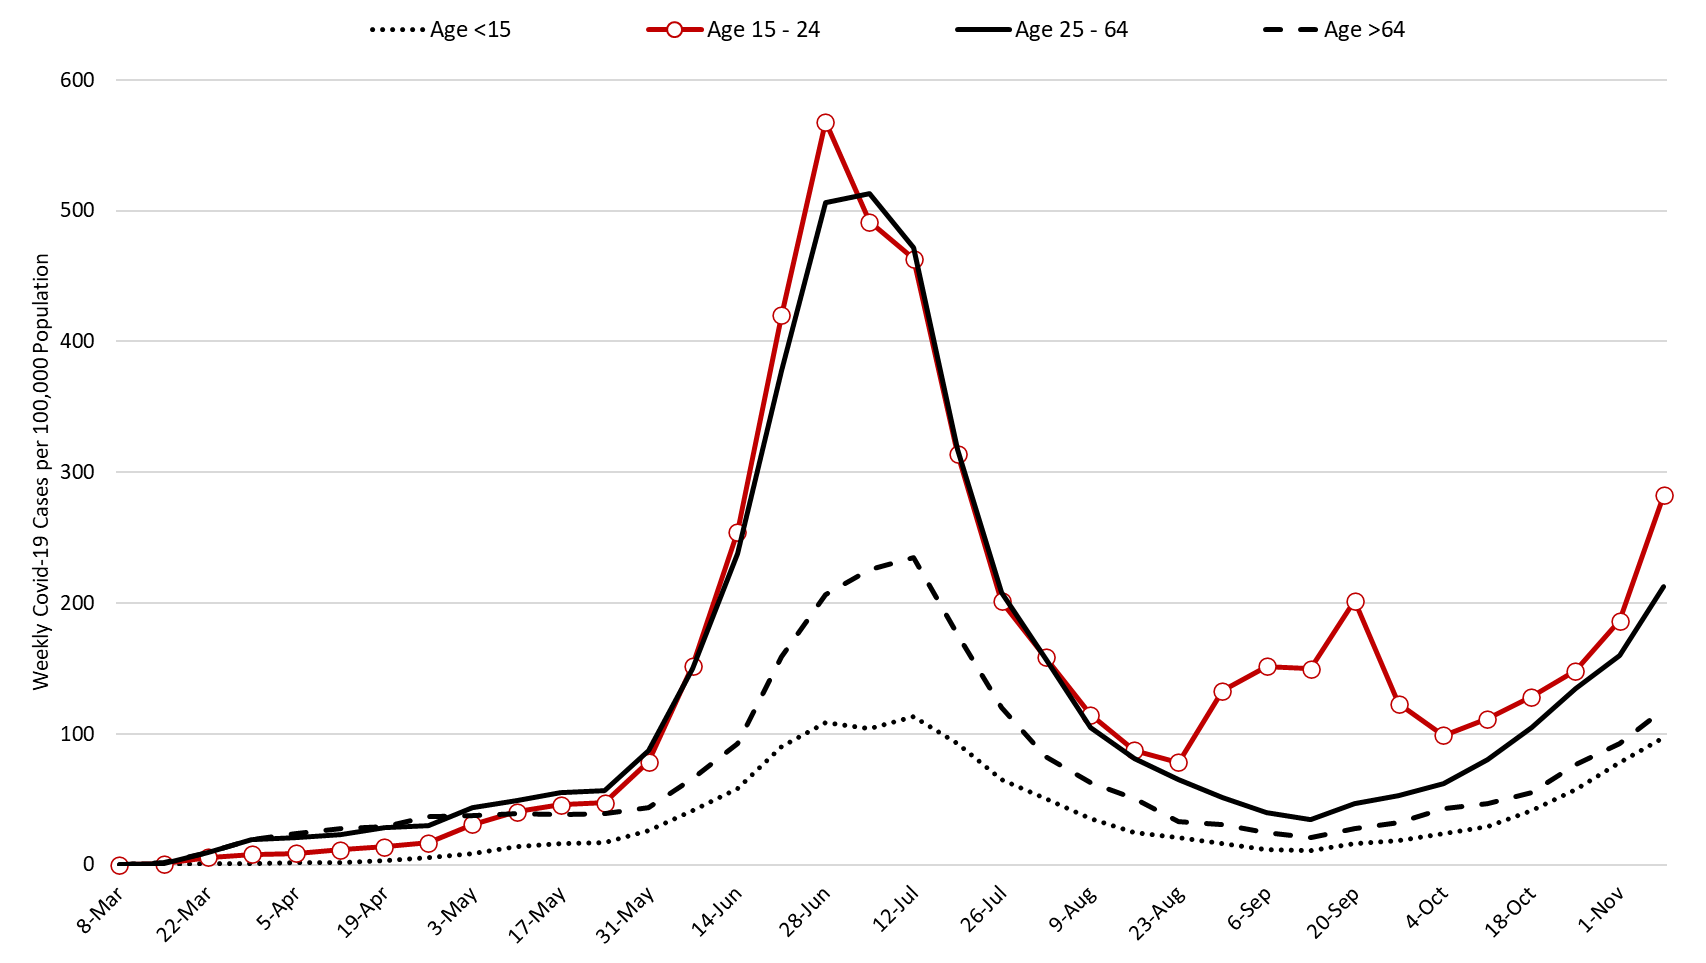
| Figure 2. Newly Diagnosed Covid-19 Cases in Arizona by Age Group March 1 through November 8. |
Even though the same number of Covid-19 cases is yielding fewer hospitalizations and deaths today than in June, Arizona is still poised to overwhelm its hospital capacity unless action is quickly taken. It goes without saying that this year’s Thanksgiving – New Year’s holiday season will be a difficult one for health care providers.
Test positivity among those undergoing traditional PCR testing exceeded 10% this week (Figure 3). From a nadir of 4.8% during the week ending September 6th, positivity has since increased to 13.0%.
Test positivity for antigen tests being conducted by the University of Arizona and by some long-term care facilities and retail clinics increased to 9.9% this week. Test positivity for saliva testing being conducted by Arizona State University for students and other groups increased to 8.6% this week.
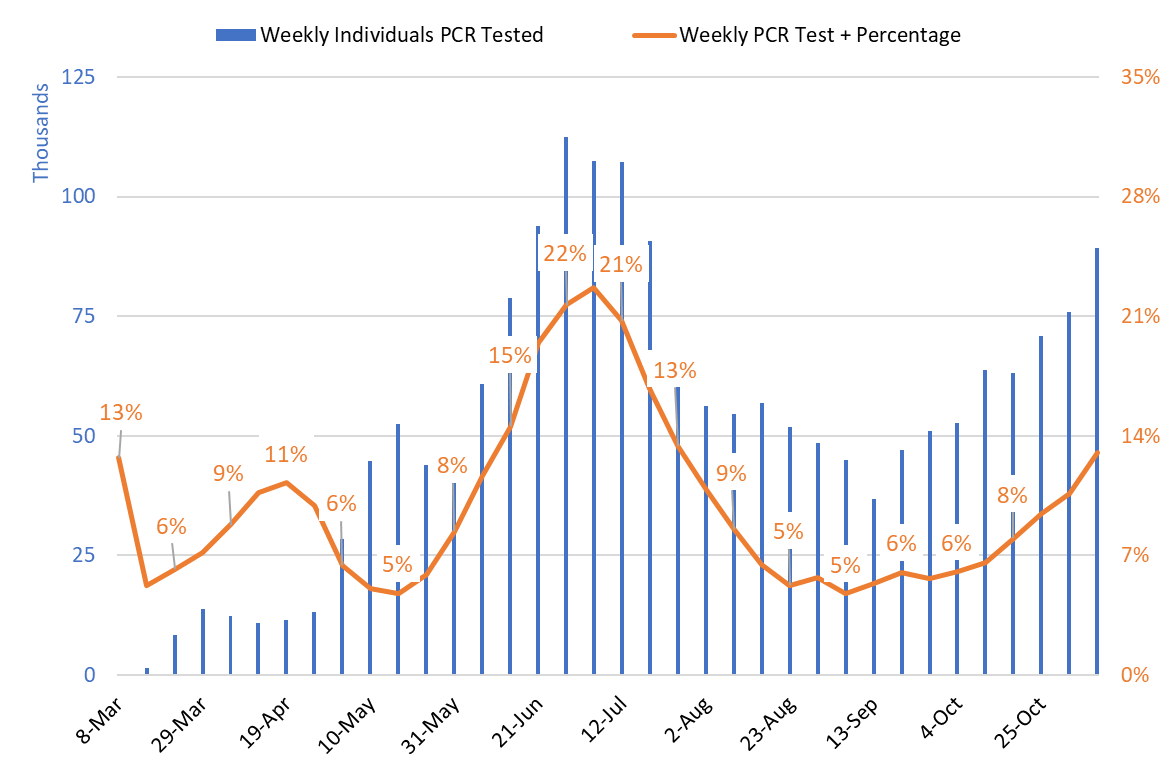
| Figure 3. Weekly Number Patients PCR Tested and Percent with Positive Test March 1 – November 8. |
Fewer patients are undergoing traditional PCR testing now than during peak testing this summer, 89259 versus 107426, respectively. However, the addition of antigen and saliva testing, 3229 and 8681 patients, respectively, brings the total number of patients undergoing some type of Covid-19 diagnostic testing to 101169 last week.
As of November 10th, 1669 Arizona hospital beds were occupied by patients with suspected or confirmed Covid-19. This is higher than the 1306 beds occupied last week (Figure 4).
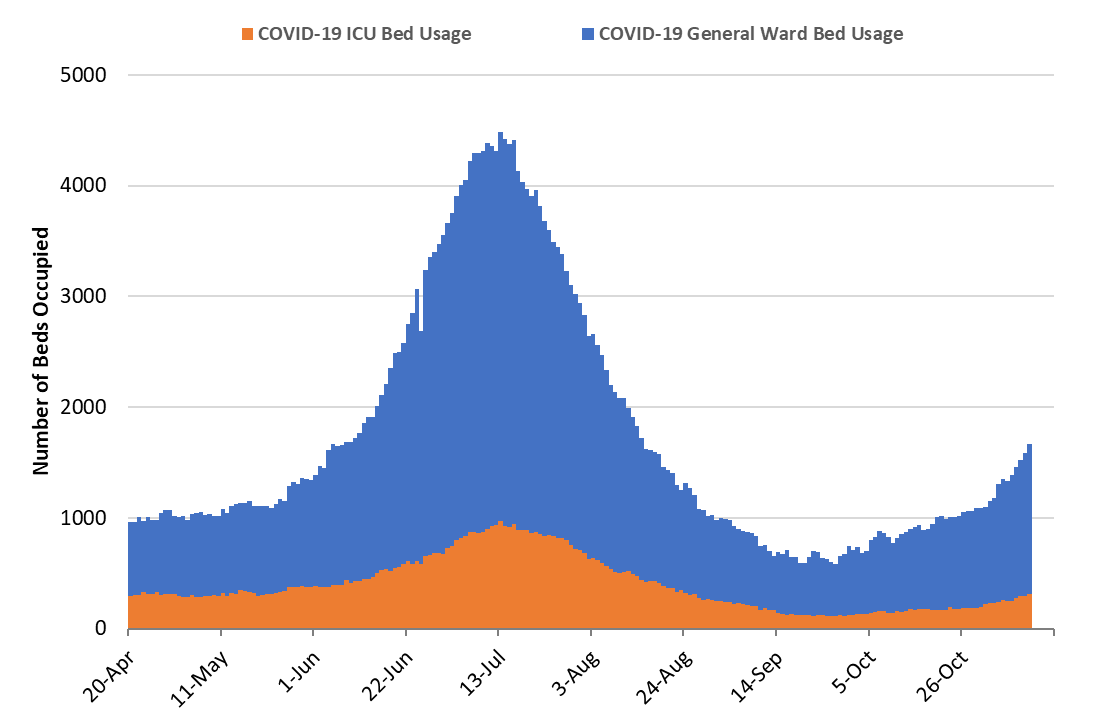
| Figure 4. Arizona Daily Covid-19 General Ward and ICU Census April 20 – November 10. |
Specifically, 1360 (16%) of Arizona’s 8611 general ward beds were occupied by Covid-19 patients, a 28% increase from last week’s 1065 occupied beds. An additional 1061 (12%) beds remained available for use which is fewer than last week’s 1250 available beds. The percentage of general ward beds occupied by patients with confirmed or suspected Covid-19 has increased from a low of 6.2% on September 13th to 15.8% on November 10th (Figure 5, panel A).
As of November 10th, 309 (18%) of Arizona’s 1679 ICU beds were occupied with Covid-19 patients, a 28% increase from last week’s count of 241 patients. An additional 243 (14%) ICU beds remain available which is higher than last week’s 236 beds. The percentage of ICU beds occupied by patients with Covid-19 has increased from a low of 6.2% on September 13th to 18.4% on November 10th (Figure 5, panel B).
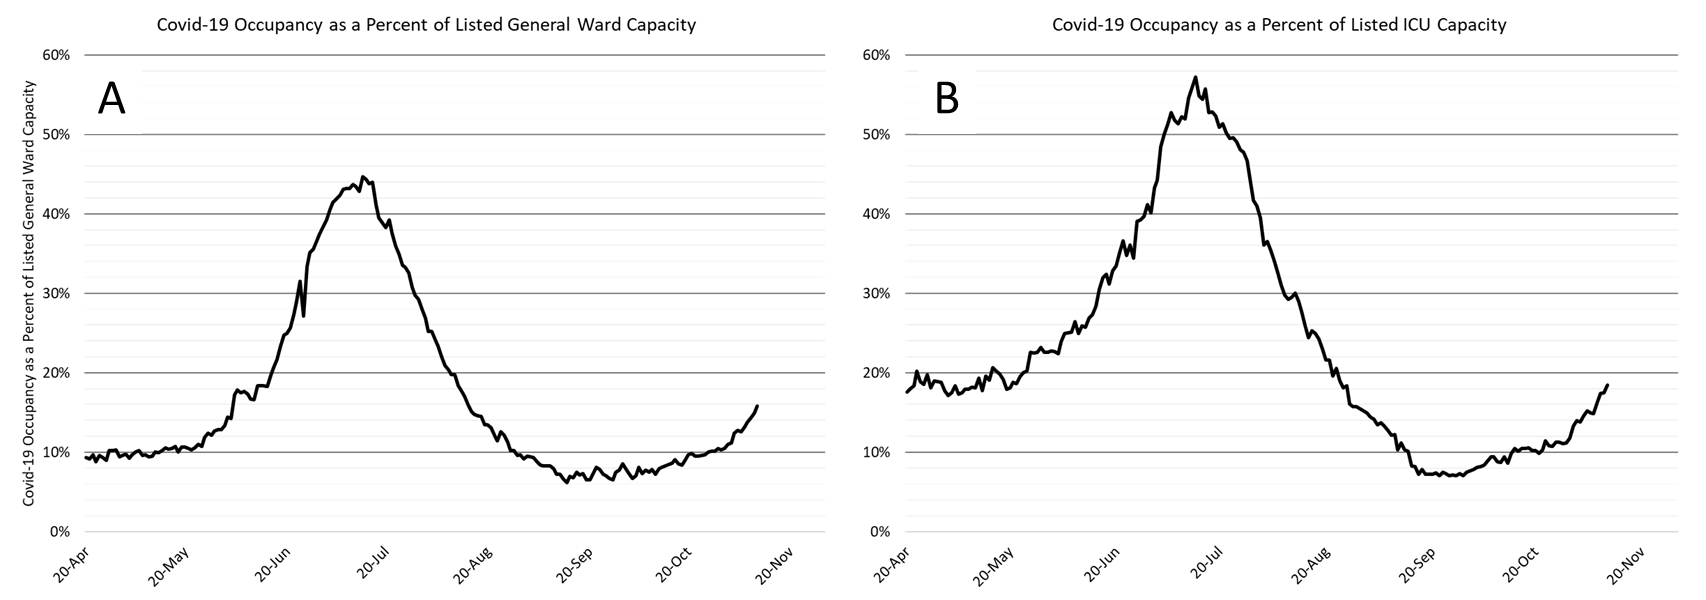
| Figure 5. Covid-19 Occupancy as a Percent of Listed General Ward (A, left) and ICU (B, right) Capacity in Arizona April 20 – November 10. |
Arizona hospitals’ safety margin of available beds continues to erode in both the ward and ICU (Figure 6). For example, the lowest bed count for available beds during the worst of the summer outbreak occurred on July 10th when only 946 general ward beds were available. On November 10th, 1061 beds remain available. In the ICU, the nadir of available beds occurred on July 7th when there were only 145 beds available. On November 10th, 243 beds remain available. While occupancy data suggest Arizona hospitals should be under greater strain, the fact that admissions are dispersed across multiple units (not just Covid-admissions) means the workload is more evenly distributed across physicians, nurses and other health professionals. As Covid-19 admissions continue to increase this advantage will be lost.
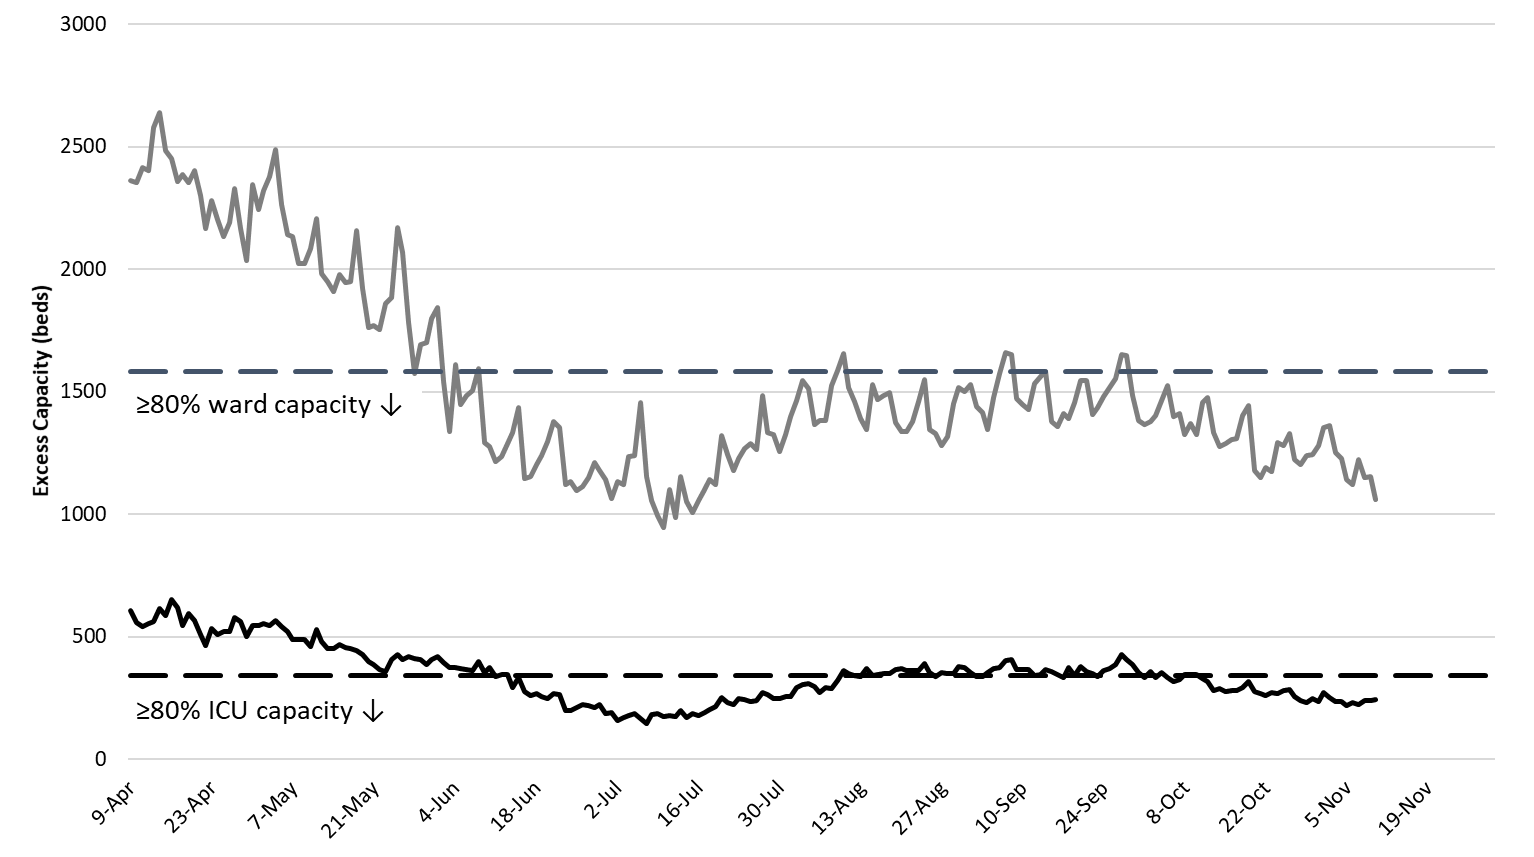
| Figure 6. Observed Excess Non-Surge General Ward and ICU Capacity April 20 – November 10. |
This current outbreak differs from the June outbreak in several ways that tend to result in fewer hospital admissions at the same level of Covid-19 cases. First, Covid-19 infections have shifted towards younger patients (Figure 7) who are less likely to require hospital care.
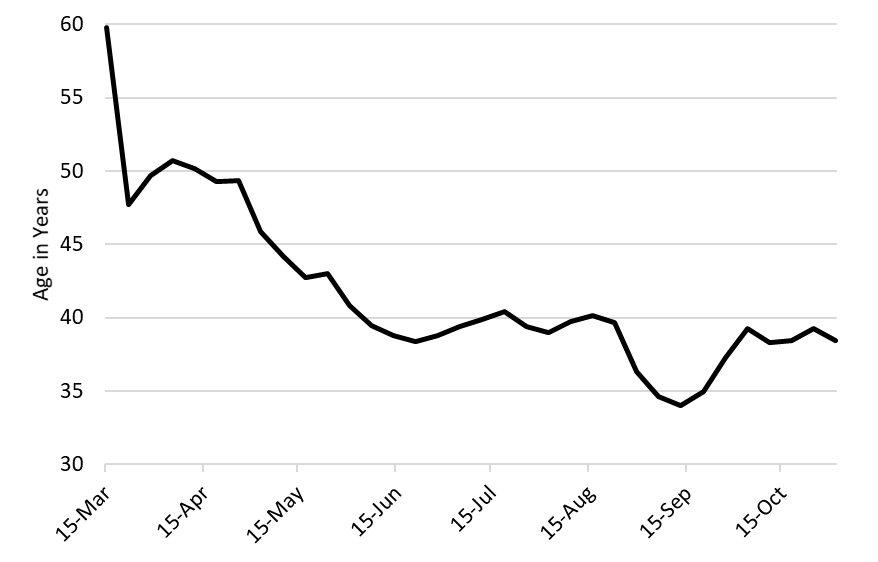
| Figure 7. Mean Age at Covid-19 Diagnosis in Arizona April 20 – November 1. |
Second, better infection control practices in long-term care settings have led to fewer cases among the medically frail (Figure 8).
The factors along with improving treatments, more experienced providers, and greater testing accessibility have led to a 23% reduction in hospitalizations and a 45% reduction in ICU cases for the same number of Covid-19 diagnoses (Figure 9, further below).
If rising community-transmission spills over into long-term care settings, then admissions could rise more quickly. Arizona hospitals also have less reserve capacity now than when hospital occupancy was lower this summer. The return of part-time residents, a backlog of elective procedures, and non-Covid respiratory illnesses also mean that hospitals will reach capacity sooner than they did this summer. If that happens, Arizona can expect less external assistance this time since many other states are experiencing their own outbreaks.

| Figure 8. Pima County Covid-19 Hospital Admissions Stratified by Residence Setting (available here). |
Because hospital admissions are a lagging indicator, Covid-19 occupancy will continue to increase even after viral transmission slows. Because hospital occupancy depends on the number of admissions and the length of stay, hospital resources tend to be under greater strain after the peak of viral transmission. On June 15, when there were about 2000 cases per day on the upswing, there were 1389 Covid-19 patients on the general wards. But on July 22, when there were approximately the same number of cases per day on the downswing, there were 3146 patients on the general ward. We won’t “feel” trouble until after we are able to act upon it.
All told, the same number of Covid-19 cases during this outbreak will not generate as many hospital admissions as during this summer’s outbreak (Figure 9). It will produce even fewer ICU admissions.
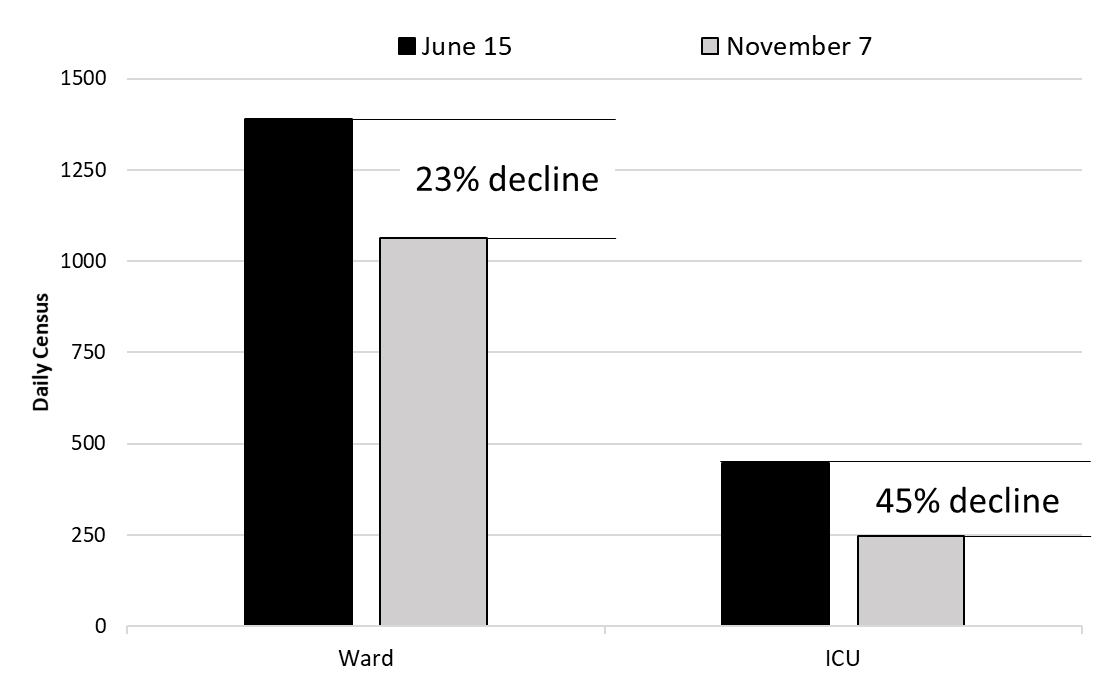
| Figure 9. Covid-19 General Ward Occupancy (Panel A) and ICU Occupancy (Panel B) at 2000 Cases per Day on June 15 and November 7. |
This means that Arizona can “tolerate” greater viral transmission without risking overwhelming hospitals or ICUs. However, this extra breathing room is offset to some degree by higher hospital occupancy this time of year. Even if we view these changes optimistically, our capacity to provide care to all those who need it is invariably limited.
Given our current trajectory, it is folly to think that our efforts are in any way sufficient. If we continue to allow a large number of cases to accrue over a short period of time, we will overwhelm our hospitals in the coming weeks.
With 617 deaths, the week ending July 19th remains Arizona’s deadliest week (Figure 10).
| Figure 10. Weekly Known Arizona Covid-19 Deaths March 1 – November 8. |
Weekly Covid-19 mortality reached a nadir of 45 deaths the week ending October 4th. Because cases have been increasing, deaths are now slowly trending up but remain well below rates observed in April in May. Fewer cases among residents of long-term care facilities and improved treatment are helping to keep fatalities low (Figure 11).
| Figure 11. Pima County Covid-19 Deaths Stratified by Residence Setting (available here). MMWR Week 40 Corresponds to October 3. |
Pima County Outlook
For the week ending November 8th, 1765 Pima County residents were diagnosed with Covid-19 (Figure 12). This represents a 53% increase from the 1152 initially reported cases last week. Test reporting remains relatively timely, but last week’s initial report of 1152 cases was upwardly revised by 15% (177 cases) this week.
| Figure 12. Covid-19 Cases and Individuals Undergoing Diagnostic Testing in Pima County from Mar 1 – Nov 8. |
Cases are increasing among all age groups and faster than this update indicates (Figure 13).
| Figure 13. Covid-19 Cases by Age Group in Pima County from August 9 – November 8. |
Summary
- Viral transmission in Arizona is increasing more rapidly than in past weeks, particularly among those 15 – 64 years of age. If this “surge” is not quickly addressed, new Covid-19 cases will overwhelm our capacity to provide optimal hospital care within a matter of weeks.
- Community-driven transmission has now surpassed rates observed during the second week of June when 12967 cases were diagnosed. At current transmission levels, Arizona is not far from exceeding its previous peak of 27796 weekly cases at the end of June.
- New cases are currently being diagnosed at a rate of 192 cases per 100,000 residents per week. This rate is increasing by approximately 55 cases per 100,000 residents per week.
- To date, the maximum weekly case rate was 429 cases per week on July 2 and the maximum week-over-week increase in the case rate was 117 cases per week on June 23.
- Geographic differences continue to manifest by county with Graham, Gila, Coconino, Yuma, and Navajo counties having higher than average per capita rates. Even so, the largest number of new cases are being diagnosed in Maricopa County.
- Mask-wearing ordinances will be needed for the foreseeable future to mitigate the spread of Covid-19. Additional measures are quickly needed to address “quarantine fatigue” and other lapses in mitigation efforts.
- Large, social gatherings should be avoided.
- When possible, residents should avoid prolonged contact in indoor spaces where physical distancing is not adequate and adherence to face masks is low.
- Elected officials, community leaders, and businesses should model these behaviors, encourage others to follow suit, and enforce penalties for those who do not.
- Hospital occupancy is increasing due to Covid-19 transmission. Our current safety margin continues to erode and is close to reaching levels not seen since the summer outbreak.
- The fall-winter viral respiratory season plus the return of part-time residents who winter in Arizona will place increasing strain on our hospitals through January.
- If current trends continue, Arizona is on track to experience a major resurgence during the Thanksgiving – Christmas – New Year holiday season.
- Owing to outbreaks in other states, shortages of critical shortages of supplies and skilled personnel may be more difficult to overcome this time around.
- While Covid-19 test results continue to be returned in a timely manner, test positivity continues to increase indicating an emerging mismatch between capacity and demand.
- Covid-19 mortality is now increasing.
- Avoiding cases among those ≥65 years of age, particularly those residing in long-term care facilities, is critical to keeping mortality low. For example, LTC residents in Pima County have accounted for <5% of the county’s cases but about 14% of hospitalizations and 39% of deaths.
Forecast reports to date, available as PDFs
Download PDF to view additional charts of Arizona counties, available in appendix of report.
Based on what we know now about this pandemic, we support guidelines for social distancing to slow the spread of the virus and urge everyone to follow the recommendations provided by the Centers for Disease Control and Prevention (CDC) to protect yourself, your family, your neighbors, and your employees. Please heed the recommendations as provided by the CDC, found at the following website: https://www.cdc.gov/coronavirus/2019-ncov/prepare/prevention.html
COVID covid coronavirus virus covid19 corona forecast model